Network problems can arise in any section of your IT operations and the existence of more technology, such as wireless, cloud, and virtualization systems make tracking network performance very complicated
Network monitors need to be able to spot problems early before they drag the network down to the point where issues become noticeable and employees can’t perform their work.
Network administrators have to fix problems quickly as soon as they arise and the time it takes to investigate issues can pile pressure and scorn on network professionals from every level of the organization.
Complicated network technology and all of its potential faults inspired the creation of TotalView by PathSolutions. This tool ensures that networks keep working properly.
About PathSolutions

PathSolutions, Inc. started operations in 2007. The company’s founder was Tim Titus, a network manager. Titus had grown frustrated by the tools available to monitor and investigate networks and troubleshoot when things go wrong.
Titus maintained that the reporting of network monitors should give more detailed information that would enable the root cause of a problem to be identified quickly. He set up a project workshop in his garage to create such a system. The result of his exploration was TotalView and he started PathSolutions to market the new tool.
Tim Titus works at the business to this day. He has the role of Chief Technology Officer. The seat of the CEO is filled by Andy Bohart, an ex-marine who had been involved with PathSolutions right back at its inception – originally as a consultant. The company is still privately owned and is based in Santa Clara, California. PathSolutions has 25 employees and annual revenue of $4.8 million.
PathSolutions TotalView
PathSolutions TotalView is a network monitor that includes wireless networks. The internet is also a network and the tool can monitor the performance of connections to specific destinations.
The basis of the TotalView live monitoring service is availability tests and network device checks. The results of these recursive checks are summarized in the network monitoring home screen.
An issue arising from packet transfer speeds slowing or devices reporting status problems raises an alert, kicking off the research phase, which is a manual process, supported by the TotalView dashboard.
Network Performance Monitoring
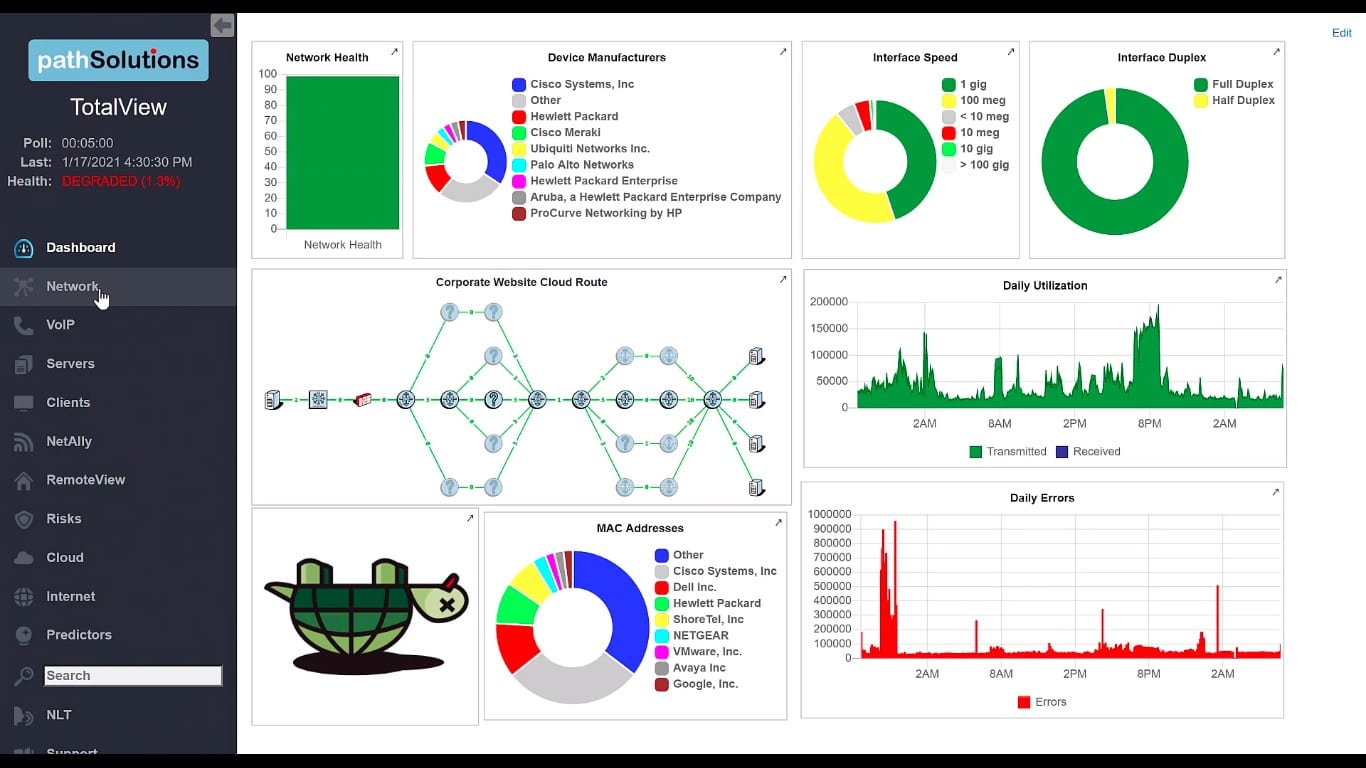
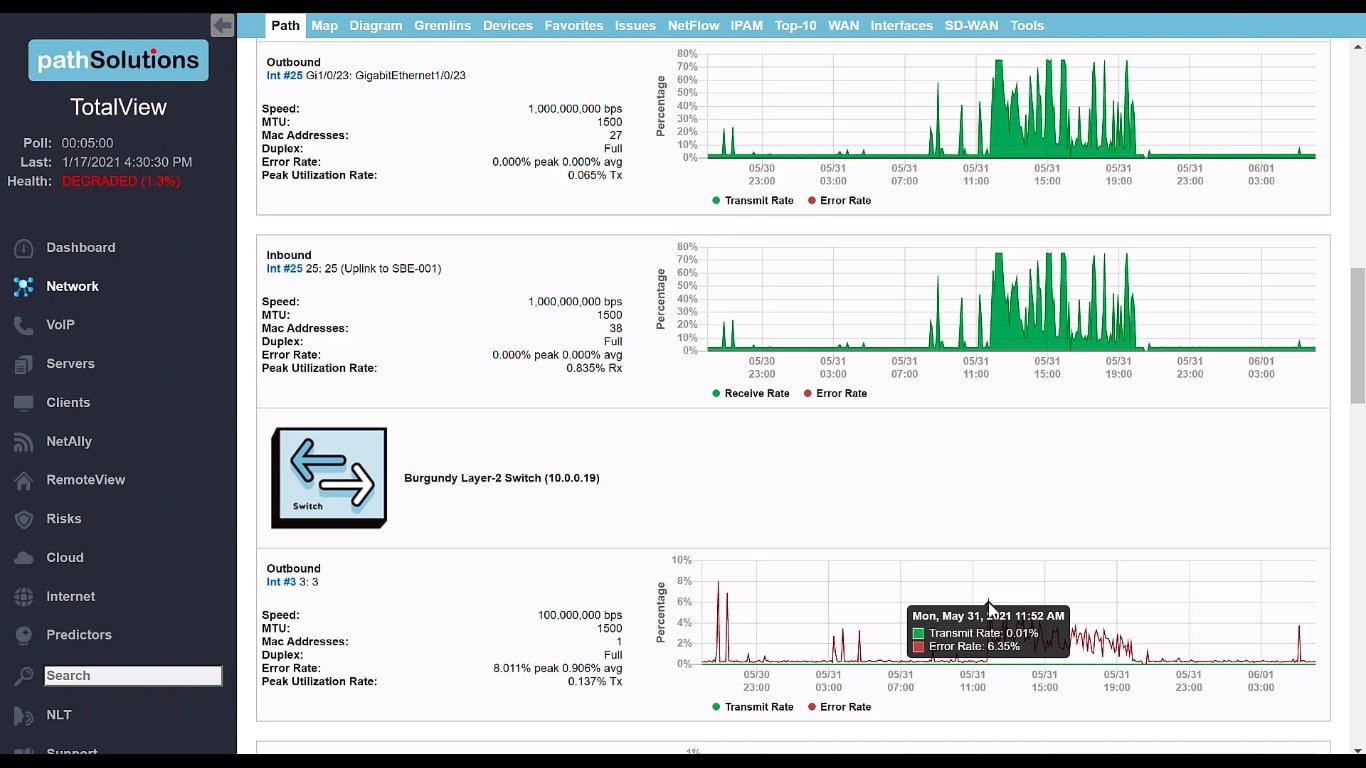
Every network manager needs a performance monitor that shows constantly updated statistics on network devices and the traffic traveling between them. The TotalView dashboard’s home screen displays graphs and tables of live data.
The networking monitoring screens need some static data to work from, meaning a list of devices on the network. The tool performs network discovery and automatically generates a list of all switches and routers, which forms an asset inventory. This process is performed with the Simple Network Management Protocol (SNMP), which continues to poll for device statuses, simultaneously discovering any new devices added to the network.
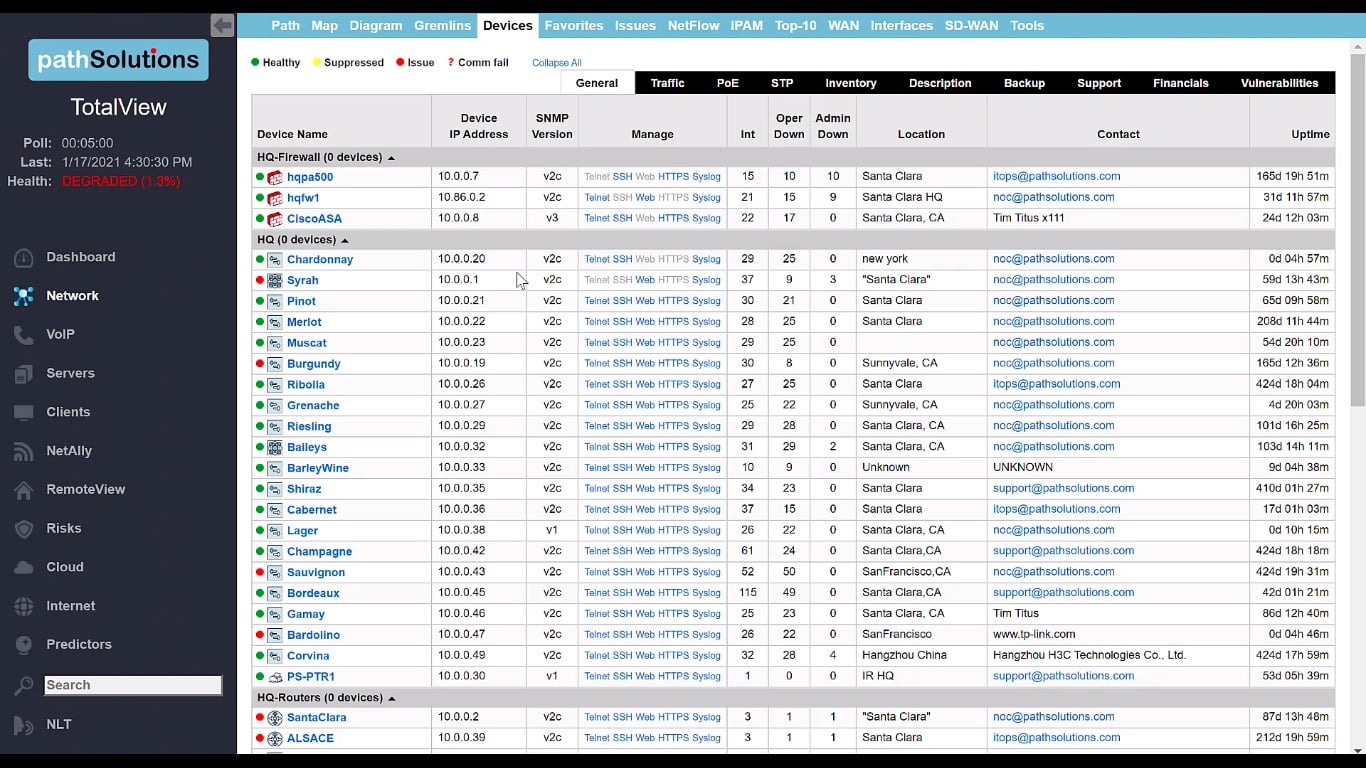
Statuses are shown in a traffic light indicator at the beginning of each device record in the inventory. Clicking on that record drills down into the detailed report for that device. This view shows information about each interface on the device and again uses a traffic light color indicator for statuses.
This internal network view provides the following:
- Network device status monitoring
- VoIP performance monitoring.
- Virtualization monitoring.
- Wireless network monitoring.
The dashboard also includes a network mapper, which displays how all devices link together. SNMP gathers reports from each device on the statuses of its components, such as interface and memory capacity utilization. If something goes wrong with a device, that issue shows up in the dashboard immediately.
Fault reporting
Root cause analysis starts in the regular network monitoring screens. When the network manager drills down into the detailed report for a device interface, the screen shows activity graphs and also provides reasons for the problems that the device is experiencing.
Getting a list of the errors currently experienced by the device interface shows a detailed list of problems. Clicking on each error category in the list brings up a description of how such an error occurs and what steps should be taken to investigate the problem further and rectify the issue
It could be that the information given on this screen is enough to provide a solution for the performance issue.
Network Problem Root Cause Analysis
The diagnostic tools in the TotalView dashboard include a path analysis service. By entering the IP addresses of two devices on the network, you get a view of every device on the path between them. This shows an activity graph for each of those devices over the past 24 hours and can reveal a device that experienced packet loss or some other problem.
A network map shows multiple sites on a world map and statuses are displayed on these links. Drilling down, you can then examine a site map to see devices that are in trouble. Network diagrams are generated when that function is accessed so it always shows the current status of the network.
An Issues tab within the network monitoring dashboard summarizes all of the problems that you can see defined by looking through every page of the device status reports. This is a shortcut that saves you time by providing one page to see all problems. You can then work through the list and access details on each problem that needs to be fixed.
There are many status report functions in the dashboard that retain data from the past 24 hours, so you can track back through recent history to check on events at previous moments.
Diagnostic Tools
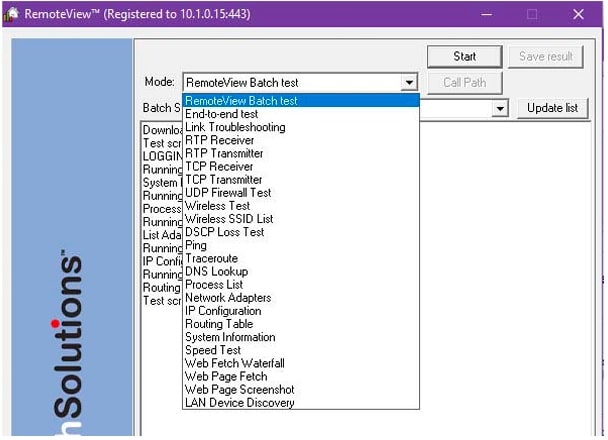
A package of investigative tools within the TotalView bundle performs live tests on demand so that you can troubleshoot more complicated problems that can be resolved through the reports and tips in the network performance screens.
The library of tools includes systems to look into issues on the remote devices used by work-from-home workers and it can also be used by managed service providers to investigate issues on client networks. This package of remote device troubleshooting tools is called RemoteView and it is an optional extra that you can add to your purchase when you buy TotalView. You need to install a RemoteView agent on each remote device to make these tools available.
Network Security Management
The main security system in the TotalView package is a configuration manager. This allows the administrator to set up automated device configuration backups and then monitor for changes to device settings.
The system will alert the administrator if any setting has changed and gives the option to reapply the backup to wipe out that change. This process can be set to run automatically and that prevents vulnerabilities from emerging.
PathSolutions also offers the TotalView Security Operations Manager. This is an add-on module that assesses security risks on the network and improves the threat reporting of a SIEM system. This is a large package of security tools, for which there is not enough space in this review to give a detailed assessment.
Administration tools
Network monitoring can be viewed in terms of VoIP performance with Quality of Service metrics that can highlight delivery problems. There is also a Predictor service that performs capacity planning and can identify when resources are running short.
The system includes a NetAlly section for wireless network diagnostics and there are also monitoring pages for servers and clients on the network.
The system includes a NetFlow module that gathers traffic flow and bandwidth utilization capacity that can help with traffic shaping and there is an IPAM view in the system for monitoring address issues.
External monitoring
The TotalView console includes menu items to examine the performance of internet connections. These are mainly Ping-based tests that can be set to run automatically and repeatedly to important destinations, such as remote user devices and other sites or cloud platforms.
Any cloud services that the company uses can be monitored by the TotalView system. You need to set up the tool with access credentials for all of your accounts and then it will report on the performance of the cloud servers that support your platform subscriptions.
PathSolutions TotalView system requirements
PathSolutions TotalView is an on-premises software package. It runs on Windows Server 2012, 2012 R2, 2016, and 2019. The system can be run on a hypervisor but implementations that will be monitoring more than 100,000 nodes need to be installed directly on the operating system. Implementations to monitor less than 25,000 nodes can be installed on Windows 10 or Windows Server.
PathSolutions TotalView pricing
PathSolutions doesn’t publish a price for TotalView. The software package is sold for a one-time payment for a perpetual license and you need to request a quote to get the price for your implementation.
PathSolutions TotalView strengths and weaknesses
PathSolutions built TotalView with the intent of laying down root cause discovery paths with every live performance monitoring report. This is a very useful purpose and it makes sense to accumulate background information while reporting on statuses. We have identified several benefits and shortfalls in this package.
Pros:
- Automatic device discovery.
- Creation of a constantly updated asset inventory and network topology map.
- Able to monitor virtualizations and VLANs for VoIP.
- Tracks Quality of Service metrics for interactive applications.
- Can reach out across the internet to check connections to cloud services.
- Monitors inter-site connections.
Cons:
- Doesn’t have any companion modules to monitor applications.
- No SaaS version.
Alternatives to PathSolutions TotalView
PathSolutions TotalView is a useful system for network managers that need to track network performance, predict resource bottlenecks, and quickly identify the root cause of problems as soon as they emerge. This isn’t the only network performance monitor on the market and a number of the rival systems to PathSolutions TotalView can be considered exceptional.
Here is our list of the best alternatives to PathSolutions TotalView:
- ManageEngine OpManager (FREE TRIAL) This tool tracks network device and server performance with an alerting mechanism to warn of arising problems. The tool includes autodiscovery, an asset inventory manager, and a topology mapper. This system can direct you straight to the cause of an issue. This software package installs on Windows Server, Linux, AWS, and Azure and you can get it on a 30-day free trial.
- Site24x7 Network Monitoring This cloud-based network performance tracker is offered in packages of monitoring systems that include server and application monitoring. The combination of layer monitoring allows rapid identification of the root cause of performance issues and fast resolution. Available for a 30-day free trial.
- Paessler PRTG (FREE TRIAL) This package of monitoring tools includes network performance tracking systems that identify, record, and map all network devices and then constantly check on their availability. Working with network, application, and server monitors, this combination of tools can quickly show the reason for any performance issues. The package runs on Windows Server and is available for a 30-day free trial.
- SolarWinds Network Performance Monitor This on-premises network monitoring system tracks the statuses of network devices with SNMP routines. The tool searches the network and identifies each device, creating a network inventory and a network topology map. If performance issues arise, the tool will raise an alert, giving technicians time to take action before performance impairment is noticeable by users. The system installs on Windows Server.
- Datadog Network Performance Monitor This is a network traffic monitor that can identify bottlenecks and resource issues that can impair network performance. A companion tool, called the Network Device Monitor polls network devices for status reports, using SNMP. The combination of these two tools gives you a full view of possible performance impairment issues. Delivered from the cloud and available for a 14-day free trial.
- Nagios XI This on-premises monitoring system covers networks, servers, and applications. The network monitoring services in the package watch device health and traffic patterns. Live observations of network capacity and utilization help in the tracing of underlying causes of any performance issues. The bundle installs on Linux or Windows over a hypervisor and you can get it on a 30-day free trial.
