When a piece of software starts up, the operating system serving it creates a program to run the associated program. Some programs run one, while others are written to work continuously in a loop (daemons).
Processes sometimes hang because they are waiting for a resource that has been locked by another process. Programs are not always written to deal with every eventuality and there can be processes still live, while effectively not doing anything.
It is a good idea to look through the list of processes and kill off any that seem to have stalled and remove suspicious processes that you don’t recognize. However, this can be a time-consuming task and it is better to use an automated tool to monitor and manage processes.
Here is our list of the best processing monitoring tools:
- SolarWinds Server & Application Monitor EDITOR’S CHOICE A tool to monitor the health of servers and the processes that they run in support of applications. It runs on Windows Server. Start a 30-day free trial.
- Site24x7 (FREE TRIAL) A cloud-based monitoring service that has a server and application monitoring module. It can monitor multiple servers on many sites and also cloud servers. Access a 30-day free trial.
- ManageEngine Applications Manager (FREE TRIAL) A monitor for applications that also tracks the processes that they spawn and checks the health of the host. It runs on Windows Server and Linux. Download a 30-day free trial.
- Paessler PRTG (FREE TRIAL) An infrastructure monitor that covers networks, servers, and applications. The tool is able to present live data on processes. It runs on Windows Server. Download a 30-day free trial.
- Nagios XI An infrastructure monitor that includes server monitoring and has thousands of extensions available. It runs on Linux and can be run over a VM on top of Windows.
- Icinga 2 A fork of Nagios with a very good interface and great data visualizations. It installs on Linux.
- Zabbix An attractive user interface fronts this free monitoring system for networks, servers, and applications. It installs on Linux, macOS, and Unix.
- Datadog Infrastructure A cloud-based service that monitors networks, servers, and applications. Security add-ons are also available.
- Sysinternals Process Explorer A free process monitor that is straightforward and easy to use.
Native process monitoring utilities
All operating systems include a utility that shows current processes. In Windows, this utility is the Task Manager. To get it, right-click on the Taskbar and select Task Manager from the pop-up menu that appears.
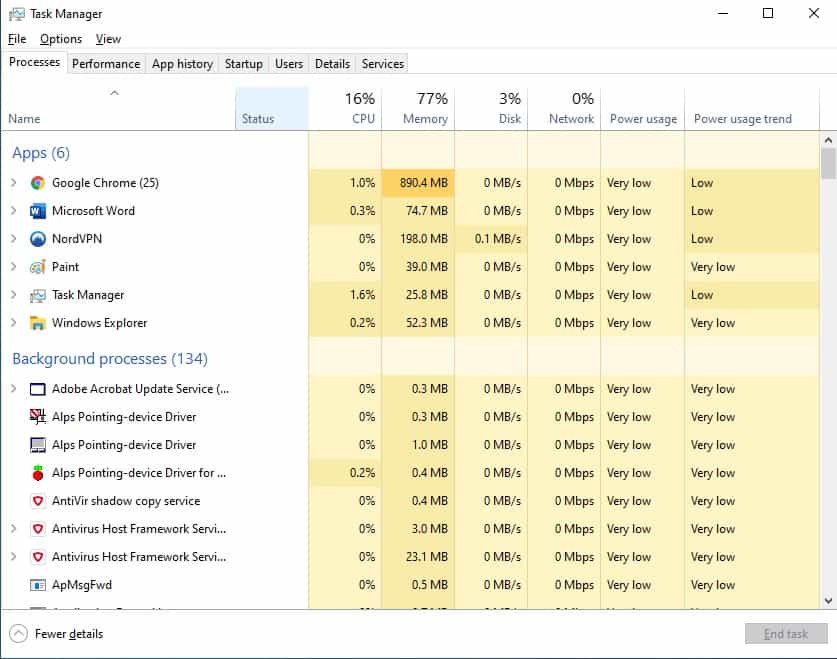
This utility list all processes in categories. The first category is Apps, which are the processes that the user sees on the screen. Background Processes are listed next. These usually serve the Apps that the user has launched and also include system utilities and ongoing tools, such as antivirus software. The last and longest list is Windows Processes, which are all of the programs that the operating system runs.
For each process, the Task Manager shows CPU usage and a percentage of total processing power. Memory and Disk Space are expressed in megabytes. Network I/O per process is displayed in Mbps and the last two columns in the Task Master window relate to the power usage of each process. All of these metrics are aggregated as a percentage of available resources.
When the user clicks on a process, an End task button at the bottom of the window becomes active.
In Linux, Unix, and macOS, users need to type in ps -aux to see all running processes. The output from this command shows:
- The user account that launched the process
- The process ID (PID)
- CPU and memory usage as a percentage of total available resources
- Virtual memory usage (VSZ)
- Resident set size (RSS)
- Terminal associated with the process (TT)
- A process status code (STAT)
- The date and time that the process started
- The command that launched the process.
The user needs to issue a kill command with the process ID in order to stop one of the processes.
The best process monitoring tools
Our methodology for selecting process monitoring software
We reviewed the market for process monitoring systems and analyzed the options based on the following criteria:
- Monitors for processes running on servers and PCs
- A monitoring service that can link processes to underlying resources
- Alerts for resource exhaustion
- The ability to run a small program on board a device
- A monitor with a small processing footprint
- A free tool or a paid system with a free trial for a no-cost assessment period
- A paid tool for large systems of a free tool for individual devices
We followed the guidelines of these selection criteria when searching for process monitors and we also made sure to look for large systems that are suitable for large businesses and small device-resident monitors for use by small businesses.
These tools don’t just provide a monitoring view, they perform the monitoring task for you.
1. SolarWinds Server & Application Monitor (FREE TRIAL)
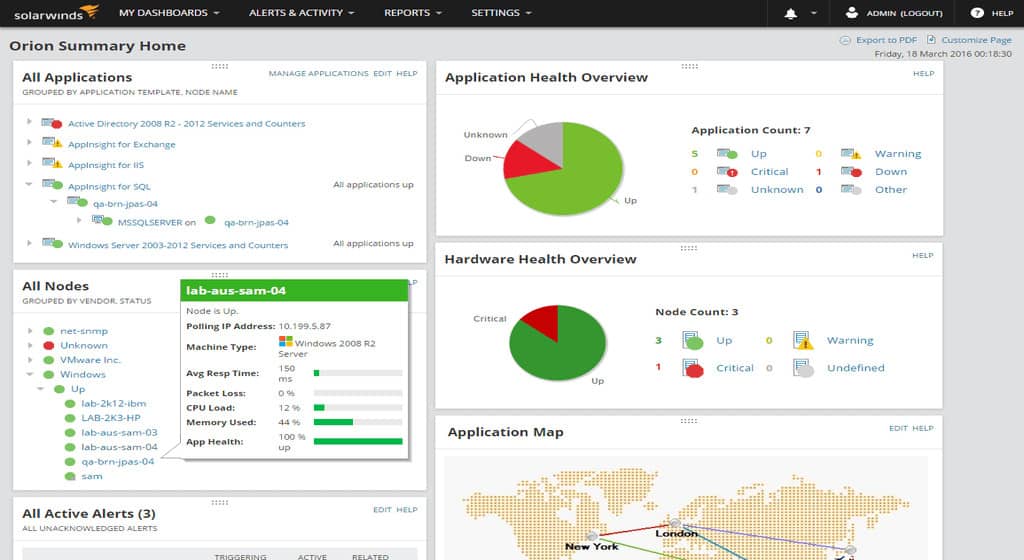
SolarWinds Server & Application Monitor from SolarWinds takes care of all of the supporting services that make an application work, which means the processes on the host. The tool tracks all of the services that deliver the application all the way through to the network connection. This system enables systems administrators to pinpoint the exact cause of problems with application delivery.
Key Features:
- On-premises software: Runs on Windows Server
- Monitors servers across the network: Monitors servers running Linux as well as Windows Server
- Cloud server monitoring: Records resource usage
- CPU activity: Monitors processes
- Tracks spawned processes: Can group the performance metrics of linked processes
Why do we recommend it?
SolarWinds Server & Application Monitor is able to monitor multiple servers simultaneously. By examining running processes, the tool can identify all of the applications of the business as they are in use. The tool also tracks the availability of other essential server resources, such as I/O, memory, and file space.
It doesn’t matter where the server is, the Server & Application Monitor can still watch it. The server could be a cloud resource or on a remote site; the monitor will make it seem as though it is on your local network.

Taking a different perspective, the monitor will also keep track of the overall activity of your server. It will show the resource usage of all of the applications running on it. This extends to metrics on CPU, memory, and storage space. This live data on server load is a useful tool for capacity planning and the system includes alerts for when the server is overloaded. The monitor records when the server hits its processing limits and is also able to show which applications are using the most resources.
Who is it recommended for?
This system is capable of tracking activity on large servers, which can have many processes competing for resources. The software for the system installs on Windows Server and there is no SaaS version. It is suitable for use by mid-sized and large corporations but too much for small businesses.
Pros:
- Alerts: For CPU shortage or long-running processes
- Correlates server and application activity: Links demands from software to the usage of CPU
- Live forecasting: Predicts the upcoming demand of newly launched applications, summing up the requirements of all running processes
- Monitors all server resources: Memory, disk space, and interfaces as well as CPU
- Checks on physical states: Temperature, fan speed, and power statistics
Cons:
- No cloud version: Only available for on-premises hosting
The SolarWinds Server & Application Monitor installs on Windows Server. You can get a 30-day free trial to check out the tool.
EDITOR'S CHOICE
SolarWinds Server & Application Monitor is our first choice for process monitoring because it includes server health checks as well as process monitoring. The monitor shows all of the activity on a server and also all of the supporting services for each application. This double perspective makes it very easy to spot which processes are in trouble.
Download: Get a 30-day free trial
Official Site: https://www.solarwinds.com/server-application-monitor
OS: Windows Server
2. Site24x7 (FREE TRIAL)

Site24x7 is a cloud-based infrastructure monitoring service. It is able to monitor any server anywhere, including cloud servers. As a SaaS offering, this tool includes all supporting services and hardware, so you don’t need to worry about monitoring the server processes of your server monitor.
Key Features:
- A cloud-based system: Delivered as a SaaS platform
- Full stack observability: Plans include server network, cloud, and application monitoring
- Tracks all major server resources: CPU, memory, disk space, and interfaces
- Scans all operating systems: Windows, Linux, and macOS
Why do we recommend it?
This cloud-based system provides packages of modules to monitor servers, networks, applications, and Web assets. The server monitoring part of this package gives you live metrics reports for many factors that include processor activity, I/O throughput, file access events, and memory usage. The screen for the server monitor is customizable.
The server monitoring features of Site24x7 are part of an infrastructure package. This can be used to monitor networks as well as servers. The system is able to monitor Windows and Linux servers and those servers can be located anywhere – they just need an agent installed on them.
The base package of Site24x7 Infrastructure covers up to 10 servers and larger businesses can add on more. The system monitors processes and their resource usage, including CPU, disk space, and memory. In fact, the system watches 60 different server performance metrics.

Who is it recommended for?
The Infrastructure package from Site24x7 gives you all of the monitoring tools that you would need for a business because it includes network, server, and application monitoring services. This is a good fit for a small business because Site24x7 sizes the subscription plan for smaller systems – large organizations pay extra for more capacity.
Pros:
- Correlates activity: Tracks software activity to processes and CPU availability
- Alerts: For excessive server resource usage that reaches towards full capacity
- Resource demand forecasting: Both near-term and long-term projections
- Physical server statuses: Temperature, fan speed, and power supply
Cons:
- No on-premises option: Those who want on-premises software should look at Site24x7’s stablemate, ManageEngine
As a SaaS system, Site24x7 is charged for by subscription so there are no upfront software or hardware purchase costs to getting started with the server monitor and there are no set-up fees. You can access the service immediately on a 30-day free trial.
3. ManageEngine Applications Manager (FREE TRIAL)

ManageEngine Applications Manager monitors server resources as well as application performance. The system watches over key metrics on the host including the CPU, memory, and disk space used by each running process. The dashboard will show each resource of the server and rank running applications by their resource usage.
Key Features:
- A software package: Runs on Windows Server or Linux
- Cloud options: Get it on AWS Marketplace or Azure Marketplace
- Server resource usage tracking: Includes CPU, memory, and disk space
Why do we recommend it?
ManageEngine Applications Manager watches over servers and applications. This is a very similar package to the SolarWinds Server & Application Monitor because it is able to identify all running applications and identify server resources that are running short. The tool provides an application dependency map for instant root cause analysis when problems arise.
The ManageEngine service requires an agent to be installed on the monitored agent if it is off-site. This enables the system to monitor cloud servers as well. In all cases, the Applications manager operates a system of alerts. When the performance of one application falls or if one resource gets overloaded, the IT technicians will get notified by email, SMS, or chat app message, so they know to return to the monitor to sort out the problem.

Who is it recommended for?
This tool is provided as a software package that runs on Windows Server, Linux, AWS, and Azure. The system is suitable for businesses of all sized. There is a free edition for small businesses that is limited to running five monitors. Larger businesses have a choice of a local plan and a multi-site system.
Pros:
- Ranks applications by CPU usage: Shows which processes are gobbling up capacity
- Alerts for CPU activity: Thresholds for approaching capacity exhaustion or rogue processes
- Correlation with applications: Connects application activity with server resource usage
Cons:
- Not available on Google Cloud Marketplace: It will monitor GCP from other hosts
ManageEngine Applications manager installs on Windows Server or Linux. You can get it on a 30-day free trial.
4. Paessler PRTG (FREE TRIAL)

Paessler PRTG monitors networks, servers, and applications. The system is a collection of monitors, which are called sensors. There are sensors in the package that specifically relate to CPU, memory, and disk usage on a host and detail the processes that use up the most resources.
Key Features:
- Customizable package: Tailor PRTG by deciding which sensors to activate
- Server monitoring: Windows Server, Linux, and cloud platforms
- Server resource tracking: Includes CPU, memory, disk, and interface activity
Why do we recommend it?
Paessler PRTG is a bundle of monitoring systems and you choose which of them to activate. There are a number of server monitoring tools in the package, which include a CPU activity tracker. This monitor provides live response and availability checks and will raise an alert if capacity runs short.
One sensor that is particularly important if you want to monitor processes on a Windows computer is the Windows Process Sensor. This monitor interacts with Window Management Instrumentation to present details on how all of the processes on the host are running. It details absolute working sets in bytes, private bytes, number of threads, handles, and instances, and CPU usage per process. It also totals up the memory, CPU, and disk usage of all active processes.
There are many other server monitoring sensors in PRTG and also network monitors that link activity to protocols, so it is easy to see which types of applications are creating the most network traffic.

Who is it recommended for?
PRTG is a good choice for businesses of all sizes because it offers an adjustable system with a price tag that is assessed by the number of sensors that you want to activate. If you only use 100 sensors, the system costs nothing and that’s a great deal for small businesses.
Pros:
- Discovery routine: Scans a network and sets up a hardware inventory, tracking devices, including endpoints
- Gathers WMI data: Tracksa activity on Windows computers
- Physical services monitoring: Temperature, fan speed, and power supply
Cons:
- Strong on Windows: Not so good at monitoring Linux
Paessler PRTG installs on Windows Server 2008 or later. It is also offered as a SaaS service in the cloud. You can get a 30-day free trial of the onsite software to check out the process monitoring system.
5. Nagios XI
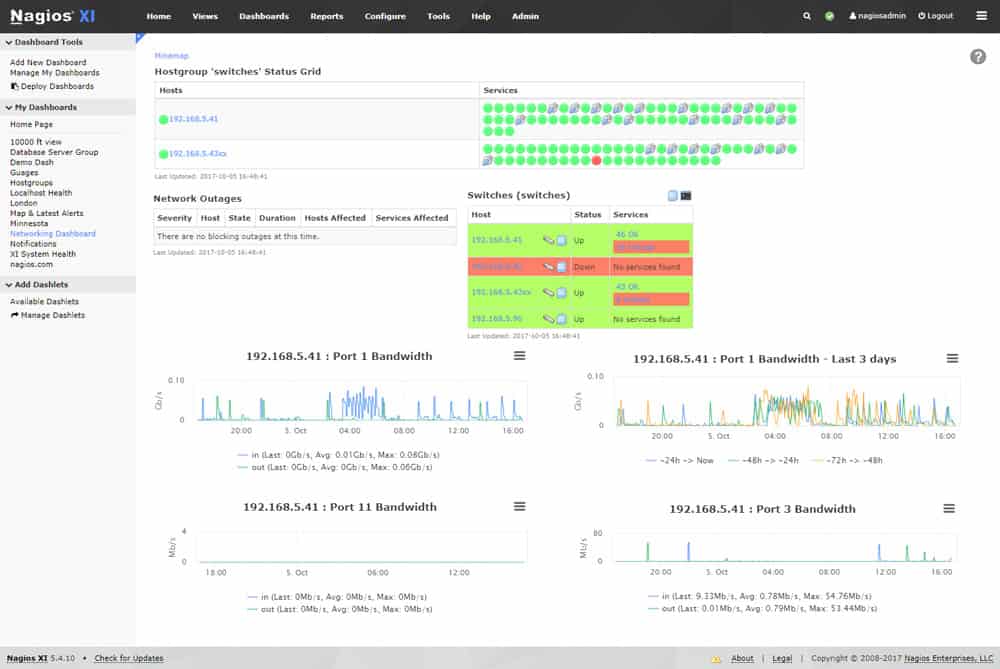
Nagios XI is an infrastructure monitoring system that covers networks, servers, and applications. This is a paid tool that is based on a free open-source project, called Nagios Core. Both Nagios XI and Nagios Core include comprehensive process monitoring.
Key Features:
- On-premises software: Runs on Linux
- Full stack observability: Monitors networks, servers, software, and cloud services
- Alerts for process anomalies: Spots when a process stops or crashes
Why do we recommend it?
Nagios XI is an on-premises package that watches over networks, servers, and applications. This is a very large system and it can be made even bigger by installing free plug-ins from a library that is available on the Nagios Exchange. There are a number of CPU activity monitoring services in the package.
The Nagios system is able to access both Windows Server and Linux to create its own process monitoring service. The screens for the process monitor are well laid out and easy to read. The details for each operating system version of the process monitor cover the same attributes shown by the native process monitors.
The monitor alerts staff if there is a process in trouble because it is hanging or has crashed. This alert mechanism means that technicians can assume that everything is working okay unless they are notified by Nagios.

Who is it recommended for?
The Nagios system is a little too large for small businesses. However, it is a good choice for mid-sized and large organizations. The system is implemented as a software package that runs on Linux. It can also be run over VMware or Hyper-V to use it on Windows.
Pros:
- Extensible package: Access free extensions on Nagios Exchange
- Server resource tracking: Monitors CPU, memory, disk, and interface capacity and usage
- Multi-tenant option: For managed service providers
Cons:
- Not available for Windows: The software can be accessed by businesses that don’t have Linux servers by running it over Hyper-V or VMware
The software for Nagios XI installs on RHEL, CentOS, Oracle Linux, Debian, and Ubuntu. Although the code is not available for Windows, it can be run on that operating system over a virtualization system, such as VMWare or Hyper-V. It can be run on Linux and can be run over a VM on top of Windows. You can get a 30-day free trial of Nagios XI.
6. Icinga 2
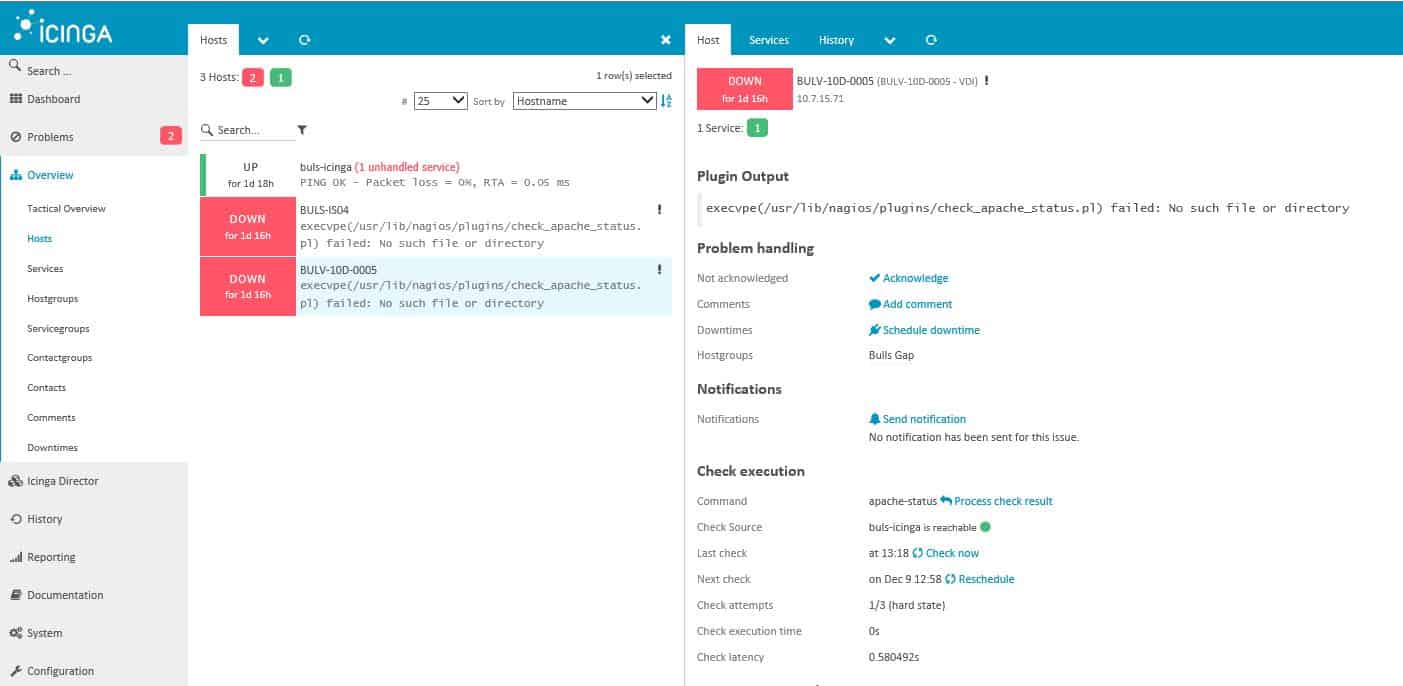
Icinga 2 has evolved from a fork of Nagios Core. Many people prefer the interface of Icinga 2 and as it is free, the service is very popular.
Key Features:
- Free software: Based on Nagios
- Extensible: Takes Nagios plug-ins
- Monitors multiple OSs: Will access endpoints running Windows, macOS, and Linux
Why do we recommend it?
Icinga 2 is a fork of Nagios. This resolves the problems with Nagios XI and its free counterpart, Nagios Core, which is that Nagios XI is expensive and the interface of Nagios Core is terrible. This system is able to monitor CPU activity and it is also compatible with Nagios Exchange plug-ins.
The Icinga 2 monitoring system includes similar process monitors to those of Nagios XI. The Nagios system includes thousands of free extensions, called plugins, and these work in Icinga 2 as well. The process monitor checks on resource utilization for each process, such as CPU, memory, and disk. It also totals all resource utilization of the server to see whether it is overloaded. The monitor will send out an alert to IT department staff if resource thresholds get breached.

Who is it recommended for?
Icinga 2 is a good choice for businesses of all sizes. Large businesses that insist on a professional support package for all of their software can subscribe to a paid support plan while using the free monitoring package. The software for Icinga runs on Windows, Linux, and AWS.
Pros:
- On-premises and cloud monitoring: Tracks the performance and resource usage of all servers
- Resource monitoring: Capacity and availability of CPU, memory, disk space, and interfaces
- Customizable alerts: For CPU shortages or process anomalies
Cons:
- Runs on Linux: Not available for Windows
The software for Icinga 2 can be installed on RHEL, CentOS, Debian, Ubuntu, Raspbian, openSUSE, and SLES. There is no version for Windows.
7. Zabbix
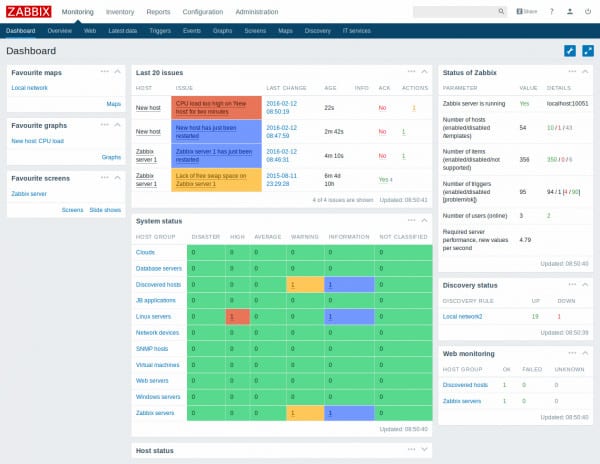
Zabbix is an attractive free, open-source system monitor that includes a section for server process monitoring. This tool lists processes and identifies their live usage of memory, disk, CPU, and network I/O. The service will also watch the performance of the server as a whole and alert when problems arise.
Key Features:
- A free monitoring package: Runs on Linux, Docker, or cloud platforms
- Tracks server resources: Capacity and usage of CPU, memory, disk, and interfaces
- Monitors physical server statuses: Temperature, fan speed, and power supply
Why do we recommend it?
Zabbix is another great free monitoring system that covers servers. It also monitors networks and applications. This package uses a series of templates that tailor and expand the out-of-the-box core package. Server monitors watch CPU activity, storage space availability, memory activity, and I/O traffic.
The software for Zabbix installs on Linux, IBM AIX, FreeBSD, NetBSD, OpenBSD, HP-UX, macOS, and Solaris. There is no version for Windows but the system can monitor Windows servers with the installation of an agent on those hosts.

Who is it recommended for?
Small businesses will enjoy Zabbix’s $0 price tag, while larger businesses will probably sign up for a paid support subscription. The service installs on Linux with agents that can access other operating systems. The tool can also run on cloud platforms and it is available as a physical or a virtual appliance.
Pros:
- Alerts for resource shortages: Set trigger thresholds below full capacity to buy time
- Scans for anomalous processes: Hanging, crashed, orphaned, and rogue processes
- Tracks spawned processes: Groups together the resource usage of related processes
Cons:
- Not available for Windows: The Docker implementation makes the software available to Windows server owners
8. Datadog Infrastructure
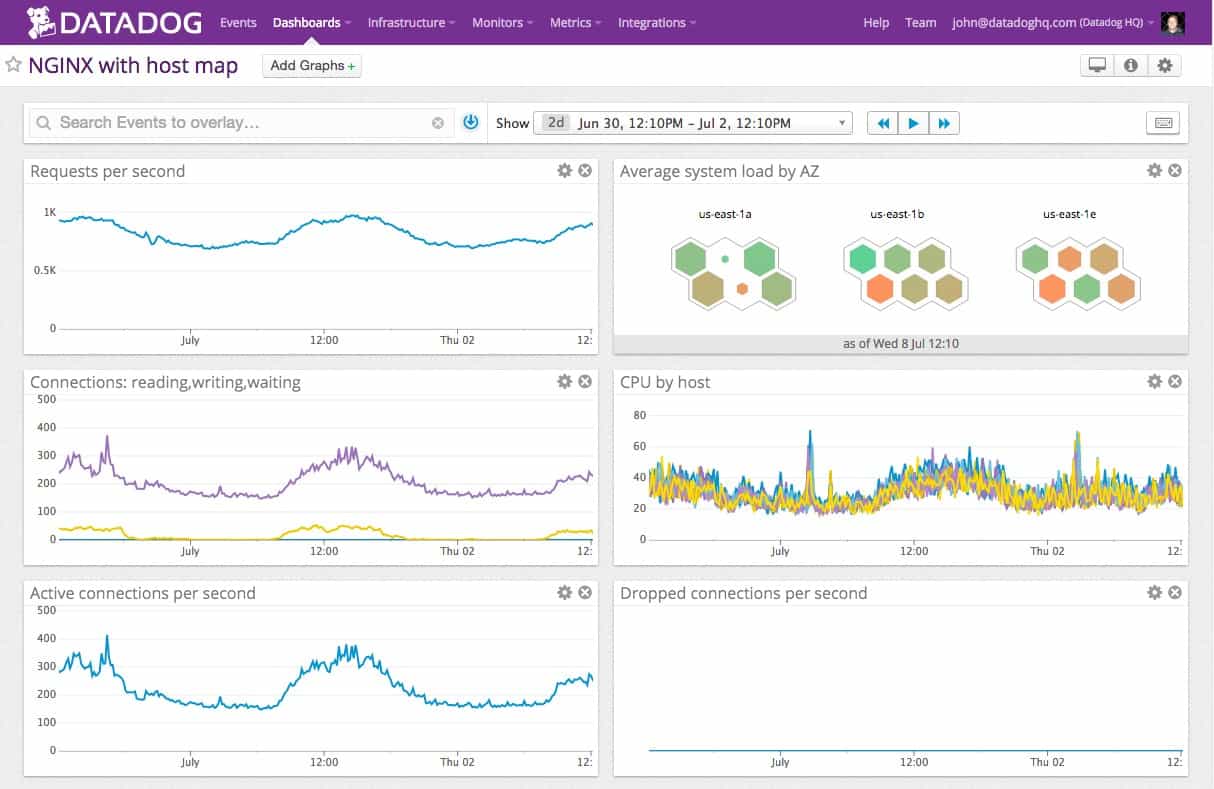
Datadog infrastructure is a network and server monitoring service that is based in the cloud. The server monitoring element of this SaaS package includes process monitoring with attention to the use of resources of the host.
Key Features:
- Cloud-based SaaS package: Part of the Datadog Infrastructure Monitoring module
- Live capacity tracking: Shows graphics in the dashboard representing resource capacity and usage
- Monitors server CPU: Also memory, disk space, and interfaces
Why do we recommend it?
Datadog Infrastructure provides monitoring for all IT systems between user-facing software and the network. That means middleware and servers. This tool can correlate the activity and resource demands of systems, such as databases and Web servers with the availability of physical resources, such as CPU, memory, and disk space.
The infrastructure monitor aims to expose the underlying causes of performance problems. It identifies the resources used by each application. So, if a database is running slowly, it is possible to trace its processes and see whether any of them are hanging in contention for resources or have just fallen over.

Who is it recommended for?
Datadog Infrastructure is resident in the cloud and it includes storage space for the statistics that the monitor gathers. The console for the service is resident in the cloud and the service reaches out to your services and cloud accounts through agents. Its per-host pricing makes it suitable for businesses of all sizes.
Pros:
- On-premises and cloud: Monitors cloud services as well as on-premises servers
- Alerts for CPU irregularities: Spots excessive CPU usage, rogue, abandoned, and crashed processes
- Forecasts capacity requirements: Both for immediate needs and long-term planning
Cons:
- No on-premises version: Cloud only
The monitoring system is able to watch over any server anywhere. The server will need to have an agent installed on it. Datadog Infrastructure is charged for by subscription and it is available for a 14-day free trial.
9. Sysinternals Process Explorer

Sysinternals is a group of system monitoring and management tools available for Windows computers. All of these utilities are free to use. Sysinternals is owned by Microsoft and all of the programs can be downloaded from the Microsoft site. Once a tool has been installed, it can be launched from Windows Explorer.
Key Features:
- Free tool: Managed by Microsoft
- Live process activity: An expansion of the Windows Task Manager
- Details popups: Get deeper stats on each process
Why do we recommend it?
Sysinternals Process Explorer is a free tool that provides CPU activity feedback for the computer on which it is installed. The system was developed by a private individual but is it is now owned by Microsoft. The tool shows a list view of all processes on the CPU and also offers graphs.
The Process Explorer is the first of two process monitoring and management tools in the Sysinternals range. The interface for the utility has two panels. The top panel lists all active processes and is subdivided into a tree hierarchy menu and a list of process attributes. The lower panel shows details of a selected process, including its launching program and any files or resources that it is using.
A second screen for this utility shows a performance graph for the host as a whole detailing CPU, memory, and I/O activity over time.

Who is it recommended for?
This tool is one of a suite of utilities that can be downloaded from Microsoft for free. It doesn’t offer much more functionality than the standard Task Manager that is built into the Windows operating system. There isn’t a version of this package for macOS, Linux, or Unix.
Pros:
- Color-coded statuses: Quickly see which resources are overloaded
- Track child processes: See how processes are linked
- Basic analysis features: Sort, search, and filter process records
Cons:
- Only available for Windows: Doesn’t run on Linux or macOS
Choosing a process monitoring tool
Although the native process monitors are free and don’t need to be installed, they don’t offer much insight and they can be difficult to read. There are a number of very good process monitors available on the market. These have graphical interfaces that interpret process statistics meaningfully and they are also able to examine processes running on devices across the network or even on a different site.
Businesses that run many servers will particularly benefit from a good quality process monitoring tool. These services are able to aggregate the performance of all devices as an overview and they usually include an alert mechanism that will draw the attention of technicians when one process seems to be overloading the system.
Process monitoring FAQs
Why is process monitoring important?
Process monitoring enables technicians to see when server resources are running short and then identify the process or processes that are using the most resources. CPU capacity usage, memorat availability, and disk interactions are the three most important factors to watch.
How do you monitor process performance?
Effective process performance monitoring can only be achieved through a GUI tool – the task is too complex to be performed by a command line tool. You need to be able to see the resource usage of each individual process and also the cumulative demand of all active processes on server resources. Resource shortage is a major cause of application performance impairment.
What are the three main purpose of monitoring?
It is important to monitor processes for three reasons:
- To identify resource utilization and plan server capacity.
- To spot resource locks and hanging processes so you can make a manual intervention to remove obstacles to smooth operations.
- To work out which services or applications use the most resources in order to assess the cost and viability of software purchases.
