PRTG and Datadog are two widely used monitoring platforms that help organisations maintain the performance, availability, and security of their networks, applications, and IT infrastructure. While both offer comprehensive monitoring capabilities, they are designed with different environments and priorities in mind, making it important to assess which aligns best with specific operational needs.
PRTG (Paessler Router Traffic Grapher) is an all-in-one monitoring solution focused on network visibility. It uses a broad range of sensors to track metrics such as bandwidth usage, device health, and server performance, giving organisations detailed insight into their infrastructure. Known for its flexibility, customisable alerts, and straightforward setup, PRTG is well-suited to businesses that want a centralised, on-premise or hybrid monitoring approach.
Datadog, by contrast, is a cloud-native platform built for monitoring modern, distributed environments. It integrates seamlessly with services such as AWS, Azure, and Google Cloud, providing real-time analytics, machine learning-driven anomaly detection, and end-to-end visibility across applications and infrastructure. This makes it particularly effective for organisations operating in cloud-first or highly dynamic environments.
This article compares the features, pricing, usability, and overall capabilities of PRTG and Datadog to help you determine which solution is the better fit for your monitoring requirements.
Overview of PRTG Network Monitor
PRTG Network Monitor is a mature and well-known network monitoring tool from Paessler GmbH, a company based in Germany. It comes in different editions and variants such as:
- PRTG Enterprise Monitor—targeted at large networks with thousands of devices and systems across multiple locations.
- PRTG Hosted Monitor—a cloud-based option that allows you to monitor from the cloud
- PRTG Desktop—allows you to manage multiple PRTG servers.
- PRTG Mobile App—allows you to check your network, devices, and sensors while on the go.
PRTG Network Monitor is agentless—which means you do not need to install any agent on the target devices and application; instead, it uses network protocols such as SNMP, WMI, NetFlow, or SSH to carry out its monitoring functions. This way, not only is the burden lower, and the monitoring is done quickly and easily.
Other key features and capabilities PRTG Network Monitor include:
- In-depth reporting—runs or schedules regular reports and gets the statistics of your specific monitoring data.
- Maps and dashboards—visualize your network using real-time maps with live status information.
- Flexible alerting—supports SMS, email, push notification, and audio alarm.
- Distributed monitoring—monitors several networks in different locations.
- Cluster failover solution—allows failover tolerant monitoring.
- Multiple user interfaces—desktop, mobile, and web.
To install PRTG, you only need a Windows computer with sufficient computing power. In addition, a cloud-based option known as PRTG Hosted Monitor is also available. The PRTG licensing model is based on sensors (parameters that can be monitored on a device such as CPU load, port status, or network traffic) and includes one year of free support and maintenance. In addition, a free 30-day-trial with full access to all the features is available for download. PRTG is also known as freeware for up to 100 sensors. If you want to monitor more than 100 sensors, you will need to upgrade to a commercial version. If you don’t upgrade, the trial version automatically reverts to the free version after 30 days, and you can continue using the free version without any time limit.
Overview of Datadog
Datadog is an agent-based cloud infrastructure monitoring service for cloud applications, servers, databases, tools, and services. It’s headquartered in New York and has Boston, Dublin, Paris, Singapore, Sydney, and Tokyo. Datadog was named a Leader in the 2021 Gartner Magic Quadrant for Application Performance Monitoring. It provides developers and IT operations teams real-time visibility into all technology infrastructure through a single visual interface. Datadog uses its auto-discovery service to explore and identify devices in your network. The outcome of the auto-discovery service is then used to create a device inventory, which forms an index for the complete monitoring service.
Once all devices and links have been identified, you can overview all network activity from the Datadog dashboard. The service also draws up a network topology map that can be used to get quick insights into each node. Any changes to the network can be automatically spotted. This helps to adjust the network inventory and topology map without any human intervention. Traffic flow analysis features in the Datadog tool enable you to examine each device and link to discover total capacity and utilization. The analysis features let you see which applications or endpoints generate the most traffic on your network.
Datadog’s key features include:
- Network monitoring—allows companies to visualize traffic flow in cloud-native environments and analyze performance using meaningful, easy-to-understand tags.
- Application performance management—monitors, troubleshoots, and optimizes application performance.
- Log management—allows users to search, filter quickly, and analyze logs for troubleshooting and data analysis.
- Synthetics—synthetic tests proactively monitor end-to-end user experience with an intuitive web recorder.
- Alerts—companies can create custom alerts for any metric or performance problem. Notifications are available via email, PagerDuty, Slack, etc.
- Integrations—the software integrates with multiple products and development stacks to aggregate metrics and events.
- Dashboards—high-resolution interactive dashboards help companies monitor and graph real-time metrics and events.
- Collaboration—collaboration tools provide visibility across teams by letting users annotate changes, record problems, and communication, and discuss issues in context with production data.
- Application programming interface (API)—API access helps companies observe apps and infrastructure by capturing events and metrics using client libraries.
A free 14-day-trial with full access to all the features is available for download. After that, the software is generally sold through monthly subscription plans based on hosts, events, or logs.
Pros & Cons
PRTG
Pros:
- Uses a combination of packet sniffing, WMI, and SNMP to report network performance data
- Fully customizable dashboard is great for both lone administrators as well as NOC teams
- Drag and drop editor makes it easy to build custom views and reports
- Supports a wide range of alert mediums such as SMS, email, and third-party integrations into platforms like Slack
- Each sensor is specifically designed to monitor each application, for example, there are prebuilt sensors whose specific purpose is to capture and monitor VoIP activity
- Supports a freeware version
Cons:
- Is a very comprehensive platform with many features and moving parts that require time to learn
Datadog
Pros:
- Offers numerous real user monitors via templates and widgets
- Can monitor both internally and externally giving network admins a holistic view of network performance and accessibility
- Changes made to the network are reflected in near real-time
- Allows businesses to scale their monitoring efforts reliably through flexible pricing options
Cons:
- Would like to see a longer trial period for testing
PRTG Network Monitor Vs. Datadog: How They Compare
Systems Requirements and Installation
There’s no cloud service deployment model for PRTG. Paessler recommends that PRTG be installed on physical hardware running inside the production environment being monitored for performance reasons. However, Paessler offers PRTG Hosted Monitor—a cloud-based option that allows you to watch from the cloud. The system requirements for PRTG include a Microsoft Windows Server machine with at least 2 CPU cores, 3GB of RAM, and at least 250GB of disk space. If you intend to manage enterprise-sized networks with multiple locations, this can become a little more complicated. In that case, Paessler recommends installing physical PRTG Remote Probes that extend your monitoring to remote areas. But this also requires servers with at least one dual-core CPU and a minimum of 2GB of RAM.
Since Datadog is a SaaS-based application, there are no on-premise system requirements and no installation hassles. However, you’ll be required to install local agents specific to the device or service you wish to monitor for the most part. An agent-based mode means no auto-discovery feature, so you have to deploy an agent for all your devices individually. Datadog supports integration with VMware vSphere, but the setup process is a bit complicated. That said, Datagod provides enough documentation and setup instructions to guide you through the installation and configuration process.
Dashboards and Visualizations
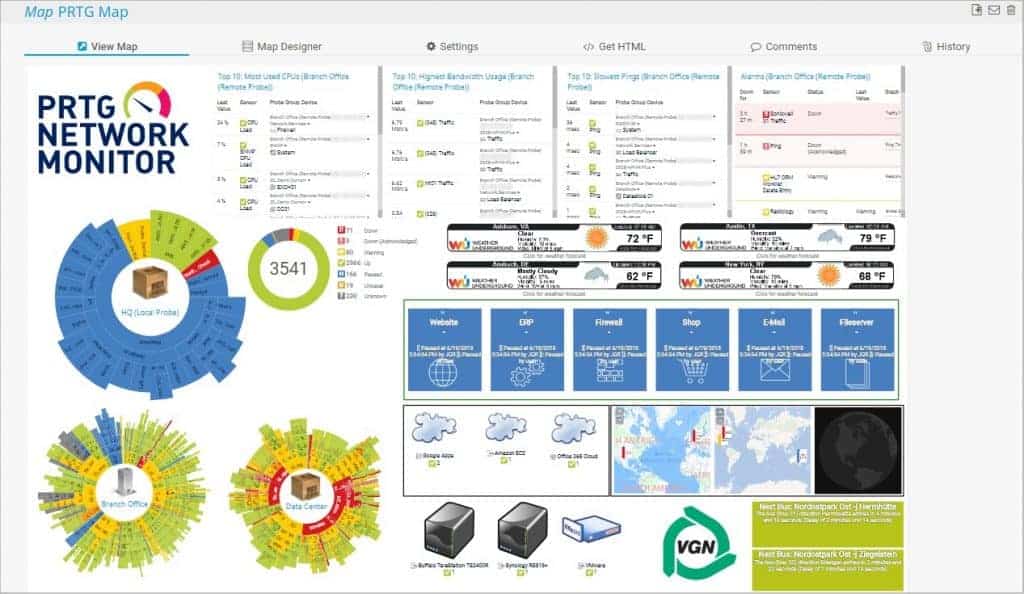
PRTG enables you to visualize your entire IT infrastructure in one customizable dashboard using a modern browser-based interface. PRTG uses the concept of maps in its dashboards. Maps in PRTG show not only devices and connections but also deliver information on their status. But, while they can be visually impressive, there’s a relatively steep learning curve involved before you can build one. One of the critical aspects of PRTG dashboards is the sunburst view. It’s a great way of showing the status of all devices of a specific type. The dashboard also offers several other IT-related metrics, such as the status of the virtual environment, corporate website, cloud services, and bandwidth usage on the WAN over some time.
Datadog performs relatively better from a visual perspective with its clean and modern dashboard design. In addition, Datadog allows you to customize your dashboards with a vast library of visualization tools and drag-and-drop widgets. But it requires a lot of setup work to get things working. Once set up, there are two primary ways of visualizing your data:
- Screenboards: These are grid-based dashboards with free-form layouts that include images, tables, host maps, graphs, and logs. They are commonly used as status boards or storytelling views that update in real-time or represent fixed points in the past.
- Timeboards: This represents a single point in time—fixed or real-time—across the entire dashboard. They are commonly used for troubleshooting, correlation, and general data exploration. In addition, you also get a time series that can plot any metric being captured from your hosts, such as CPU usage, uptime, or memory usage.
Alerts and Notifications
PRTG offers many ways to alert you about your monitoring data, such as when a sensor status has changed, when values exceed thresholds, limits, and lookups. Notifications are set up on the sensors. PRTG triggers notifications based on a sensor’s status or value thresholds of a sensor that are breached. When a sensor’s values change, notification triggers. PRTG sends messages to a user’s notification contacts for each user account. Email is the default notification method, but there are also options for SMS, Slack, Microsoft Teams, event logs, syslog messages, and SNMP traps, as long as you’re willing to take the extra steps to set them up. Push notifications are also available on smartphones using an app for iOS or Android.
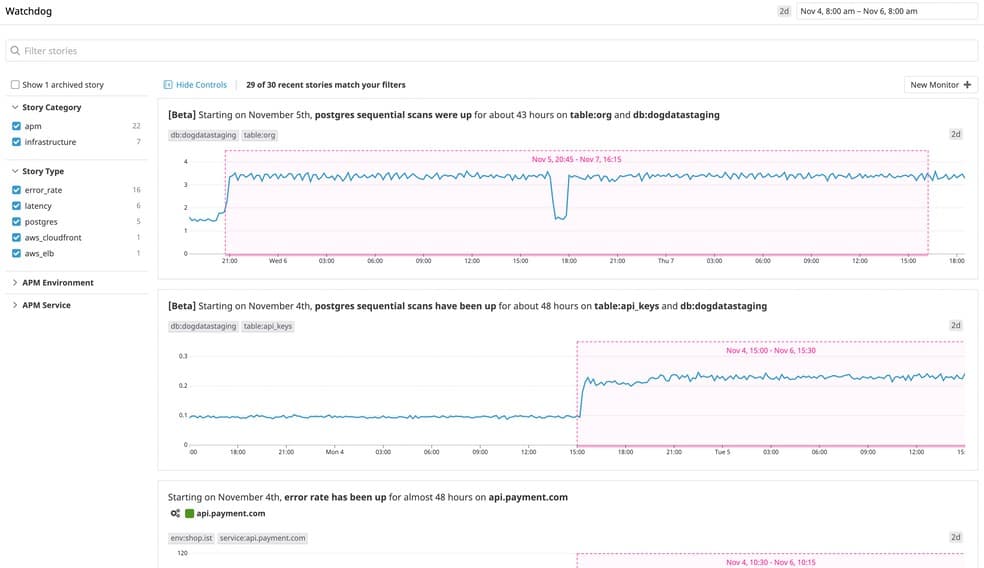
On the other hand, Datadog’s approach to alerts and notifications is based on machine learning (ML), which it calls Watchdog. Watchdog uses ML techniques to identify problems in your infrastructure, applications efficiently, and services and flag anomalies. Alerts in Datadog are called Monitors. Users can receive signals using Pagerduty, Slack, and email. These can be based on nearly any metric that Datadog can capture. As a result, every alert is specific, actionable, and contextual—even in large-scale and highly ephemeral environments—which helps minimize downtime and prevents alert fatigue.
Reporting and APIs
PRTG’s reporting module allows you to define custom reports or take advantage of the pre-configured ones. There are several ways to create customized data reporting in PRTG. For instance, you can use the Reports function included in PRTG to create exhaustive reports for all monitoring data. You can use the Historic Data function for a single sensor to generate and view historical data reports. All raw monitoring data can be exported to .xml or .csv files, enabling you to develop your reports with any third-party software. You can also export data using the API. The PRTG API allows you to access monitoring data and manipulate objects using HTTP requests, run your written sensors and notifications, and implement mini probes. Although the PRTG approach to report generation appears tedious, it’ll meet your organization’s compliance requirements.
Instead of generating the usually fixed reports, the Datadog approach to reporting aims to make metrics easily searchable, and it does excellently. Although some network managers prefer the excellent old nicely generated fixed PDF report, not everybody needs it. Therefore, Datadog also comes equipped with an easy-to-use API that can significantly extend the range of what Datadog can track. The Datadog API is an HTTP REST API that can access the Datadog platform programmatically and returns JSON from all requests.
Licensing and Price Plans
PRTG uses a perpetual licensing model (indefinitely valid), while maintenance plans need to be renewed. A maintenance plan gives you continued access to product updates and technical support. Each license supports an unlimited number of users and includes all features. The licensing scheme is based on the number of the stored devices—known as sensors (such as CPU load, port status, or network traffic), not the number of devices themselves. Most devices require between five and ten sensors to be thoroughly monitored. This means that the more the number of devices on your network, the more the number of sensors to measure. For mid-sized to large networks, things can get expensive quickly depending on the number of sensors and how much information you want to see.
Datadog pricing model is based on per server, per month, and it’s free for up to 5 hosts (with 1-day data retention). But some customers complain that it becomes costly at scale. As a result, Datadog is available in several different pricing tiers:
- The Network Performance tier–suitable for monitoring networks and systems for most small to midsize businesses.
- The Infrastructure tier– ideal for organizations that want to use the software as a centralized monitoring service for systems and services.
- The APM tier–designed for larger organizations looking to fix service and device-layer problems.
- Serverless tier–aimed at those looking to monitor network and application issues.
- Log Management tier–meant for companies with large amounts of log data to parse for context and retention.
- There are also different tiers for security, synthetic, and accurate user monitoring, each with pricing appropriate to the core task.
All Datadog prices are billed annually, making it one of the most price-customizable management apps.
| Features | PRTG Network Monitor | Datadog |
|---|---|---|
| Target market | PRTG is ideal for small, medium, and extensive network perfect and network admins that want granular monitoring. | Datadog is the ideal solution for developers, freelancers, IT operations teams, security engineers, and business users from SMB to large organizations in the cloud age. |
| Supported platform | Windows OS | Mac OS X Windows Linux Online |
| Deployment model | On-premise | SaaS-based |
| APIs calls | HTTP GET requests | HTTP REST API |
| Support methods | Online Knowledge base Video tutorials | Phone Online Knowledge base Video tutorials |
| Licensing and pricing model | Free trial available No credit card required Free account Perpetual licensing with renewable maintenance | Free trial available No credit card required Free account Subscription-based |
Table 1.0 | Comparison of PRTG and Datadog key features
Concluding Remarks
PRTG Network Monitor is a powerful solution that can meet the needs of any organization, from SMB to large enterprises. Most users find it easy to use and administer. While the feature set can be overwhelming, network managers will find it hard to run out of options. In addition, the sensor-based licensing model makes it much easier to keep costs under control. But ironically, sensors can also be used up quickly, which can drive up prices if you don’t own a close watch on them.
Datadog’s SaaS-based model makes it ideal for organizations that don’t want to burden themselves with any resource-intensive on-premise monitoring solution. Service-oriented companies, SMBs, or smaller networks that don’t have dedicated IT personnel to keep tabs on the infrastructure at a granular level will find this feature-rich tool suitable. More extensive networks with multiple remote locations may find Datadog’s agent-based model inconvenient since agents will need to be individually installed. But if you can successfully get past the agent installation and configuration process, Datadog is an excellent network monitoring and infrastructure management tool.
