Response time monitoring is essential for understanding how quickly servers and applications react to user requests. It measures the time between a request being made and a response being returned, helping organisations assess performance and maintain a smooth user experience.
Here is our list of the best response time monitoring tools:
- AdRem NetCrunch EDITOR’S CHOICE This application and service monitoring tool offers response monitoring to ensure that APIs and web services meet the expected standards. It supports custom HTTP requests as well. Download a 30-day free trial.
- Site24x7 Application Performance Monitoring (FREE TRIAL) This bundle of monitoring services from a cloud platform includes website monitoring services, such as response time tracking and real user monitoring. Start a 30-day free trial.
- ManageEngine Applications Manager (FREE TRIAL) A monitor for both applications and server performance that can also identify network response time problems. It installs on Windows Server and Linux. Download a 30-day free trial.
- Sematext Synthetics A cloud-based package of active monitoring tools that provides a range of metrics, such as load times, and can even break down the response times of each component of a Web page’s delivery.
- Pingdom A website availability and response time monitoring service that checks delivery performance to more than 100 locations around the globe.
- SolarWinds Server & Application Monitor A comprehensive applications monitor that includes server performance tracking.
- Google PageSpeed Insights A free on-demand response time testing service that includes performance improvement advice.
Slow response times can affect multiple parts of an environment, from application code to server resources. If performance drops, users may experience delays, which can lead to frustration, reduced productivity, or even lost revenue—especially in customer-facing systems. Continuous monitoring helps teams detect and resolve these issues before they escalate.
Network performance also plays a major role. Problems such as high latency, limited bandwidth, or misconfigured devices can slow down communication between systems, increasing response times even when applications themselves are functioning correctly.
To manage this, organisations use monitoring tools that provide real-time insights into both infrastructure and application performance. These tools help identify trends, detect anomalies, and support faster troubleshooting.
Overall, tracking response times helps ensure systems remain responsive, reliable, and capable of delivering a consistent user experience.
What does response time mean?
“Response time” defines the length of time an application takes to show results to a user. This is closely related to “load time,” but is not exactly the same. While load time includes factors such as the time it takes software to start up on the user’s computer and web browser issues, response time is concerned with the speed of changes in the content shown by applications.
A “response” is an answer to a user request or action. This action relies on the performance of the application running on a server through to the availability of resources on the user’s device and all network services between those two points.
While response time is important when operating business software for use by in-house staff, the issue becomes business-critical in eCommerce applications. Slow response time in web pages can cause a visitor to a site to give up and go to a rival’s website. That immediately loses the business a potential customer, but it also has a knock-on effect on the competitive performance of the website. When users leave a site, it increases the “bounce rate” of the page that they were on and that is a factor that search engines use when ranking entries in their results pages.
Causes of slow response times
In some cases, the main cause of slow response times lies with the user’s device. In website scenarios, there is little the business can do to improve the performance of that device. However, simplifying the content of the site, deploying transmission optimizers, and using a content delivery network will squeeze as much extra speed out of the delivery system to improve page response times as far as possible.
Systems managers need to focus on the elements of response times that they can control and those monitoring in-house delivery of applications have control over more factors than those responsible for managing websites.
Important Response Time Metrics
There is no industry standard for what is an acceptable response time for applications. It just comes down to what the user community will bear and that factor varies from application to application. Response time is a bigger issue in interactive applications such as VoIP or video streaming than it is in most applications. Response time isn’t an important factor in email systems because people rarely expect an email to arrive instantly.
A key measurement when monitoring network response time performance is called “time to first byte” (TTFB). This identifies the delivery speed of a packet judged as the gap between the first byte of data leaving a server and its arrival time at the client device. This isolates the network element involved in response time and excludes factors such as server or endpoint performance issues.
Application response time takes other factors into account and extends beyond network performance to examine the speed of contributing applications, such as a database or a video player.
The error rate and lost packet count are important factors in response time because they indicate an effort that has to be repeated in order to deliver the response to the user. VoIP and video streaming have other important factors that need to be measured. The main metric in this category is “jitter,” which measures the variations in delivery times. Jitter is an important factor in real-time applications because an irregular delivery rate can cause sound or video to break up or pause periodically.
In short, response time goals vary according to the application being examined.
Tips on improving application response times
There are a number of very simple strategies that you should employ to improve application response times.
- Monitor server resources
- Gain stack visibility for root cause analysis
- Set resource utilization threshold levels to buy time
- Implement network traffic monitoring per application
- Vary response time expectations per application
- Prioritize real-time application traffic
- Optimize supporting applications, such as databases and web servers
- Upgrade hardware
- Deploy caching systems for web content
There are three stages in the workflow to improve application response times
- Acquire performance visibility – monitor all applications individually all the way down through the stack
- Focus on poorly performing applications – not all applications will need your attention
- Improve resource availability to critical applications – Allocate more resources to real-time applications and expand infrastructure where necessary
These three points seem obvious but it is surprising how many systems managers don’t follow them.
A key requirement for solving any IT issue is to avoid reactive, short-term solutions, which are commonly labeled “fire fighting.” Although there is always pressure to introduce quick fixes just to get to the end of the day, long-term analysis and planning offer more durable solutions.
The starting point for planning lies with a baseline of current performance. So, your first requirement is to get an application performance monitoring tool.
Application performance monitoring
No matter what business sector you operate in and no matter what your infrastructure is, you need to start off your response time improvement project with a server and application monitoring tool. Make sure the software you buy is capable of managing your infrastructure model: on-site, multi-site, cloud, or hybrid.
There are tools that need to be installed as software on your own server and others that operate as a service from cloud servers. If you only run applications to users in the same building as your servers, then it doesn’t matter whether you choose software to install or a cloud service. However, if you are particularly concerned with website response times, an external service would be better.
The best response time monitoring tools
A good server and application monitor will be able to help you through the three phases of response time improvement. These tools will be able to monitor server resources and application metrics. They should also provide full-stack monitoring enabling you to identify the root cause of the problem. Many monitoring system providers divide the functions of a server and network monitoring between two or more products. However, a good server and application monitor should be able to identify whether network performance is the cause of poor response times even if it can’t provide network monitoring functions.
Finally, look for a monitoring tool that supports system analysis and capacity planning. If you are operating a website, a tool that includes synthetic modeling so that you can test your new infrastructure is also a great help.
Our methodology for selecting response time monitoring software
We reviewed the market for response time monitoring systems and analyzed tools based on the following criteria:
- Application dependency mapping
- Root cause analysis
- Tests launched from multiple locations
- Performance alerts
- Performance grading, such as the traffic light classification
- A free trial or a demo package for a risk-free assessment opportunity
- Value for money from a tool that is able to monitor websites as well as on-site applications
With these selection criteria in mind, we identified candidate response time monitor tools that are worth trialing.
1. AdRem NetCrunch (FREE TRIAL)

AdRem NetCrunch is an application and service monitoring platform that improves the efficiency and security of your digital operations. It is particularly well-known for the monitoring of REST HTTP(s) sensors, through which it provides information about response times, file content, request analysis, remote file metrics, and more.
Key Features:
- Customization: Highly customizable, as it supports custom HTTP requests, cookies, and headers.
- File Monitoring: Uses authentication and other checks to ensure that the remote file content meets your organizational policies.
- Request Analysis: Continuously monitors GET, HEAD, and POST requests to identify misconfigurations and content mismatches.
- Response Monitoring: Monitors the response code to ensure that APIs and web services meet the required standards.
- Simulation: Simulates scripts in real-world conditions to monitor web pages and complex applications.
Why do we recommend it?
NetCrunch comes with a broad set of sensors that make it easy to monitor the performance and security of your digital operations. It can monitor web pages, applications, cloud services, databases, SSL certificates, SQL databases, and more, to ensure smooth operations. Moreover, you can use this tool to simulate a web browser and to better understand how your scripts will run in real time.
At the core of this simulation and monitoring is a bunch of sensors that can continuously monitor your HTTP requests, response times, web services performance, and remote file content. You can even customize these sensors to meet your specific monitoring needs.
Who is it recommended for?
It is a good choice for IT administrators and operations teams responsible for managing web applications, cloud platforms, virtual servers, web services, APIs, and websites. It can also work well for teams that manage Windows-based environments and those running cloud services like M365 and Azure.
Pros:
- Broad Coverage: Monitors web services, cloud services, virtualization environments, and more
- Customizable: Highly customizable to meet your specific needs
- Unified Visibility: Combines data from multiple sources to offer better insights about your environment
- Agentless: No complex installations are required
Cons:
- Learning Curve: Some advanced customization may involve a learning curve
NetCrunch’s system monitoring starts at $3,600 in the Professional edition and $5,950 in the Enterprise edition, respectively. Both prices are per year. Download a 30-day free trial.
EDITOR'S CHOICE
NetCrunch is our first choice for the best response time monitoring tool because of its wide array of sensors that focus on monitoring HTTP requests. These sensors monitor multiple metrics, like response times, URL queries, file metrics, header requests, and more. What makes this tool stand out for us is its customization. You can tweak these sensors to match the needs in your environment, making it a good choice for monitoring web pages and complex web applications. You can also extend it to include monitoring of cloud services, Windows applications, SQL databases, and more.
Download: 30-day FREE Trial
Official Site: https://www.adremsoft.com/netcrunch/download/
OS: Windows Server - Self-hosted server
2. Site24x7 (FREE TRIAL)
The Site24x7 cloud platform provides system monitoring and management tools and offers them packed into plans. The Site24x7 Application Performance Monitoring edition is one of those plans and it gives you access to website monitoring services, such as the platform’s Response Time Monitoring facility in its Synthetic Monitoring category of services. The Website Monitoring and Infrastructure Monitoring plans also include the synthetic monitoring services of the Site24x7 platform.
Key Features:
- Uptime monitoring
- Page load speeds
- Walk-through replays
- 120 test launch locations
Why do we recommend it?
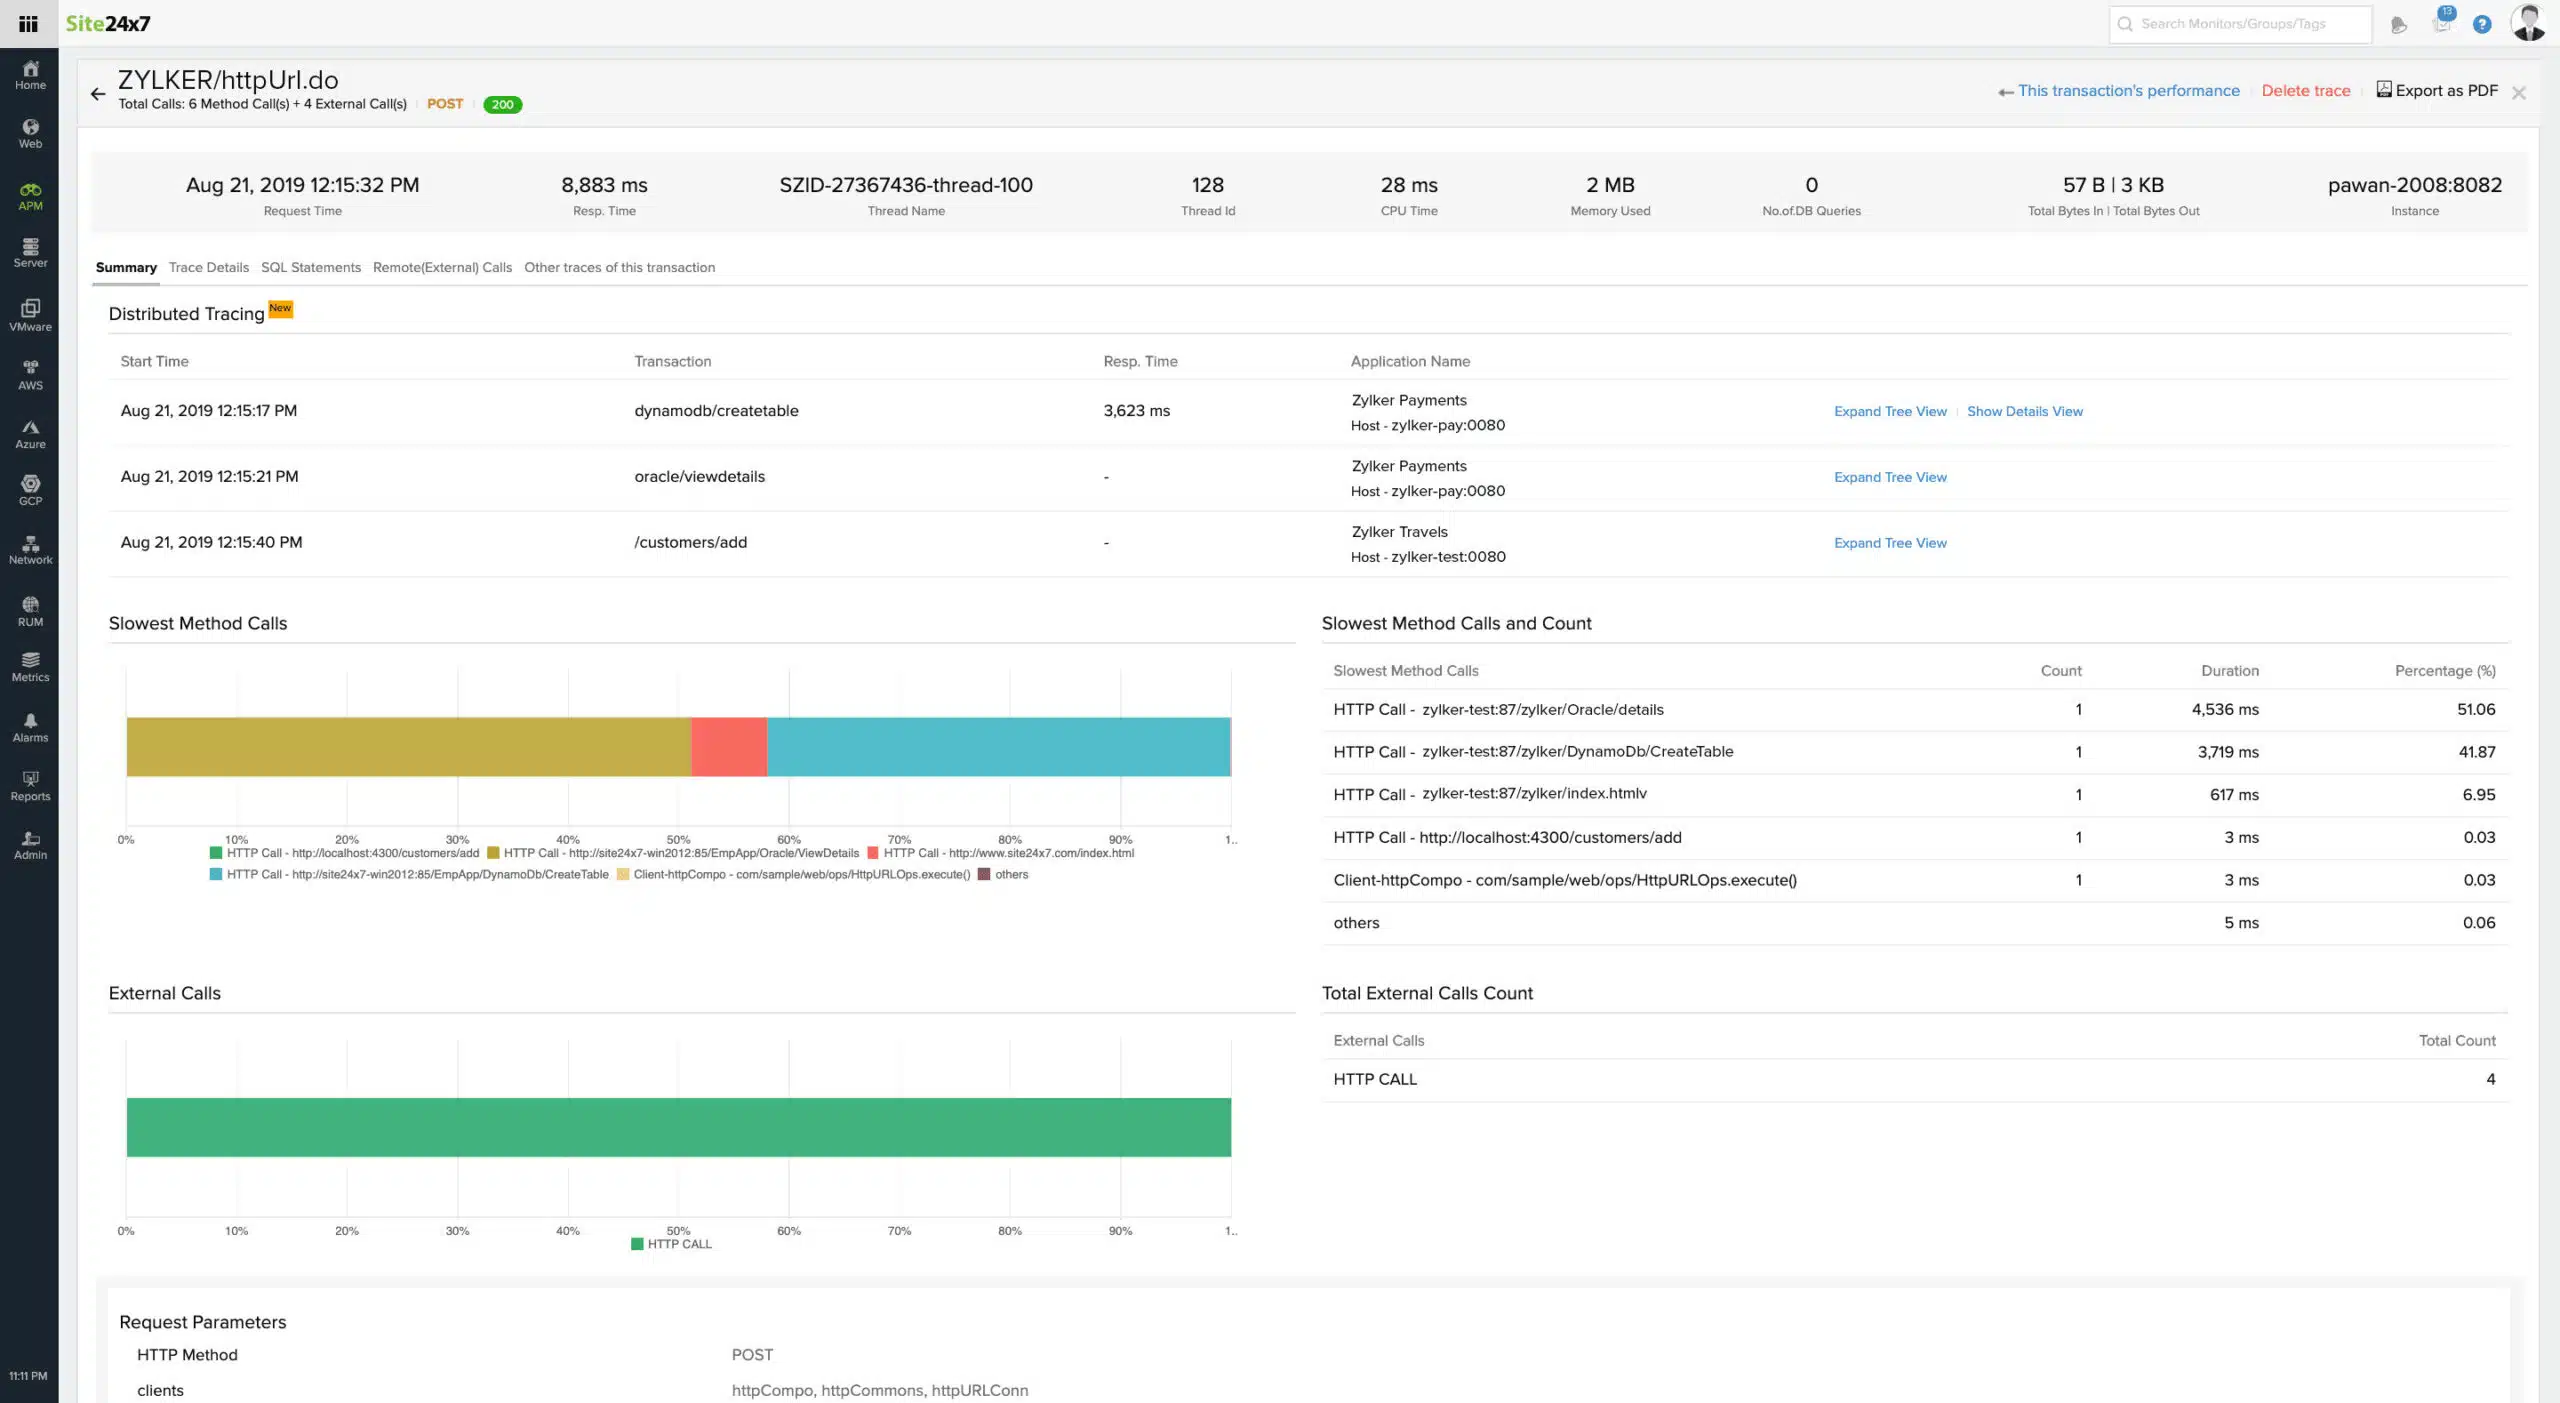
The Website Monitoring features of the Site24x7 Application Performance Monitoring package can be supplemented with other utilities in the plan to investigate the cause of any response time failures recorded by the Synthetic Monitoring tool on the platform. The APM links together the tracking of applications, services, server resources, and networks to identify the root cause of any performance problems.
The basic response time monitoring service available in the Site24x7 package is an HTTP-based service that simply records whether or not a Web server responds to a request for a page. This test, like any of the other synthetic monitoring tools in the plan, can be launched from 120 locations. A response time monitor can be launched at a 30-second frequency if needed.
Each response is recorded in a log and if the time of that reply falls within acceptable duration, nothing happens. However, that event’s record will contribute to a live graph of response times that is available in the APM dashboard.
If a Web server fails to respond or takes longer than the period specified as a threshold in the settings of the monitor, Site24x7 will raise an alert. This alert can be forwarded to a technician by email, voice or SMS message, or Slack post.
The response time monitor can be set up to track the load speed of pages or just important elements, such as images or interactive features. The tool can also be set up to retry a test a number of times before raising an alert.
Who is it recommended for?
The response time monitor is a sophisticated tool with lots of implementation options. It would only be of interest to businesses that run websites or mobile apps. The system can launch the same test from multiple locations around the globe, which is a useful option for businesses that use a content delivery network and need to measure performance for SLA enforcement.
Pros:
- Customizable response time tests
- Options for API or browser-based tests
- Root cause analysis through network, infrastructure, and server monitoring
- Live performance graphs and utilities for historical analysis
Cons:
- Many testing options take time to work through
The response time monitoring package on the Site24x7 platform offers many options for testing strategies and it can take a lot of time to plan exactly what tests you want to run and where you want to run them from. You need to target testing carefully because there are extra charges for high volumes of tests. Take advantage of the Site24x7 30-day free trial so that you can explore the platform and plan your tests before you have to pay for the package.
3. ManageEngine Applications Manager (FREE TRIAL)

The ManageEngine Applications Manager is a close competitor to the SolarWinds tool. The key advantage that the Applications Manager has over the Server and Applications Monitor is that it is available for installation on a Linux server. So, if you don’t have Windows Server on your site, this tool would probably be your best option.
Key Features:
- On-site tool
- Application dependency mapper
- Performance alerts
- Route response times
Why do we recommend it?
ManageEngine Applications Manager is a similar package to the SolarWinds Server & Application Monitor because it discovers and maps applications and services and measures response times as well as other performance metrics. The package also includes synthetic monitoring for websites, which provides more response time monitoring utilities.
The Applications Manager works on an alerting system and it covers server performance as well as application metrics. The tool shows application dependencies, detailing underlying performance all the way down to the server’s network interface.
This monitoring system is able to track on-site, remote, and cloud-based servers and the applications that they host. The tool also supports capacity planning and root cause analysis. Performance issues can be examined for troubled applications by launching end-to-end response time tracing and there is even a code analyzer that identifies inefficient programming.
Who is it recommended for?
This package has a Free edition for small businesses but it only monitors five assets. The first of the two paid packages is accessibly priced for small businesses and offers more capacity at a higher price for mid-sized and large businesses. The top plan covers multi-site organizations.
Pros:
- Offers on-premise and cloud deployment options, giving companies more choices for install
- Can highlight inter-dependencies between applications to map out how performance issues can impact businesses operations
- Offers log monitoring to track metrics like memory usage, disk IO, and cache status, providing a holistic view into your database health
- Can automatically detect databases, server hardware, and devices in real-time
Cons:
- Can take time to fully explore all features and options available
The Applications Manager installs on Windows Server as well as Linux and you can get it on a 30-day free trial.
4. Sematext Synthetic

Sematext Synthetics offers s range of active monitoring tools that will report on the response times of your Web pages and Web applications. The basic automated response time test that you can set on a schedule is the uptime monitor. This not only tells you whether your Web server is responding but also how long the reply took to get back. Of course, this test is more about connection speed than Web server performance but there are many other tests that you can perform and they all provide a response time element.
Key Features:
- Cloud-based
- Multiple test launch locations
- Uptime monitoring
- Page load speeds
Why do we recommend it?
Sematext Synthetics is a cloud-based automated testing package. This system is intended to monitor Web sites and Web applications. The service is sold in packages that include HTTP tests and more complicated browser-based testing. Response time monitoring is the simplest of the test that this package offers.
You can choose which tests to run, how often they should launch, and where they are run from. Sematext offers eight test locations:
- Virginia, USA
- California, USA
- São Paulo, Brazil
- Dublin, Ireland
- Frankfurt, Germany
- Mumbai, India
- Singapore
- Sydney, Australia
You can choose whether you want text-based API-launched HTTP tests or full browser-based tests. It is even possible to choose which type of device the tests launch from, down to make and model.
The test results are stored on the Sematext cloud server and you choose with your plan how long that data is held. The cloud-hosted console displays the test results in lists and graphs and you can also create your own reports.
Test failure generates an alert, which you can decide to receive by email, Webhooks, or Slack message. It is also possible to set up your own alert triggers. Tests can track page loading, showing the load times of significant elements and events and it is also possible to test service availability, such as DNS responses.
Who is it recommended for?
The Sematext response time tests are intended for use by website administrators. The Sematext Synthetics package also includes transaction testing, which is useful for Web developers and provides tests for interactive elements in a Web page. A subscription also gets you SSL certificate validation and DNS assurance.
Pros:
- Test websites, APIs, and SSL certificates
- schedule tests at your preferred frequency
- Alerts for test failure
- Cloud storage for test results
Cons:
- Control your choice of tests to keep costs down
Sematext offers two subscription plans that have prices dependent on your choice of data retention period and the number of dedicated monitoring devices. There is also a Pay-as-you-Go plan, which is a metered service. You can get a 14-day free trial of either of the subscription plans.
5. Pingdom
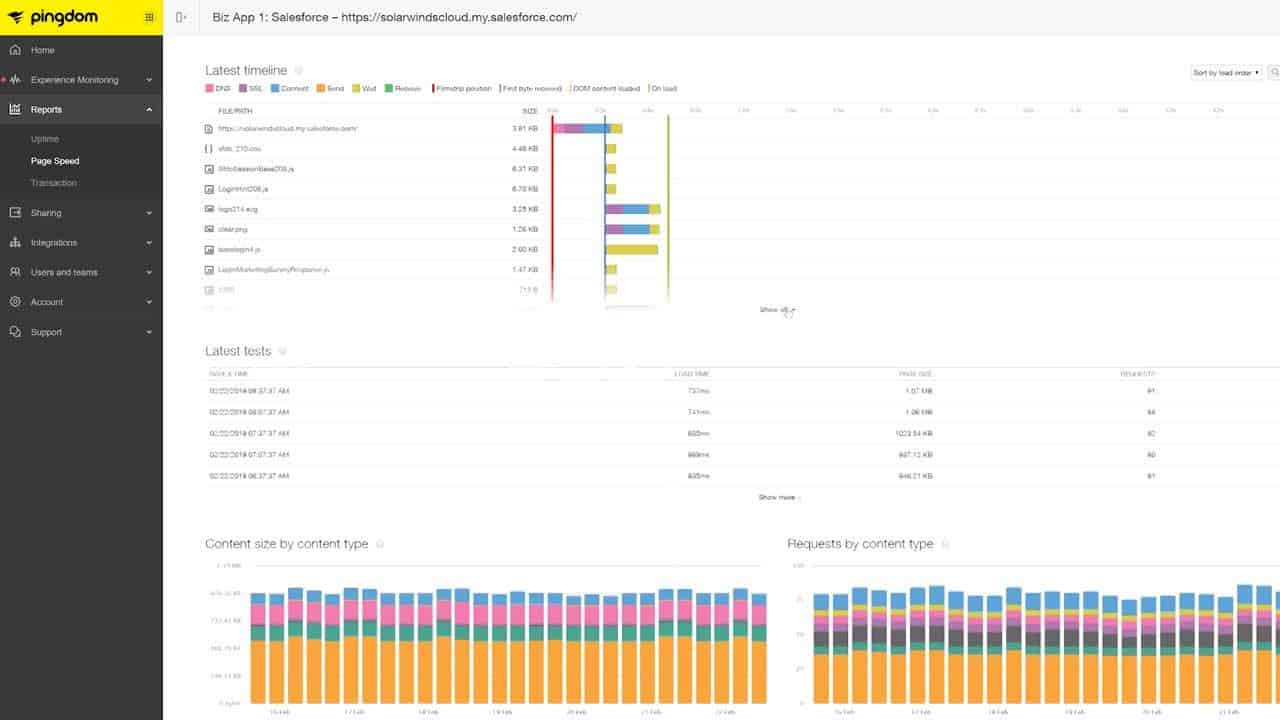
Pingdom tests a website’s availability and response times from more than 100 locations around the world. Test frequency depends on the plan used. The service is paid for by subscription and offers synthetic modeling and real-user monitoring.
Key Features:
- Designed for website response testing
- Option of 100 launch locations
- Availability and response times
Why do we recommend it?
Pingdom offers two plans for website performance monitoring. The first is the Synthetic Monitoring plan, which provides uptime monitors for multiple Web pages that will run continuously for a choice of locations plus advanced tests for page load speeds and interactive feature testing. The second plan is a Real User Monitoring bundle.
The response time tests target a specific page or process, enabling you to tailor tests and drill down to examine which element in a page is slowing everything down. These test facilities are particularly useful during the development of a new page because they help you spot features that will make good response times difficult to achieve.
Who is it recommended for?
The two packages from Pingdom are essential for any business that runs websites. The synthetic monitoring tools are useful for Webmasters who need to track performance and the Real User Monitoring system provides activity feedback for Web designers and marketers. This is a cloud-based system with many test launch locations.
Pros:
- Can monitor externally from over 70 locations, making it a great option for monitoring applications and services that serve a global audience
- Lives in the cloud, meaning no onboarding or complicated setup
- Alerts can be sent to email, SMS, and even integrate into custom solutions via API
- Uses root cause analysis to assist admins in fixing issues quickly
Cons:
- Could benefit from a longer trial time
This is an online service that is accessed through any standard browser. You can get a 14-day free trial of Pingdom.
6. SolarWinds Server & Application Monitor
The SolarWinds Server & Application Monitor is constantly active. The service works on a system of alerts, so managing technicians can assume that all applications are running satisfactorily unless otherwise notified. This is a great time saver because it removes the need to have a human resource constantly dedicated to application response time issues.
Key Features:
- Performance of on-site and Web-based assets
- Application dependency mapping
- Root cause analysis
- Operates across networks and the internet
- Performance alerts
Why do we recommend it?
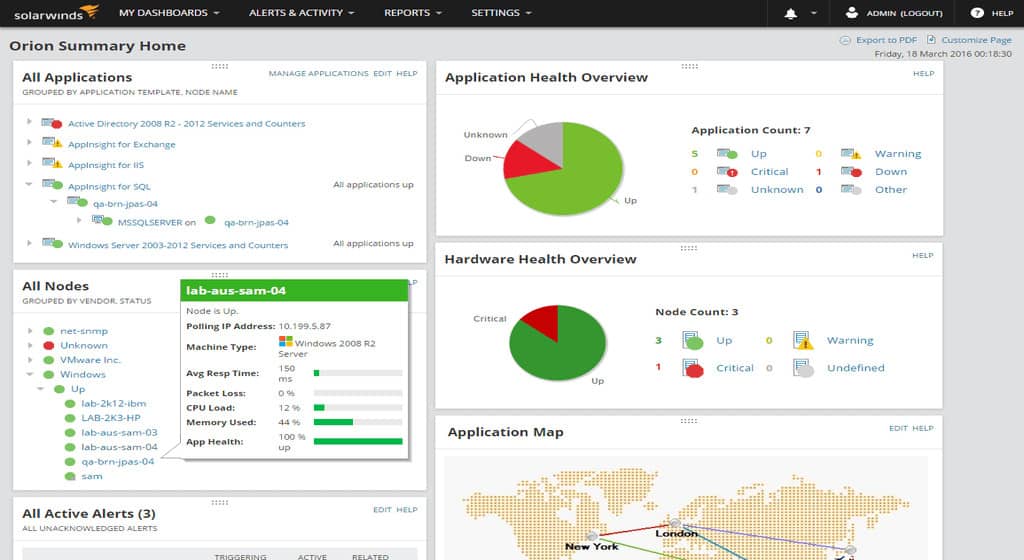
SolarWinds Server & Application Monitor provides discovery and mapping for applications and server resources. One of the metrics that the monitor tracks is response time for each application. This can be assessed as part of a chain of systems that contribute to the delivery of an application.
Alerts are triggered by thresholds that monitor a large number of metrics. For example, if CPU utilization goes above a certain percentage, an alert will trigger. Alerts are shown in the system dashboard and they can also be forwarded to key staff members by SMS or email.
This tool is able to monitor applications no matter where their hosts are located and that includes cloud servers. The dashboard includes an application dependency mapper, which shows the services that underpin each user-facing application.
Server statuses are also monitored, so it is possible to drill down and identify the root cause of a response time issue. The tool won’t go down to the network, but it does measure server network interface activity, which will enable you to identify response time impairment that is caused by a network issue.
Who is it recommended for?
This is a complex system that has pre-written templates for more than 1,200 applications. It is able to track applications running on cloud platforms as well as ln your own servers. This is an extensive system that is suitable for use by large companies. The software package runs on Windows Server.
Pros:
- Designed with large and enterprise networks in mind
- Has some of the best alerting features that balance effectiveness with ease of use
- Supports both SNMP monitoring as well as packet analysis, giving you more control over monitoring than similar tools
- Uses drag and drop widgets to customize the look and feel of the dashboard
- Robust reporting system with pre-configured compliance templates
Cons:
- This is a feature-rich enterprise tool, small networks may find it overwhelming
The Server & Application Monitor installs on Windows Server. SolarWinds offers this tool on a 30-day free trial.
7. Google PageSpeed Insights
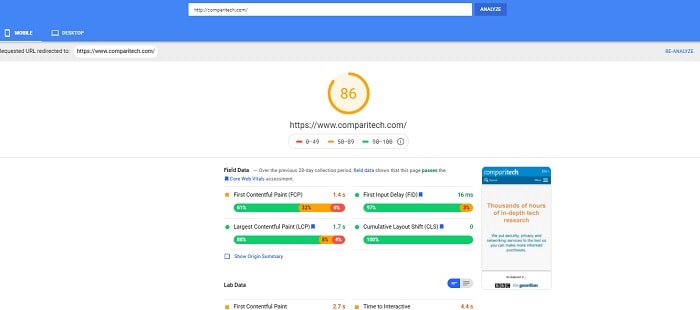
PageSpeed Insights is a free online tool from Google that measures a range of load time and response time metrics for a web page. This is an on-demand tool, so it won’t be suitable for monitoring. However, it is an excellent analysis tool for ad-hoc investigations. Not only does the tool examine many different loading speeds but it also produces recommendations on how performance can be improved.
Key Features:
- Online service
- Traffic light performance grading
- Tips for performance improvements
Why do we recommend it?
Google PageSpeed Insights is a free online service that assesses Web pages with tests launched from mobile devices and browsers. The package calculates a score, which is also color-coded with traffic light colors. With this report, you can identify coding inefficiencies and hosting problems.
A great benefit of hitting a high score for a page’s load and response times through this tool is that it gives an analysis of a page as used by Google. There are many factors that go into Google’s page ranking system and performance is one of them. So, tuning a page according to the recommendations of PageSpeed Insights should also improve the page’s position in Google’s results pages.
Who is it recommended for?
This tool is useful for Web designers who have new pages or feature additions that they want to test before putting them live. The system is also useful for Web administrators for occasional performance tests. However, this service can’t be set up to run continuously.
Pros:
- Free online tool
- Provides page speed score alongside technical metrics
- Offers next steps to improve your response time and overall page speed
Cons:
- Must be run manually
- Not a replacement for continuous monitoring
Response time monitoring FAQs
How do I optimize my server response time?
The issue of response time is complicated by the many elements that can slow down a reply from getting to an end user and this complexity increases with distance because of the influence of internet connection performance. Thus, the only way to meaningfully improve response times is to focus effort on specific components in the application delivery system. Isolating server performance is a good place to start, Invariably, poor server performance is caused by overloading. If your server is working well, the delivery of applications can still perform badly if the server’s CPU, memory, and interfaces are all operating at full capacity without being able to service all demand. Therefore, the best way to improve server performance is to work out how much demand it needs to meet at any point in time and then increase capacity accordingly.
How do you measure response time of an application?
In order to identify the response time of an application, you need to be clear about exactly what you mean by that term. Are you interested in isolating the performance metrics of the application itself, or are you more interested in the full stack of services that contributes to the delivery of an application? Whichever of these response times you want to measure, you will need to identify the performance of each component of the stack and then fine-tune each in order to improve application response time.
