Managing modern IT environments requires effective monitoring tools to maintain performance, reliability, and uptime. SolarWinds Network Performance Monitor and Datadog are two leading solutions in this space, each offering strong capabilities but catering to different types of infrastructures and operational needs.
SolarWinds NPM is widely known for its deep network visibility, particularly in on-premises environments. It enables teams to track bandwidth usage, latency, and device health, supported by detailed dashboards and reporting. Its strengths lie in fault detection, real-time alerting, and capacity planning, making it a solid choice for organisations managing complex internal networks.
Datadog, on the other hand, takes a cloud-first approach, designed for scalability across hybrid and multi-cloud environments. It integrates seamlessly with cloud platforms and provides insight not only into networks but also into applications and infrastructure. With features such as application performance monitoring (APM), log management, and real-time analytics, it is especially suited to dynamic, distributed systems.
This comparison examines areas such as features, usability, deployment, scalability, pricing, and integrations, helping you identify which platform best aligns with your network monitoring requirements.
SolarWinds NPM – Overview
SolarWinds Network Performance Monitor (NPM) is a powerful network monitoring tool that helps organizations detect, diagnose, and resolve network performance issues. SolarWinds NPM focuses on monitoring the health of the devices connected to a network. NPM uses SNMP monitoring to poll the management information bases (MIBs) on devices to obtain critical performance metrics. In addition, it includes autodiscovery that compiles an asset inventory and automatically draws up a network topology map.

The tool is best suited for medium to large-scale enterprises.
Some of the key features and capabilities include:
- Multi-vendor network monitoring
- Network Insights for deeper visibility
- Intelligent mapping
- NetPath and PerfStack for easy troubleshooting
- More innovative scalability for large environments
- Advanced alerting
- Critical path visualization
SolarWinds NPM can be deployed in the cloud or on-premises using Windows server 2019, 2016, or 2012 R2. The SolarWinds Orion platform is required to deploy NPM either in the cloud or on-premises. The Orion Platform is the core of all SolarWinds IT products, and it allows the NPM to work and integrate with other SolarWinds tools and software seamlessly.
Pros:
- Takes a holistic approach to server performance and health monitoring
- Supports auto-discovery that builds network topology maps and inventory lists in real-time based on devices that enter the network
- Supports both SNMP monitoring as well as packet analysis, giving you more control over monitoring than similar tools
- Uses drag and drop widgets to customize the look and feel of the dashboard
- Robust reporting system with pre-configured compliance templates
Cons:
- Designed for IT professionals, not the best option for non-technical users
The SolarWinds NPM license is based on several items to monitor or the most significant number of the monitored network elements. Each license tier has a stipulated maximum number of supported nodes (routers, switches, physical and virtual servers), interfaces (VLANs, ports, and interfaces), and volumes (any logical disks being monitored) to manage and monitor, as shown on the table below:
| License Tier | Node Limit | Volume Limit | Interface Limit |
|---|---|---|---|
| SL100 | 100 | 100 | 100 |
| SL250 | 250 | 250 | 250 |
| SL500 | 500 | 500 | 500 |
| SL2000 | 2000 | 2000 | 2000 |
| SLX | Unlimited | Unlimited | Unlimited |
Table 1.0 SolarWinds NPM pricing model
You can check out the 30-day fully functional free trial to confirm its capabilities and ensure it’s the right fit for your organization before purchase.
Datadog – Overview
Datadog is an agent-based on-prem and cloud infrastructure monitoring service for cloud applications, servers, databases, tools, and services. It’s headquartered in New York and has Boston, Dublin, Paris, Singapore, Sydney, and Tokyo. Datadog was named a Leader in the 2021 Gartner Magic Quadrant for Application Performance Monitoring. It provides developers and IT operations teams real-time visibility into all technology infrastructure through a single visual interface. Datadog uses its auto-discovery service to explore and identify devices in your network. The outcome of the auto-discovery service is then used to create a device inventory, which forms an index for the complete monitoring service.
Datadog’s key features include:
- Network monitoring Allows companies to visualize traffic flow in cloud-native environments and analyze performance using meaningful, easy-to-understand tags.
- Application performance management Monitors, troubleshoots, and optimizes application performance.
- Log management Allows users to search, filter quickly, and analyze logs for troubleshooting and data analysis.
- Synthetics Tests proactively monitor end-to-end user experience with an intuitive web recorder.
- Alerts Organizations can create custom alerts for any metric or performance problem. Notifications are available via email, PagerDuty, Slack, etc.
- Integrations The software integrates with multiple products and development stacks to aggregate metrics and events.
- Dashboards High-resolution interactive dashboards help companies monitor and graph real-time metrics and events.
- Collaboration Tools provide visibility across teams by letting users annotate changes, record problems, and communication, and discuss issues in context with production data.
- Application programming interface (API) API access helps companies observe apps and infrastructure by capturing events and metrics using client libraries.
Once all devices and links have been identified, you can overview all network activity from the Datadog dashboard. The service also draws up a network topology map that can be used to get quick insights into each node. Any changes to the network can be automatically spotted. This helps to adjust the network inventory and topology map without any human intervention. Traffic flow analysis features in the Datadog tool enable you to examine each device and link to discover total capacity and utilization. The analysis features let you see which applications or endpoints generate the most traffic on your network.
Pros:
- Offers numerous real user monitors via templates and widgets
- Can monitor both internally and externally giving network admins a holistic view of network performance and accessibility
- Changes made to the network are reflected in near real-time
- Allows businesses to scale their monitoring efforts reliably through flexible pricing options
Cons:
- Would like to see a longer trial period for testing
A free 14-day trial with full access to all the features is available for download. After that, the software is generally sold through monthly subscription plans based on hosts, events, or logs.
SolarWinds NPM Vs. Datadog: How They Compare
Systems Requirements and Installation
System requirements depend on various factors such as the NPM deployment model (on-premise or in the cloud), the size of the environment to be monitored, and Orion Platform products. The system requirements for on-premise deployment include Orion server hardware and software running Windows server 2012/2016/2019 with at least 4 CPU cores, 6GB of RAM, and at least 10GB of disk space. In addition, NPM supports Amazon and Microsoft Azure cloud solutions, requiring Orion software server and database to be hosted at the exact location.
The challenge here is that the capabilities SolarWinds NPM offer come at the expense of enormous system resource requirements. This means that to get the most of this software, you need a hardware and software server that will be capable of handling all that SolarWinds NPM has to offer.
Since Datadog is a SaaS-based application, there are no on-premise system requirements and no installation hassles. However, you’ll be required to install local agents specific to the device or service you wish to monitor for the most part. An agent-based mode means no auto-discovery feature, so you have to deploy an agent for all your devices individually. Datadog supports integration with VMware vSphere, but the setup process is a bit complicated. That said, Datagod provides enough documentation and setup instructions to guide you through the installation and configuration process.
Dashboards and Visualizations
SolarWinds NPM lets you visualize your entire IT infrastructure in one customizable dashboard and other visualization tools such as NetPath, Orion Maps, Network Atlas, and PerfStack. SolarWinds NPM network visualization software also offers the option to create Wi-Fi heatmaps, which helps assess how your network infrastructure is performing for end-users. Any map you create in NPM can be exported, printed, or viewed in the Orion Web Console. But, while NPM maps and other forms of visualization can be visually impressive, there’s a relatively steep learning curve involved before you can get them working.
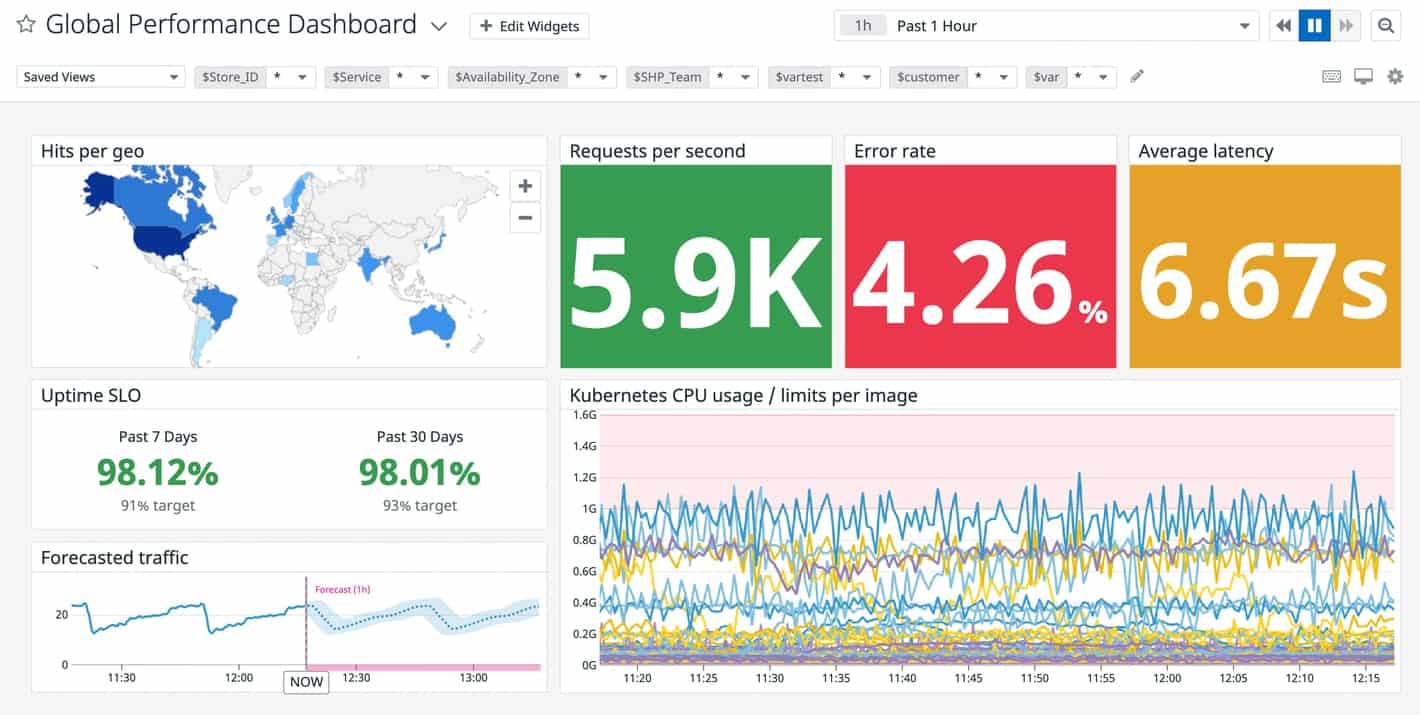
Datadog is also aesthetically pleasing from a visual perspective with its clean and modern dashboard design. In addition, Datadog allows you to customize your dashboards with a vast library of visualization tools and drag-and-drop widgets. But it requires a lot of setup work to get things working as well. Once set up, there are two primary ways of visualizing your data:
- Screenboards Grid-based dashboards with free-form layouts that include images, tables, host maps, graphs, and logs. They are commonly used as status boards or storytelling views that update in real-time or represent fixed points in the past.
- Timeboards This represents a single point in time—fixed or real-time—across the entire dashboard. They are commonly used for troubleshooting, correlation, and general data exploration. In addition, you also get a time series that can plot any metric being captured from your hosts, such as CPU usage, uptime, or memory usage.
Alerts and Notifications
SolarWinds NPM has some of the best alerting features that balance effectiveness with ease of use, including an intelligent alerting system that can execute alert creation and reset actions. In addition, you can leverage the Orion Platform’s modular structure to see all events and alerts on your network in one view. SolarWinds NPM provides out-of-the-box network alerts you can use or modify according to your needs. The NPM unique intelligent alerting system is beneficial in large network networks that want to avoid unnecessary network notifications and assign alerts according to people, days, or events.
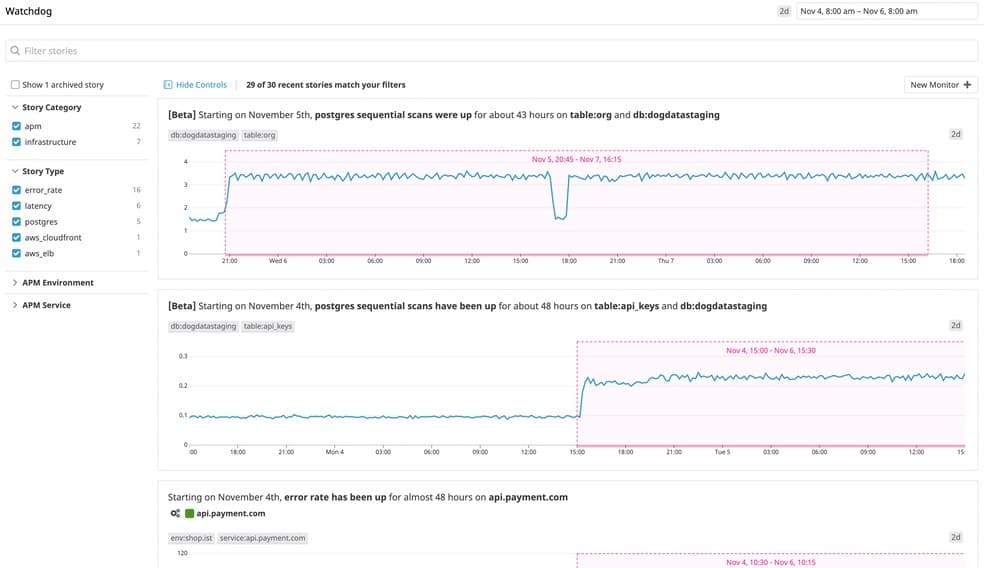
Similarly, Datadog’s approach to alerts and notifications is based on machine learning (ML), which it calls Watchdog. Watchdog uses ML techniques to identify problems in your infrastructure, applications efficiently and services, and flag anomalies. Alerts in Datadog are called Monitors. Users can receive alerts using Pagerduty, Slack, and email. These can be based on nearly any metric that Datadog can capture. As a result, every alert is specific, actionable, and contextual—even in large and temporary environments. This unique approach to alerts and notifications makes both SolarWinds NPM and Datadog stand out and helps to minimize downtime and prevents alert fatigue.
Reporting and APIs
SolarWinds NPM provides predefined out-of-the-box reports for each Orion Platform product. Reports can contain detailed, current state information, or they can include historical data. In addition, you can run an ad-hoc report or schedule reports to be sent to you automatically, as a PDF, a web page, or email. But it’s somewhat challenging to run ad hoc reports on specific devices or groups.
SolarWinds NPM’s reports can be modified to limit the information contained in the report by user profile, enabling you to generate reports for specific departments or recipients. However, creating a custom report can be difficult if you have to connect to a database to receive better information or if you need to customize a report to suit your business needs. Nonetheless, it’ll meet your organization’s compliance requirements.
Instead of generating the usual out-of-the-box reports that most network admins expect, the Datadog approach to reporting aims to make metrics easily searchable, and it does excellently. Although some network managers prefer the excellent old nicely generated fixed PDF report, not everybody needs it. Therefore, Datadog also comes equipped with an easy-to-use API that can significantly extend the range of what Datadog can track. The Datadog API is an HTTP REST API that can access the Datadog platform programmatically and returns JSON from all requests.
Licensing and Price Plans
The SolarWinds NPM pricing model is based on several items to monitor. Each license tier number provides the maximum limit of nodes, interfaces, and volumes to manage and monitor.:
- Nodes are monitored devices, such as routers, switches, virtual and physical servers, access points, and modems.
- Interfaces are single points of network traffic, such as switch ports, physical interfaces, virtual interfaces, sub-interfaces, and VLANs.
- Volumes: any logical disks being monitored.
The purchase of a license gives you perpetual access to the tool, including one year of support and maintenance. Still, its capacity will be limited to the maximum number of elements allowed with the chosen plan. For SMBs, SolarWinds NPM license cost may seem high depending on the number of items to monitor, but it is worth it in the long run.
Datadog pricing model is based on per server, per month, and it’s free for up to 5 hosts (with 1-day data retention). But some customers complain that it becomes costly at scale. As a result, Datadog is available in several different pricing tiers:
- The Network Performance tier Suitable for monitoring networks and systems for most small to midsize businesses.
- The Infrastructure tier Ideal for organizations that want to use the software as a centralized monitoring service for systems and services.
- The APM tier Designed for larger organizations looking to fix service and device-layer problems.
- Serverless tier Aimed at those looking to monitor network and application issues.
- Log Management tier Meant for companies with large amounts of log data to parse for context and retention.
- There are also different tiers for security, synthetic, and accurate user monitoring, each with pricing appropriate to the core task.
All Datadog prices are billed annually, making it one of the most price-customizable management apps.
| Features | SolarWinds NPM | Datadog |
|---|---|---|
| Target market | Ideal solution for medium to large-scale enterprises. | Developers, freelancers, IT operations teams, security engineers, and business users from SMB to large organizations in the cloud age. |
| Supported platform | Windows and Orion server | Mac OS X, Windows, Linux, Online |
| Deployment model | On-premise or cloud | SaaS-based |
| APIs calls | REST API | HTTP REST API |
| Support methods | Online Knowledge base Video tutorials | Phone Online Knowledge base Video tutorials |
| Licensing and pricing model | Free trial available Perpetual licensing with renewable maintenance | Free trial available No credit card required Free account Subscription-based |
Table 2.0 | Comparison of SolarWinds NPM and Datadog key features
Network Device and Traffic Monitoring
SolarWinds and Datadog have conflicting definitions of “device” and “performance.” The SolarWinds Network Performance Monitor uses SNMP to get status reports from network devices. Datadog delivers this functionality in its Network Device Monitoring package. Datadog also offers a Network Performance Monitoring module. This offers the same service as the SolarWinds NetFlow Traffic Analyzer.
The Datadog Network Device Monitoring and Network Performance Monitoring modules work well together but they are not dependent on each other. They are both dependent on the Datadog Infrastructure Monitoring service – you need to have that module operating before either of the two network monitoring tools will work.
There are no requirements for other modules in order to get the Network Performance Monitor to run. However, the SolarWinds NetFlow Traffic Analyzer requires the presence of the Network Performance Monitor. SolarWinds offers these two modules in a package, called the Network Bandwidth Analyzer Pack. The two tools in the bundle interlock and operate through the same console, making them seem to be one continuous service.
Conclusion
SolarWinds NPM is a feature-rich solution that can meet the needs of any organization, from SMB to large enterprises. Most users found the application intuitive to use, administer, and do business with. But, on the other hand, the capabilities that this tool offers come at the expense of enormous system resource requirements. This means that to get the most out of this software, you need a hardware and software server that will be capable of handling all that SolarWinds NPM has to offer.
Datadog’s SaaS-based model makes it ideal for organizations that don’t want to burden themselves with any resource-intensive on-premise monitoring solution. Service-oriented companies, SMBs, or smaller networks that don’t have dedicated IT personnel to keep tabs on the infrastructure at a granular level will find this feature-rich tool suitable. More extensive networks with multiple remote locations may find Datadog’s agent-based model inconvenient since agents will need to be individually installed. But if you can successfully get past the agent installation and configuration process, Datadog is an excellent network monitoring and infrastructure management tool.
