Network monitoring products come and go but few products have made as many waves as SolarWinds Network Performance Monitor (NPM) and the open-source Zenoss Core. These two products have developed cult followings as distinct monitoring solutions. In this article, we’re going to look at Solarwinds NPM vs Zenoss to see which offers the better experience.
Key Features
SolarWinds Network Performance Monitor
- Windows-Based GUI: Provides a user-friendly interface for ease of use.
- Auto-Discovery: Automatically discovers and maps network devices.
- SNMP and ICMP Monitoring: Uses these protocols to monitor device health.
- NetFlow Traffic Analysis: Bundled with the NetFlow Traffic Analyzer for bandwidth monitoring.
- Customizable Dashboards: Allows for drag-and-drop widget customization.
Zenoss Core
- Web-Based GUI: Provides an intuitive web-based interface.
- Network Discovery: Discovers devices by IP range using SNMP, ICMP, and SSH.
- SNMP and ICMP Monitoring: Monitors device health through these protocols.
- NetFlow Traffic Analysis: Supports multiple traffic analysis protocols, including NetFlow and IPFIX.
- Plugin Support: Offers over 200 plugins for additional functionality.
Below is a brief comparison of features:
| Feature | SolarWinds Network Performance Monitor (FREE TRIAL) | Zenoss Core |
|---|---|---|
| User Interface | Windows-based GUI, Web-based GUI | Web-based GUI |
| Autodiscovery | Yes | Yes (Discover by IP range) |
| Device Monitoring | SNMP, ICMP | SNMP, ICMP |
| Bandwidth Monitoring | Yes (with NetFlow Traffic Analyzer) | Yes - NetFlow, IPFIX, sFlow, J-Flow, and AppFlow NetFlow |
| Alerts | Email, SMS | Email, Pages |
| Reports | Yes | Yes (Schedulable) |
| Plugins | No | Yes (Over 200) |
System Requirements
| Product | Operating Systems (Core Program) |
|---|---|
| SolarWinds Network Performance Monitor | Windows |
| Zenoss Core | Windows, Mac OS, Redhat Enterprise Linux, Ubuntu, Cent OS, Fedora Core, Suse, and VMware. |
Installation and Setup
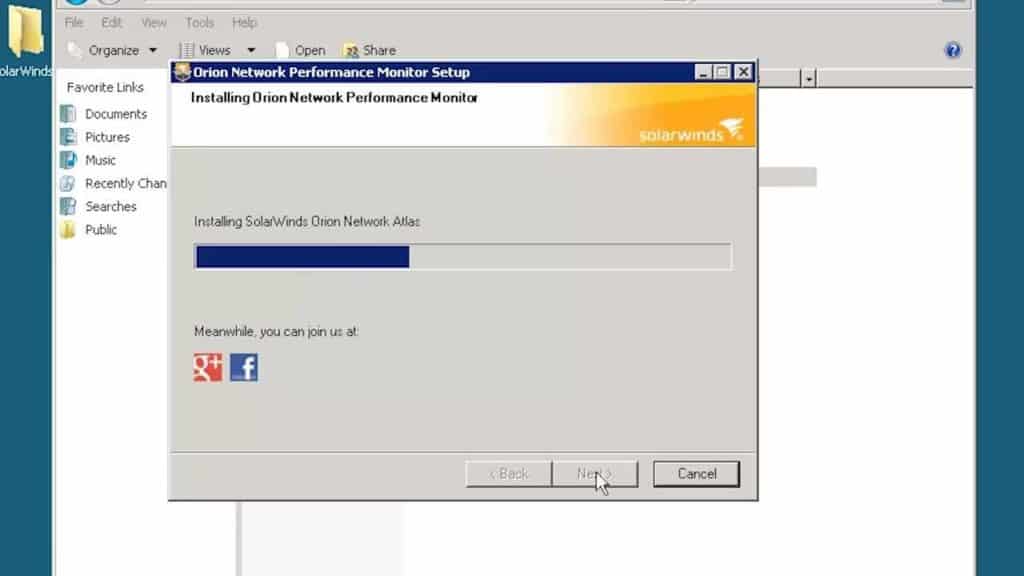
The ease of deployment all rests on the simplicity of the installation and setup process. Having a product that is easy to install out of the box minimizes the resistance you face throughout onboarding it. SolarWinds Network Performance Monitor offers a very promising approach for this.
However, before you start deploying the product you’re advised to make sure that you have the drive space required to install the product and to consider building extra polling engines for the Orion Platform. Once you’ve purchased the software you’ll need to log in to the Customer portal to download it. You then need to download the latest version by clicking through to a drop-down menu.
On the Orion Application Server, you need to make sure that you have all the necessary software and that you’re logged in to a Local Admin account before you begin. Once you’ve extracted the zip file and decided on a location for the program you will then be working through the Configuration Wizard. On the whole, this process is relatively straightforward.
As Zenoss Core can be configured on a range of Linux operating systems, the setup process is a little more complex. That being said, Zenoss Core does have a trick up its sleeve that makes the entire process more simple. From the release of Zenoss Core 4, there has been an auto-deploy script that reduces the amount of manual configuration that needs to be completed. Essentially the auto-deploy script automatically runs all the files required during setup.
While this isn’t as lightweight as SolarWinds Network Performance Monitor’s setup process it is more convenient than most other open source applications. Naturally, SolarWinds MPN has the edge here but Zenoss Core’s auto-deploy script greatly reduces the amount of time you need to spend setting things up.
Network Auto-Discovery
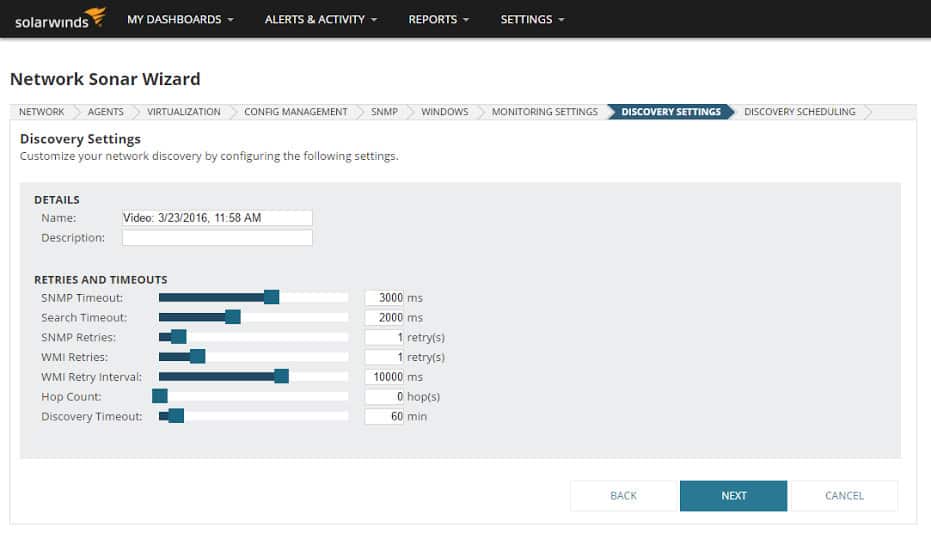
When you implement a new network monitoring product one of your first tasks is going to be configuring your network devices. In most programs, you need to add devices from your network to your network monitoring software before you can start monitoring them. However, SolarWinds Network Performance Monitor instead provides you with an auto-discovery feature.
With auto-discovery, devices are connected immediately after you finish the setup process. You don’t have to search for them or configure them. This makes for streamlined deployment where you don’t have to waste time configuring your devices manually.
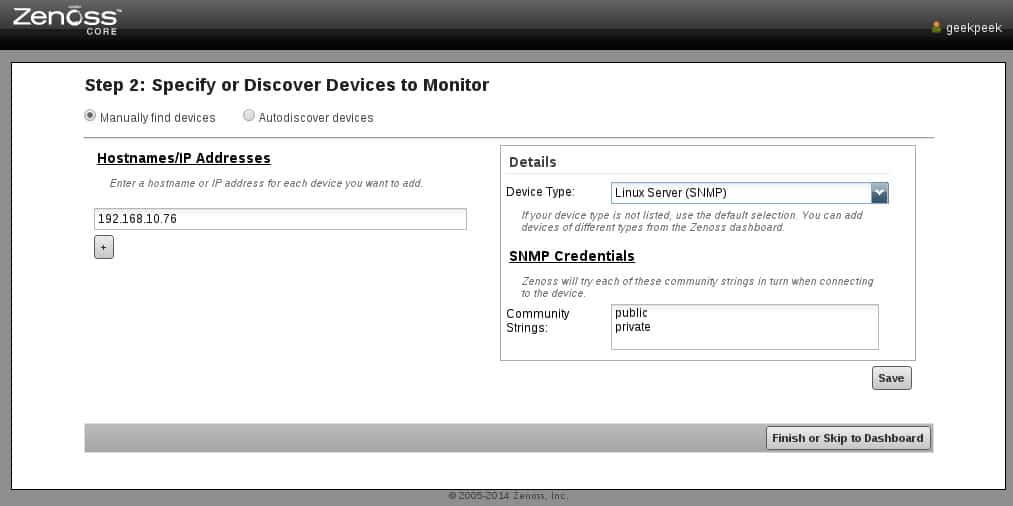
However, the process with Zenoss Core isn’t quite so simple. To discover a device you need to select the IP range you want to use and the Windows, SNMP, and SSH details you want to use. To do this you’ll need to:
- Select Infrastructure from the Navigation menu. The device page displays.
- Click the Add Devices icon (a computer screen accompanied with a “-”) then select Discover Networks.
- On the Network Discovery page select the IP address or range you want to discover. (You can opt for CIDR notation for single IP addresses and ranges are formatted like so: 192.0.2.1-50).
- Now that the range has been selected, you need to enter the credentials you want to use for Windows, SSH, and SNMP.
- Click Discover. This will start the discovery process.
It is fair to say this process is more complex than SolarWinds Network Performance Monitor’s complete auto-discovery but it gets the job done just fine. Naturally though, SolarWinds Network Performance Monitor has the edge with regards to autodiscovery because it makes deployment much easier for new users. This is particularly true on larger enterprise networks with lots of devices.
Network Monitoring
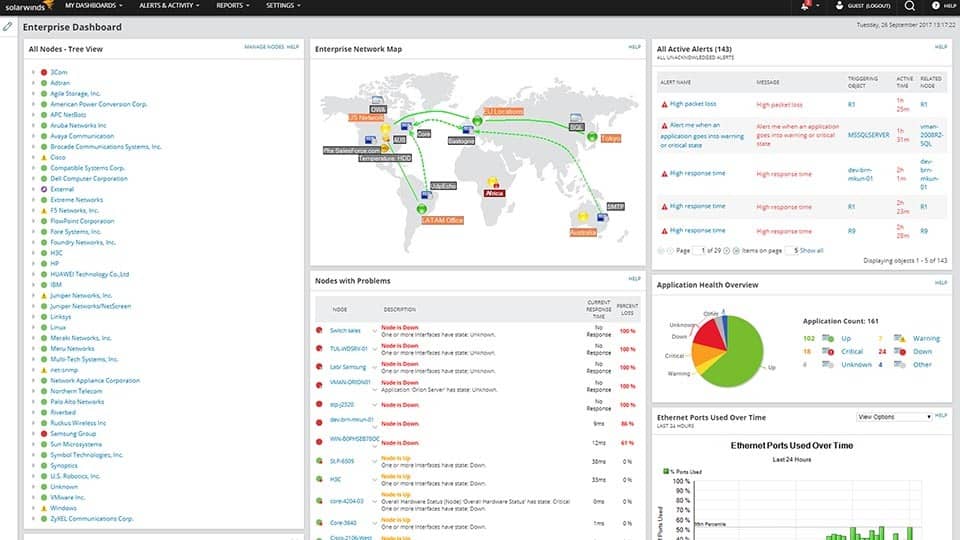
In this section, we’re going to look at how the overall monitoring experience is delivered in both products. A more specific look at visualization can be found further down. As one of the top products on the market at the moment, SolarWinds Network Performance Monitor’s network monitoring experience is excellent. Devices are color-coded according to their health, and you can also customize displays such as Top 10 devices by utilization. Moreover, the Nodes with Problems window is very useful, which shows you all nodes that are incurring difficulties. This is especially useful when you are trying to meet faulty devices head on.
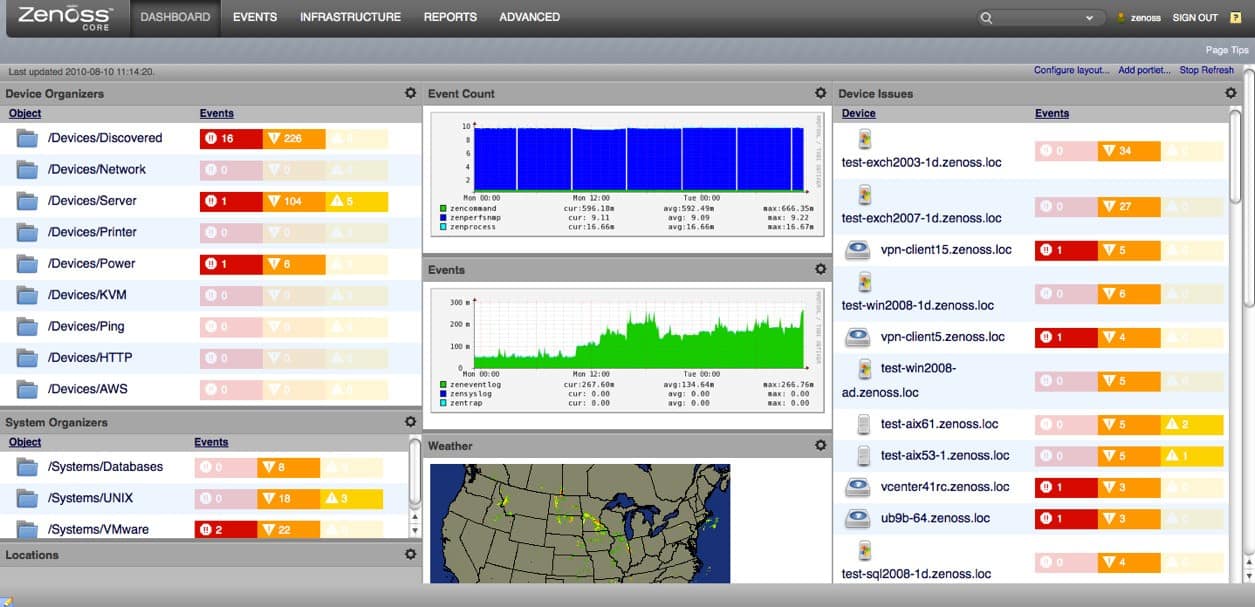
Zenoss Core delivers a monitoring experience with a dated design that is driven by Python. Originally, Zenoss Core’s auto detection capabilities brought it a lot of popularity. Another monitoring feature that helps move you along nicely is monitoring templates. Templates are used to configure data for devices, components, and interfaces throughout the network out of the box. This means that you don’t have to configure everything yourself.
Device Monitoring
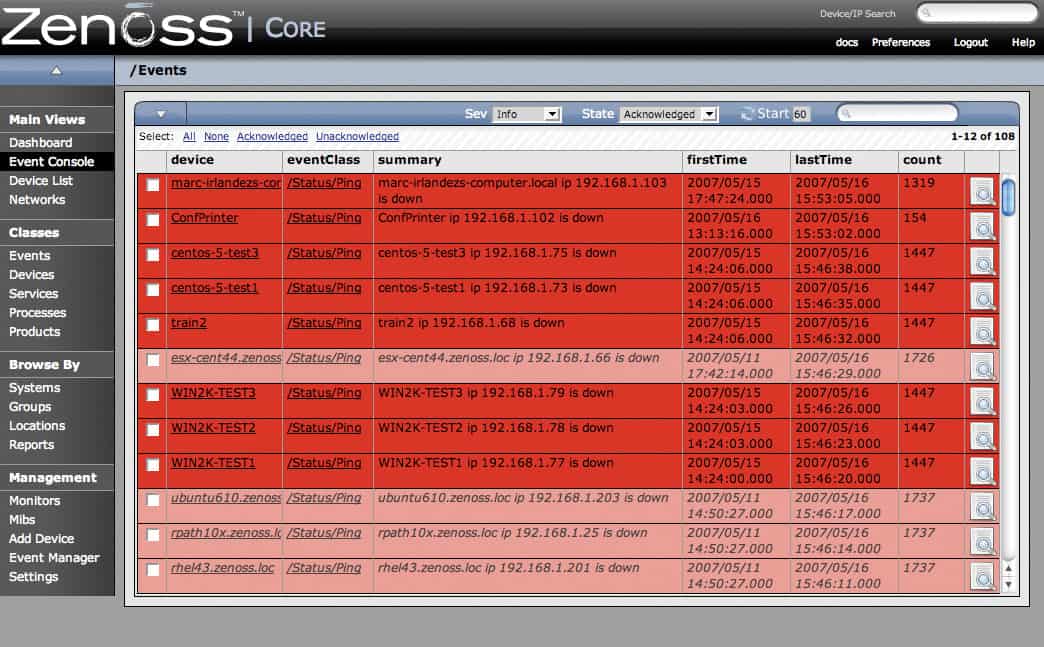
The way these two products monitor connected devices is almost identical. SolarWinds Network Performance Monitor uses SNMP and ICMP to poll the devices to which it is connected. By assessing their responsiveness, the program can ascertain how well a device is performing. Slow responses indicate that a device has been compromised.
The program works by executing polls according to varying schedules with independent timers. This tests them automatically to assess their status. This is very much the model that Zenoss Core operates under. Zenoss Core uses SNMP and ICMP to assess the integrity of connected devices. This gives more bandwidth to work with when monitoring devices. Given that the two are on par here and both offer SNMP and ICMP, it is a tie.
Bandwidth Monitoring
Zenoss Core is able to extract network traffic data from switches and routers, using the NetFlow protocol. The Network Performance Monitor doesn’t have traffic monitoring capabilities. However, it can be bought in a bundle with a companion module that adds on that function. This is the Network Bandwidth Analyzer Pack, which provides the SolarWinds NetFlow Traffic Analyzer as well as the Network Performance Monitor.
The NetFlow Traffic Analyzer helps you to identify traffic bottlenecks and overloaded switches – these are the reasons for lost packets. Zenoss Core provides exactly the same functionality. However, while Zenoss is only able to communicate with NetFlow, the SolarWinds tool can use NetFlow, IPFIX, sFlow, J-Flow, and NetStream. This enables the tool to communicate with the devices of a longer list of providers because not all network equipment makers load their devices with NetFlow capabilities.
Visualization
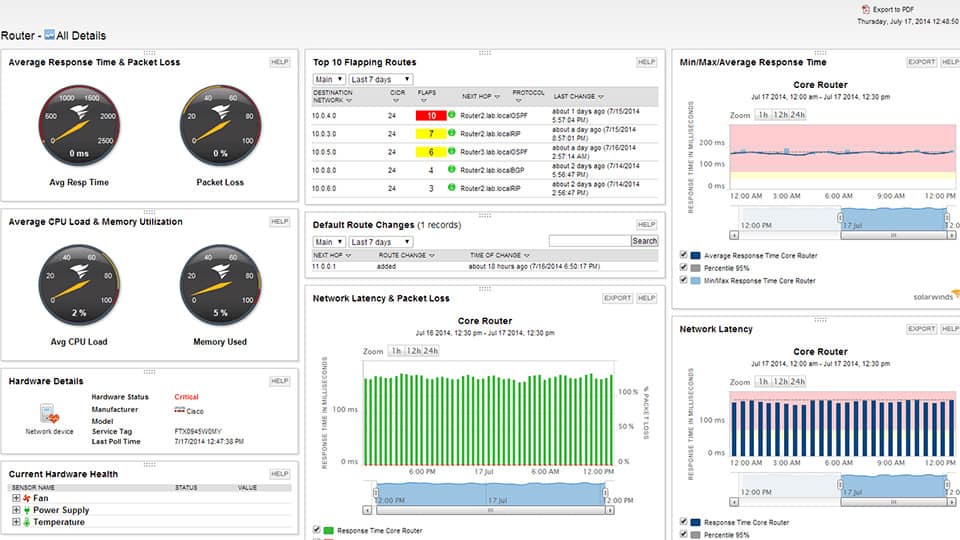
There are many different approaches to visualization with SolarWinds Network Performance Monitor. At a basic level, this is realized in the form of charts, graphs, and dials. However, SolarWinds has gone a little bit further. For example, the NetPath feature shows you a view of your network that displays a hop-to-hop perspective. Each hop is color-coded so that you can check on its status.
What makes this so valuable is that it works for physical infrastructure, cloud, and hybrid technologies as well. As such, it gives you a complete perspective of your network activity.

Zenoss Core’s design is a little more dated with visualization. Essentially, it offers color-coded dashboards of infrastructure health, graphs, and maps. You can also generate pie charts for comparing information about your network elements. For example, you could make a pie chart on performance health that color-codes devices as Acceptable, Degraded, Unacceptable, and Unknown.
Both products also offer users a topology map. On Zenoss Core, this shows the location of all devices on your network and shows their status. On SolarWinds Network Performance Monitor the network map works the same but production value is a little higher. It is also automatically updated because of the inbuilt auto-discovery feature which regularly scans for new devices. The strength of the SolarWinds user interface and the production quality of its visualizations give this program the advantage here.
Alerts
Alerts are one of the most important features for administering your administrative burden. Alerts reduce the manual monitoring time that you need to put in to stay on top of your network devices. Zenoss Core gets this right by providing threshold-based alerting. This means that when the usage data of a device exceeds or matches a certain level or threshold, the user receives an alert.
You can receive these alerts via pager or email. Zenoss Core also has an escalation chain facility that notifies an alternative user if the initial point of contact doesn’t respond promptly. This ensures that during those moments where there are pressing concerns, action still gets taken.
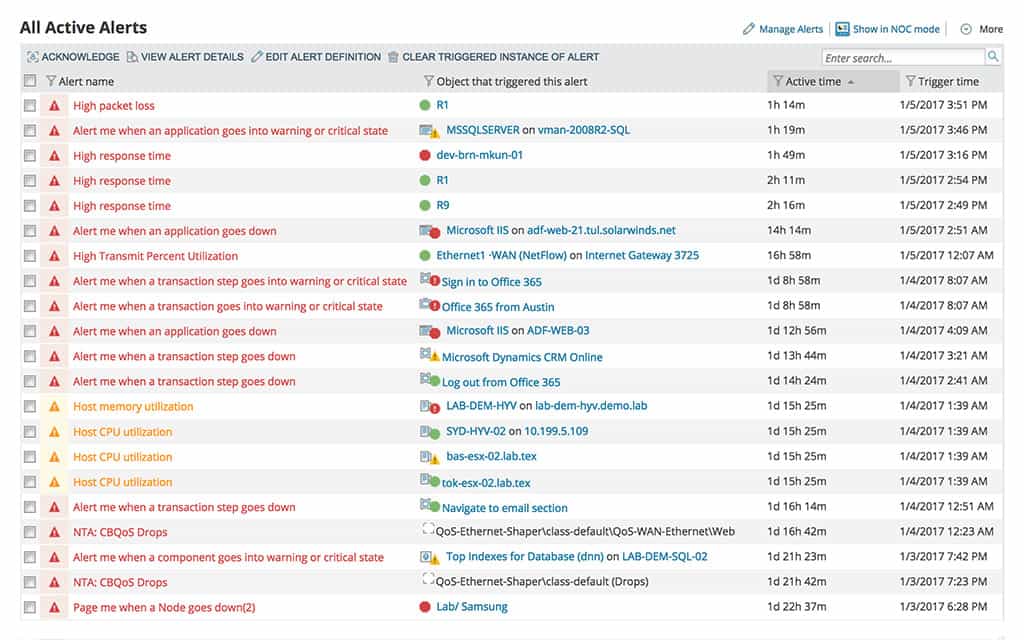
SolarWinds Network Performance Monitor also has its alerts set up on a trigger-based system. You can set your own trigger conditions so that when a device exhibits certain activity you’re notified immediately via email or SMS. You can also enter the times you wish to receive alerts so that you don’t get bombarded with notifications outside of working hours.
Based on how intuitive the alert configuration process is, SolarWinds Network Performance Monitor offers the better experience here. You can enter your own alert conditions without too much hassle. With respect to escalation chains, Zenoss Core has the advantage but the overall alerting experience doesn’t surpass that of Solarwind’s.
Reports

Reports are another feature that both SolarWinds Network Performance Monitor and Zenoss Core absolutely nail. With Zenoss Core you can generate and schedule your own reports as needed. This is great for checking in over a long time frame to make sure that you keep track of what’s happening. Out-of-the-box reports are only available when you request them. However, its very easy to schedule reports if you desire.
You first need to log into the Zenoss Core web interface and click Reports. At this point, you will need to know the name of the report you want to generate and its location. You then need to log into the Control Center master and enter the following command:
serviced service run zope reportmail run -u “http://localhost:8080/zport/dmd/Reports/FolderName/ReportName” -U user -p password -a emailaddress -f emailaddress
If there’s a space in the URL you would use %20.
This may seem a little tricky but once you’ve done it a couple of times it’s no problem. With SolarWinds Network Performance Monitor you can also display your historical data. One particularly interesting feature is that the Perfstack module allows you to email a URL address of your data to other members of your organization. This helps to takes a closer look at what’s going on. Based on the quality of the reports generated by SolarWinds Network Performance Monitor, this product has the advantage here.
Plugins
One feature that sets Zenoss Core apart from SolarWinds Network Performance Monitor is ZenPacks. ZenPacks are additional plugins that help you to add more functions to the system. There are over 200 of these, some of which are open source so that you can customize your experience even further. You can search through the available ZenPacks on the Zenoss site here.
On the other hand, SolarWinds Network Performance Monitor doesn’t offer users any additional plugins to choose from. While the default capabilities of the tool are quite extensive this feels like a missed opportunity. If additional plugins are important to you then we recommend you opt for Zenoss Core as there is plenty of additional content to support you.
Community
When it comes to getting the most out of a product, what you know is as important, if not more so, than what the product can do. There is often no better way to learn about a product than consulting the user community of the device in question. An active user community of knowledgeable IT professionals and administrators is worth its weight in gold during live monitoring.
As large products both SolarWinds Network Performance Monitor and Zenoss Core have a large community following. As it stands, the SolarWinds Thwack website has over 150,000 members. There is a range of forum posts dedicated to the topic of SolarWinds Network Performance Monitor and its features. In addition to forum posts, there is also a range of links on the product forum page with content including how-to-guides, documentation, and training videos.
The Zenoss community has six forums: Configuration and Administration, Installation/Getting Started, Legacy Discussions, Reporting Analysis and Analytics, Zenoss News and Updates and ZenPacks, and JSON API. In other words, the forums are centered around providing visitors with structured guidance on how to use Zenoss products. These forums range in size from 2,700 to 3,300 users.
However, in order to view all content on the Zenoss site, you need to sign up. You can get around this by following this link here but you need to sign in on the website. This isn’t a huge problem but it is a little inconvenient having to sign in or come to this page each time you want to access the complete forum.
It is also worth noting that Zenoss’s community following is a fraction of the size of SolarWinds’. The convenience and size of the SolarWinds community takes the win here.
Pros & Cons
SolarWinds Network Performance Monitor
Pros:
- Holistic Monitoring: Offers comprehensive server performance and health monitoring.
- Real-Time Auto-Discovery: Builds network topology maps and inventory lists dynamically.
- Detailed Control: Supports both SNMP monitoring and packet analysis for extensive control.
- User-Friendly Dashboard: Customizable with drag-and-drop widgets for a personalized experience.
- Robust Reporting: Includes pre-configured compliance templates for detailed reporting.
Cons:
- Geared Towards IT Professionals: Not ideal for non-technical users due to its complexity.
Zenoss Core
Pros:
- Fortinet Monitoring: Simple plugin support for Fortinet devices.
- Automatic Network Discovery: Pulls in new devices entering the network automatically.
- Cisco Device Support: Monitors Cisco Layer 2-4 devices effectively.
Cons:
- Support Limited to Paid Tiers: Full support is only available with paid versions.
Pricing
SolarWinds NPM and Zenoss Core are drastically different with regards to pricing. The former offers users multiple pricing options whereas the latter is an open-source product that is available for free. Pricing options for SolarWinds Network Performance Monitor can be seen below:
| Product Name | Number of Elements | Price |
|---|---|---|
| NPM SL100 | 100 | $2,955 (£2,307) |
| NPM SL250 | 250 | $6,720 (£5,248) |
| NPM SL500 | 500 | $10,445 (£8,157) |
| NPM SL2000 | 2000 | $19,345 (£15,108) |
| NPM SLX | Unlimited | $32,545 (£25,417) |
Though not specifically related to price, it is important to note that Zenoss Core is only compatible with up to 1,000 elements so if you need more, this can be a problem. However, given that Zenoss Core is the cheaper of the two, it offers a strong appeal to organizations with a limited budget.
There is a big difference between a free product and one that starts at $2,955. While the price of SolarWinds Network Performance Monitor isn’t exorbitant by any means it is still a hefty purchase for smaller enterprises with limited budgets. There is a free 30-day trial available so you can see whether it’s worth allocating funds to.
Conclusion
For an open-source product, Zenoss Core has certainly worn its age well. However, it loses out to SolarWinds Network Performance Monitor based on its design and autodiscovery. The production value of SolarWinds Network Performance Monitor alongside its relatively simple setup process makes it the natural pick for small and large enterprises alike.
The main areas where Zenoss Core has the edge is in terms of operating systems, plugins, and price, making it a better choice for smaller organizations. Likewise, the open-source format and plugins allow for organizations to build their own monitoring experience.
Despite this, SolarWinds NPM delivers a monitoring experience that is everything you could ask for under pressure. Being able to switch from classic graphs, to NetPath, and to topology maps allows you to zoom in and out of your network at will. This not only allows you to monitor in a way that is comfortable for you but also in a way that helps spot problems before they emerge.
For cloud monitoring, users should also look at this new product; SolarWinds Hybrid Cloud Observability
