
Ensuring the optimal performance and availability of websites, applications, and services is essential for business success. One effective approach to achieving this is through synthetic monitoring tools, which simulate user interactions to proactively detect performance issues before they affect real users. These tools help organisations understand how their digital services behave under different conditions by replicating real user journeys and testing system responsiveness in a controlled way.
Here is our list of the best synthetic monitoring tools:
- Site24x7 Synthetic Monitoring (FREE TRIAL) Offers a range of synthetics from Ping-based availability checks through to browser-based transaction monitoring from 110 locations.
- ManageEngine Applications Manager (FREE TRIAL) This synthetic monitoring service is part of a wider applications monitoring system that can track the performance of software running locally, on remote sites, or on the Cloud. Available for Windows Server and Linux.
- Datadog Synthetic Monitoring This testing package from a cloud platform offers uptime, response time, and transaction monitoring for websites from multiple locations and also includes a DevOps application testing service. Code profiling and distributed tracing are also available.
- SolarWinds Web Performance Monitor An on-premises website monitoring system that includes uptime and response time reports plus root cause analysis tools linked to transaction monitoring.
- Pingdom Synthetic Monitoring A bundle of uptime, response time, and web transaction monitoring that launches tests from more than 100 locations. It includes programmatic and browser-based checks.
- Sematext Synthetics This cloud-based website performance monitor provides a range of tests to check on load speeds and errors.
- Uptime.com This Web service offers synthetic monitoring as part of a combined package of Web asset testing and monitoring services.
- Paessler PRTG An on-premises monitoring system that includes the services of remote servers for multi-location synthetic web performance monitoring.
- Google PageSpeed Insights A free online tool for on-demand response time monitoring with detailed analysis of the causes of poor performance.
Rather than waiting for users to report problems, synthetic monitoring takes a proactive stance by continuously testing critical pathways such as logins, transactions, and API responses. This allows teams to detect slowdowns, outages, or functional failures early, helping to maintain consistent uptime and protect user experience. It is particularly valuable for organisations that depend on online services for revenue or customer engagement.
Most synthetic monitoring tools provide detailed insights into response times, availability, and performance across different regions, helping teams identify issues that may only appear in specific locations. They are commonly used for uptime monitoring, transaction testing, and API performance checks, giving a broad view of service health beyond passive observation.
This article explores the leading synthetic monitoring tools available today, comparing their capabilities, strengths, and practical use cases to help organisations choose the right solution for improving performance and delivering reliable digital experiences.
Synthetics for websites
Human website checkers cost a lot of money. The only viable method to make sure your website is available everywhere is to use automatic processes driven by software. This is what synthetic monitoring does.
Synthetic monitors remove the need for real people to check on your site from different locations. They emulate the actions of users and report back on statuses. An automated process doesn’t accidentally miss out on checks or forget to write things down. Automated monitoring is free from human error.
There are three levels of synthetic monitors:
- Uptime monitors
- Response time monitors
- Web transaction monitors
An uptime monitor just checks that your site is available. These checks are launched from several locations around the world and they occur repetitively. Some businesses set their uptime monitoring frequency at one minute, while others can work with five-minute intervals or even longer.
A response time monitor will report on how long important elements in a page took to load – these are also called load time monitors. This is because you don’t just need to know how long your web server took to reply to a request; you need to know how long it takes for the banner to appear and also elements such as images. It is important to know when the interactive features on a page, such as links, become active. Generally, uptime monitors work on websites, and response time monitors examine Web pages.
A Web transaction monitor is also known as a Web performance monitor or a Web application monitor. This checks on the elements in a page and makes sure they are working individually and as a suite. The proper way to make sure that a Web page works the way you expect it to is to get a real person to go through all of the utilities in your site, such as input forms or video players, and activate them. However, you don’t want to be reliant on members of the public to email you and tell you that an important part of the site is broken. This is because people won’t bother to do that, they will just move on to a rival site and buy its goods and services.
A Web transaction monitor implements a test script that runs through a sequence of actions on your live site to make sure that any users that arrive will be able to successfully complete an important task, such as ordering a product.
Synthetic monitoring modes
Some of the tasks that check on your live website can be done without actually loading any pages from it. For example, a system doesn’t need to load a page into a browser if it is just checking that the DNS entry for the site is correct or that the SSL certificate is valid. These synthetic monitoring services operate programmatically and are also known as API testers.
Uptime monitors in particular don’t need to get a full page from your site in order to report on its status.
Web transaction monitoring wouldn’t be thorough if a WebCrawler performed it. You can only get a proper user’s eye view of a site if it loads into a browser, so all Web transaction monitors are browser-based. Response time monitors are between these two scenarios because some elements can be tested just by examining the code for a Web page without actually having to render it. Others require the page to be loaded into a browser in order to measure its load time.
So, there are two modes of synthetics – API testing and browser-based tests. Browser-based tests are more expensive than API tests.
Synthetic monitoring frequency
Some factors of a web server’s performance are more vital than others. For example, if a Web server has gone offline, there is no point in launching a Web performance test. So, the different types of tests are performed at different frequencies. The optimal frequency for each type of test is:
- Uptime monitoring: 1 minute
- Response time monitoring: 5 minutes
- Transaction monitoring: 15 minutes
Uptime monitoring is the cheapest form of website checker and so can be performed more frequently without breaking the bank. It is also the most fundamental test that you need. As transaction monitoring is the most expensive type of test, businesses with little money to spend will lengthen the frequency of those tests.
Web application testing
The automated methods built into synthetic monitoring are ideal for use with We application testing. Although there are many packages available to perform specialized security tests for applications under development, the fundamental need to ensure that applications work speedily and accurately also needs to be addressed.
While synthetic monitoring for live sites and applications is better if those tests can be launched from remote locations, efficiency tests for applications that are yet to be released need to be able to reach into your private environment. So, there has been a recent push in the field of synthetic monitoring to allow the testing messages to be set up with internal testing destinations.
Synthetic monitoring packages that can integrate with project management tools and bug trackers are particularly useful for integration in CI/CD pipelines.
The best synthetic monitoring tools
In this report, we look at synthetic monitoring services that offer uptime monitoring, response time monitoring, and Web transaction monitoring. Some services offer all three in a bundle, while others focus on just one category of synthetics. The common thread is that they will let you know when problems arise without you having to wait for visitor counts to drop in order to figure out that something is wrong.
Our methodology for selecting a synthetic monitoring system
We reviewed the market for synthetic monitoring tools and analyzed the options based on the following criteria:
- Uptime and response time monitors
- Alerts for unavailability or slow responses
- Multiple test launch locations
- Options for development testing
- Root cause analysis
- A free trial or a demo system that enables an assessment without paying
- A system that offers value for money by providing comprehensive monitoring at a fair price
Using this set of criteria, we looked for a range of synthetic monitoring services that are offered by both cloud-based and on-premises solutions.
1. Site24x7 Synthetic Monitoring (FREE TRIAL)

Site24x7 operates its Synthetic Monitoring service from 110 data centers around the world. Its services include both Ping-based tests and browser-based synthetics to provide uptime, response time, and transaction monitoring systems.
Key Features:
- Cloud-Based: 110 test launch locations
- Part of a Full Stack Observability Package: Includes network, server, and infrastructure monitoring
- Web Code Scanning: Code profiling
Why do we recommend it?
Site24x7 Synthetic Monitoring is one of the modules on the Site24x7 cloud platform. This tool logs site availability and also response times for different elements on a Web page. The service provides tests for related systems, such as DNS records, SSL certificates, and supporting services such as CSS and JavaScript.
The Synthetic Monitoring service is part of the Site24x7 Website Monitoring package. This package includes a number of site checks, which include an SSL certificate monitor, a DNS monitor, and a domain expiry monitor. There is also a system to check the code of a site for errors, called the Website Defacement Monitor. Response time monitoring includes statistics on DNS fetch times, connection establishment times, first byte arrival time, download time, and SSL handshake time.
Who is it recommended for?
The base Website Monitoring plan of Site24x7 is very affordable. It provides 120 test launch sites and a good mix of services, which include network monitoring. This is great for small businesses with small websites and larger concerns can pay for more capacity. There are four plan levels for Website Monitoring.
Pros:
- Instant Root Cause Analysis: Alerts at all levels of the stack show which failure set all the others off
- Real User Monitoring is Also Available: A companion module included in the plan
- Free Tools: DNS checker, Ping availability tester, SSL certificate monitoring, among other utilities
Cons:
- No Self-Hosting Option: Only available from the cloud
There is a free version of the Site24x7 Website Monitoring package, which is limited to monitoring up to five websites. There are four paid plans: Starter, Pro, Classic, and Enterprise. Starter, the cheapest plan, includes the ability to monitor up to ten websites. You can get a 30-day free trial for any of the four paid plans.
2. ManageEngine Applications Manager (FREE TRIAL)

ManageEngine Applications Manager offers a complete set of software and service monitoring tools that includes synthetic transaction monitoring. This service lets you set up walk-throughs of your website that activate new features. You can get to try out many different input combinations to ensure that new systems integrated into your pages are working correctly.
Key Features:
- On-Premises for Windows Server and Linux: Also available on AWS and Azure
- Performance Alerts: Get notified if a site is slow or unavailable
- Live Performance Graphs: Customize a screen to see all your vital metrics together
Why do we recommend it?
ManageEngine Applications Manager provides application discovery and an application dependency mapping system for applications, services, and server resources. The package also offers synthetic t4stingt for websites. This tool includes availability tests, load speed reports, and transaction testing for interactive elements. It will identify third-party elements that are slow or faulty.
The Applications Manager integrates many levels of website performance monitoring. It is possible to run tests from a number of locations around the world. This opens up the option of just running availability checks or full regional location detection tests that show how the site adapts to access from key markets.
You can assemble scripts by recording actions from your offices, then load up that script onto a test server in a different location and let it run through the site. Tests can be performed periodically, so it is possible to let the Applications Manager’s synthetic transaction monitoring service perform all of your testing for you while you get on with other tasks. An alerting mechanism in the testing system will bring you back to the console if problems are detected.
The statuses of all tests are shown live in the dashboard of the Applications Manager and each action and it results are written to log files. Test data is available for sorting and filtering and you can assemble presentations and reports from results to share finding with other stakeholders.
Who is it recommended for?
Any website owner would benefit from using this package. The synthetic monitoring tools provide automated checks to ensure that all live systems are working properly and the transaction tests are suitable for ensuring that new elements operate well before putting them live. The application monitor will keep an eye on your Web server.
Pros:
- Autodiscovery for Applications: Creates an application dependency map
- Monitors Servers and Middleware: You will be able to see if server resource shortages are causing problems
- Offers Real-Time Synthetic Monitoring: Automated API and browser-based tests
Cons:
- No SaaS Option: No mechanism to test from different locations
ManageEngine Applications Manager is available in three editions – all of them are available for installation on Windows Server or Linux. The Professional edition includes comprehensive software management tools for one site and the Enterprise plan covers many sites. There is a limited version of the Professional version that is the Free edition. You can get a 30-day free trial of either of the paid plans.
3. Datadog Synthetic Monitoring
Datadog is a cloud service that monitors website performance from several locations around the world with synthetics. Uptime checks work with TCP requests, which enable them to check on DNS servers and SSL certificates at the same time. The service also includes an HTTP-based check to ensure that a web server is not only operating but that it can locate and deliver the pages of your site.
Key Features:
- Cloud-Based: A SaaS package
- Graphical Data Visualizations: Customizable screens
- Live Performance Reports: Get notified when a site goes down
- Development Testing: Record and play back a walkthrough
- Option to Connect to Distributed Tracing: Code profiling is also available
Why do we recommend it?
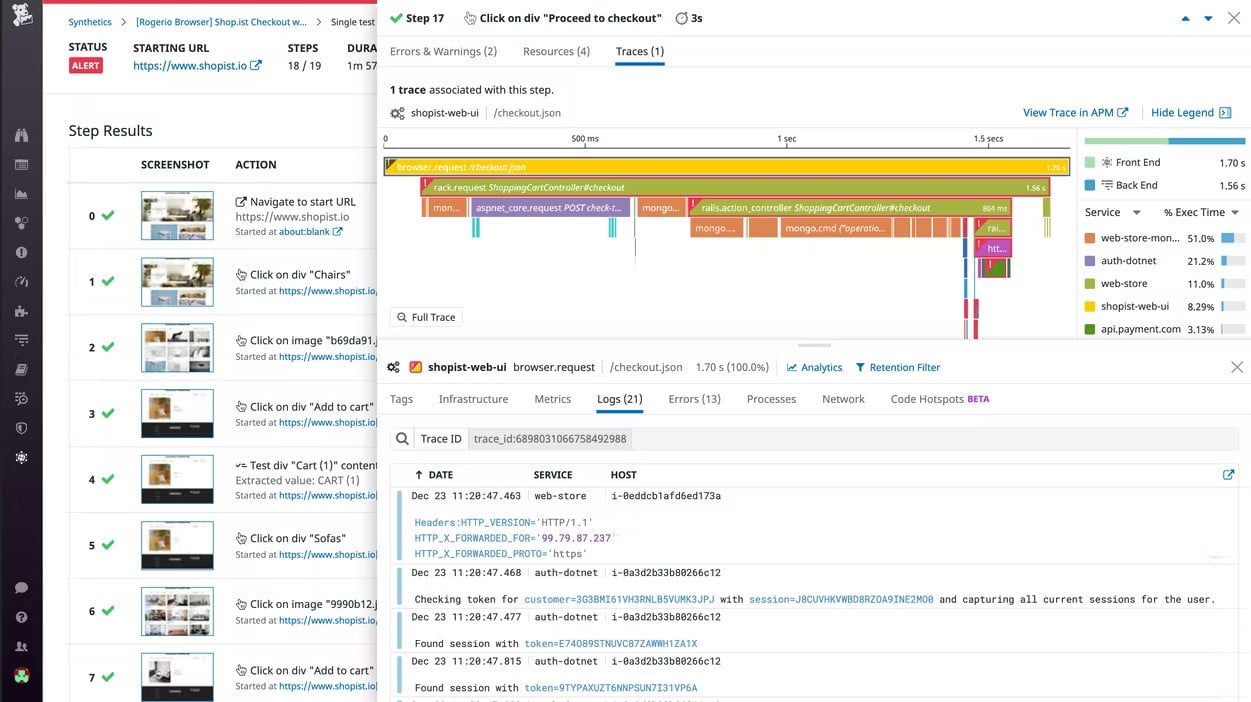
Datadog Synthetic Monitoring offers two types of automated testing services: API-based tests and browser-based tests. The browser-based tests are considerably more expensive than the API tests. Each test type has different launch methods. The API service is a standard test, such as Ping, while the browser-based tests are recorded walk-throughs of a site.
Transaction monitoring with Datadog launches browser-based tests, following an action script. The results of each run are displayed as a waterfall graphic that makes the performance of each service that gets triggered by the action clearly. It is easy to see from this visualization which elements are slow and whether any services failed. Datadog also includes an automated transaction testing service that is based on AI machine learning. It explores all of the interactive elements in a page and tests them in combination.
The test launcher for the Synthetic Monitoring package lets you decide on the test launch location so you can track performance as seen by site visitors in different parts of the world. There is also an option to integrate synthetic testing into a CI/CD pipeline for DevOps environments.
Datadog is presented as a series of modules – of which the Synthetic Monitoring package is one – and complimentary units slot together to add greater value. For example, the Datadog Application Performance Monitor includes a distributed tracing function and a code profiler. These services fit together well with the Synthetic Monitoring package for businesses that need to check on the root cause of Web app performance impairment.
Who is it recommended for?
Given the big price difference between the two types of tests, you would use them in different ways. The API tests are usually set to run repeatedly as an availability monitoring service. The browser-based system is usually used to check interactive elements in a Web page before releasing it.
Pros:
- Response Time Monitoring: Includes details for page elements
- DNS Server Testing: Records availability and response times
- SSL Certificate and Domain Registration Monitoring: Warns when expiry approaches
- A Choice of Test Types: API or browser-based
- Tests Interactive Elements: Cycles through a list of possible inputs
Cons:
- No Self-Hosting Option: Only available on the cloud
A subscription for programmatic tests cost $5 per month per thousand test runs and browser-based test cost $12 per month per thousand.
4. SolarWinds Web Performance Monitor

If you are more interested in a monitoring tool that you can install on one of your own servers and run in-house, the SolarWinds Web Performance Monitor is probably your best option. This monitoring system is able to perform constant availability checks on all of your websites.
Key Features:
- On-Premises Package: Runs on Windows Server
- Render Times: Page load speed
- Live Response Graphs: See availability over time
Why do we recommend it?
The SolarWinds Web Performance Monitor is an on-premises software package for Windows Server. This system provides both synthetic monitoring tools and real user monitoring mechanisms. The synthetic monitoring tool range from availability testing to translation tests that probe interactive features in a Web page. These can be run on a schedule.
The SolarWinds Performance Monitor includes synthetic monitoring and real user monitoring tools and there is no per-transaction charge, so you can run tests as often as you like without worrying about the cost.
The highest frequency available for uptime monitoring is five minutes. Those availability checks continue around the clock and any failed connection attempts provoke alerts and a status report, logging the total downtime period. The transaction monitoring and response time testing functions of the software include a drill-down root cause analysis tool to help you fix performance issues quickly.
Response time testing covers a very detailed list of services and events as they render in a browser. This produces a list of load times that are tracked over time, so a one-off infrastructure problem doesn’t make you think that there is a long-term serious problem.
Who is it recommended for?
Although it is very usual those days to get a website monitoring service from a cloud platform, those subscription-based plans can end up being really expensive. Repetitive tests, although individually cheap can rack up large invoices when applied at high frequencies. The SolarWinds system only incurs a one-time payment.
Pros:
- Supports Root Cause Analysis: Identify why performance dropped
- Customizable Screens: Uses drag and drop widgets
- Assisted Setup: Offers a wide range of integrations, templates, and alert options
Cons:
- No Real User Monitoring Service: You will need another tool to track live performance
SolarWinds offers the Web Performance Monitor on a 30-day free trial. The software for this system installs on Windows Server.
5. Pingdom Synthetic Monitoring
Pingdom Synthetic Monitoring is a cloud service that operates from more than 100 data centers around the world. As the service’s name suggests, its creation was based on the application of Ping to test the availability of servers. Ping can operate across networks or the Internet and it is the Internet’s performance that is the particular focus of Pingdom.
Key Features:
- Cloud-Based: 100 test launch locations
- Choice of Test Methods: API or browser-based
- Performance Alerts: Notifications if a site goes down or is slow to respond
- Alert Forwarding: Receive notifications by email or SMS
Why do we recommend it?
Pingdom Synthetic Monitoring is a cloud-based website testing service that offers services such as availability testing up to transaction monitoring and real user monitoring. The price difference between these different types of monitoring tools is vast, so you use them in different ways. The straightforward availability test is the cheapest and transaction testing is the most expensive.
Ping is very widely used for website availability monitors and it is a synthetic monitoring technique. Pingdom is more than just Ping, however, because it runs a range of tests from a selection of remote sites to examine load times and transaction performance on Web pages.
The Pingdom Synthetic Monitoring service bundles together uptime, response time, and transaction monitoring, giving the subscriber the option of choosing how many of each type of test to run every month. Uptime monitoring is offered at ten times the quantity of advanced tests in each package. The advanced test category covers response time and web transaction monitoring.
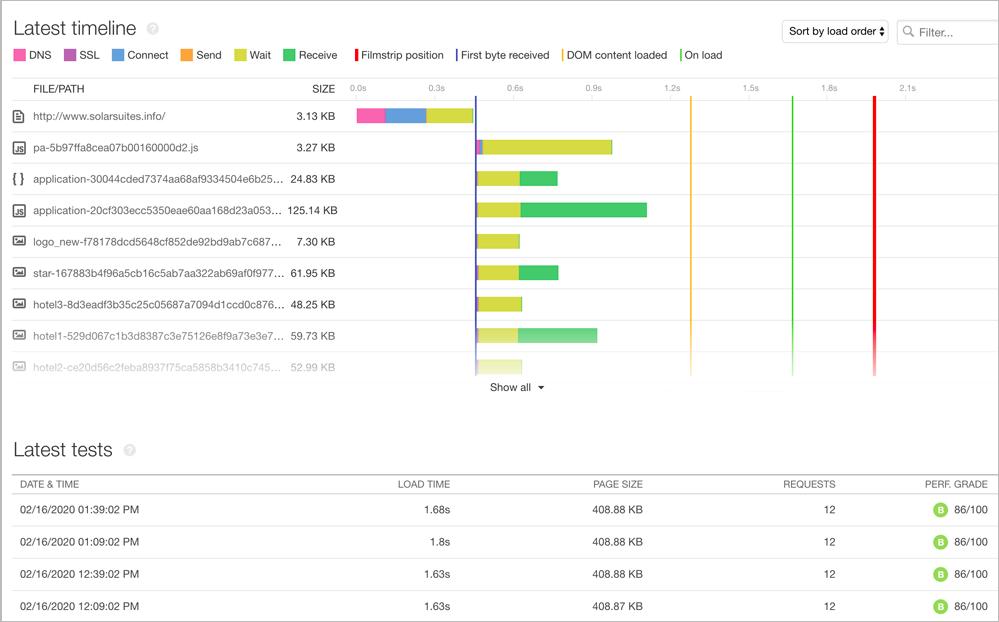
Features in the Pingdom package include downtime alerts that notify you when your website is uncontactable and logs the downtime periods. A Timeline Metrics screen in the dashboard ranks page elements by lag time so you can see which features are dragging down the performance of your Web pages. The Transaction Monitoring screen allows users to set up test scripts that walk through user tasks in a site.
Who is it recommended for?
Any business that runs websites will need the full range of services offered by Pingdom. The availability tests can be set to run periodically and raise an alert if the test fails. You would use transaction testing to test a new feature and Real User Monitoring for market testing.
Pros:
- Access Through a Web Browser: The dashboard is accessible from anywhere
- Identify Service Bottlenecks: Find the cause of slow load times
- Test Third-Party Plug-Ins: Check systems such as authentication services and checkout processes
- Monitor SLA Delivery: Record underperforming services to support a claim on a guarantee
Cons:
- No Infrastructure Monitoring: You will need another tool to monitor delivery systems
Pingdom also offers a Real User Monitoring service.
Pingdom is great for synthetic monitoring because it operates from 100 locations worldwide. So, you will know immediately if your site becomes unavailable in one part of the world even though it seems to be working fine when accessed from your offices. An alerting and logging mechanism in the service means that you don’t have to constantly watch the monitor, but you will be informed as soon as problems arise. Response time monitoring and transaction monitoring features mean that you can examine the performance of every element on every page of your site, not just the overall availability of the website.
6. Sematext Synthetics

Sematext Synthetics is a package of active monitoring tools that launch tests against your Web pages to assess their delivery performance. This is a cloud-based service and its tests can be launched from a list of locations – you choose which tests you want to run and where from. The location option allows you to simultaneously check on the delivery of your site to visitors in different parts of the world.
Key Features:
- Uptime Monitoring: Provides page load speeds
- SSL Certificate Checks: Warns of approaching expiry
- DNS Testing: Availability, response times, and accuracy
Why do we recommend it?
Sematext Synthetics is a cloud-based service that implements treat-based monitoring of websites and their SSL certificates. The tool provides standard availability tests that can be run constantly and alert when a test fails. It can also give you load speeds and checks for interactive elements in a page through transaction testing.
The tests provided by Sematext Synthetics also offer repeated checks on-site services, such as SSL certificates, DNS records, and protocol performance. The tests can be performed with an HTTP transmission or through automated browser-based action. It is also possible to choose the specific hardware that the tests are run from, such as a Samsung Galaxy phone. Test results are stored as metrics and screenshots and you can choose to vary the frequency of test launches to suit your budget. If a test fails, you will receive an alert via Slack message, Webhooks, or email.
Who is it recommended for?
Sematext provides two price options. One is a pay-as-you-go rate and the other is a pre-paid monthly allowance of a number of monitors. It doesn’t count the frequency of tests, so, for example, if you pay for one monitor, that isn’t one Ping, but a recursive Ping to one target.
Pros:
- Eight Test Launch Locations: Check performance from different parts of the world
- Choice of Test Frequency: Be aware that you can run down your allowance
- Verification of a Failed Test Before Notification: Prevents false reporting in the event of a system glitch
Cons:
- Very Frequent Tests can Rack Up Charges: Keep an eye on your allowance
Sematext offers two charging structures. One is a Pay-as-you-Go plan, which is a metered service and the other option is a subscription with advanced payment. There are two subscription plans, which offer different facilities and are charged at a rate according to the data retention period you choose for test results and the number of tests that you want per month. Be aware that if you run through your test allowance, the whole service stops unless you pay a supplement. You can get a 14-day free trial of either of the subscription plans.
7. Uptime.com
Uptime.com offers a package of synthetic monitoring and real user monitoring services that are available in two editions. Each subscription is a pre-paid credit for a specific number of tests of each type, which you use up through the month.
Key Features:
- Cloud-Hosted: 15 test launch locations
- Fault Verification: Checks again before alerting
- Live Performance Graphs: Customizable dashboard
Why do we recommend it?
Uptime.com provides a range of test types to check on the successful operations of websites. The list of services that you get from an Uptime.com package is the same as the tests that you can get from other systems on this list, such as Pingdom. However, the charging structure is different.
Tests can be launched from servers in 15 different locations around the globe. It is possible to set up uptime checks to run continuously on network assets and email systems as well as websites and Web applications. Availability reports can be linked to an alerting mechanism that will send out notifications to key staff members should an asset go offline. The records of the automated synthetic monitoring tests are logged and can be automatically matched to SLA expectations. This service is suitable for use by both providers and customers of Web services.
The two plans of Uptime.com are called Essential and Premium. The Premium edition offers a multi-tenant option, which is suitable for use by managed service providers (MSPs) that are tasked with monitoring Web assets on behalf of clients. Packages also include real user monitoring services and a combination of synthetic and real user monitoring creates an efficient strategy for ensuring performance is at a suitable level.
Synthetic monitoring tests can be used for development testing in a CI/CD pipeline and the Uptime.com system can integrate into project management and team notification systems, such as Pagerduty and Slack.
Who is it recommended for?
The structure of the Uptime.com plans is interesting because it doesn’t give you a number of tests per month but gives you a number of types of tests that it will set to run repeatedly. The only type of monitoring that is metered is the Real User Monitoring category. You would need to calculate your needs to work out which of the services on this list is more affordable.
Pros:
- SSL Certificate and Domain Registration Tracking: Warns when expiry approaches
- Email Server Availability Testing: IMAP and POP
- Supports Multi-Tenant Features: Suitable for managed service providers
Cons:
- Two-Week Free Trial: Could benefit from a longer trial time
Uptime.com’s Premium edition is available for a 21-day free trial.
8. Paessler PRTG
Paessler PRTG is a package of many monitors for networks, servers, and applications. Each monitor is called a “sensor” and there are some that specialize in website monitoring. The most important of these are the HTTP Sensor, the HTTP Transaction Sensor, and the HTTP Full Web Page Sensor.
Key Features:
- Deployment Options: On-premises for Windows Server or a SaaS platform
- HTTP-Based Tests: Monitor a domain or a specific page
- Customizable Alerts: Receive notifications by email or SMS
Why do we recommend it?
Paessler PRTG is an on-premises package that monitors networks, servers, and applications. It offers a number of sensors that relate to website availability. These are called HTTP sensors and they can provide information on load times and transaction tests as well as regular availability tests.
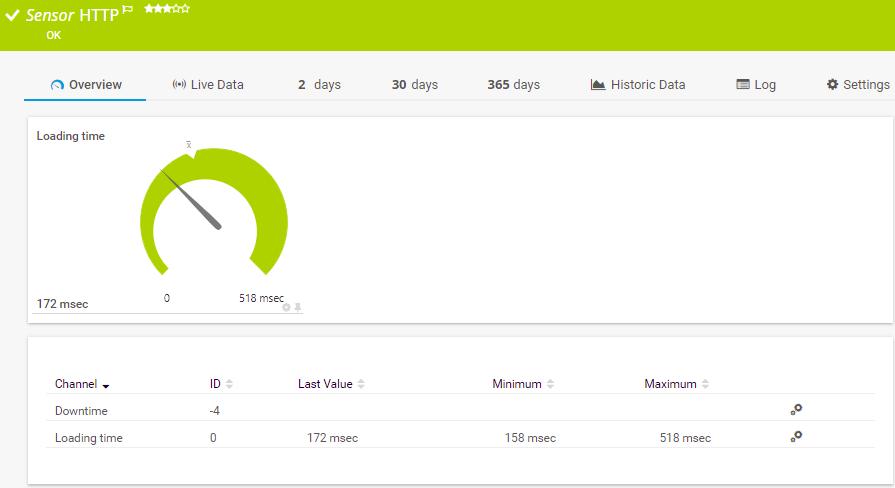
The HTTP Sensor is an uptime monitor that tests DNS services as well as server availability. The HTTP Transaction Sensor is a web performance monitor that runs action scripts on a Web page through a browser. The HTTP Full Web Page Sensor is a response time monitor that reports on the load times of different elements in a web site.
Who is it recommended for?
PRTG is available as a software package for installation on Windows Server and it is also offered as a SaaS platform. Buyers pay for an allowance of sensors and then decide which of the available monitors to turn on. If you only activate 100, you never have to pay.
Pros:
- Record and Replay Walkthroughs: Test interactive elements
- Not Metered: Run as many tests as you like without fear of racking up the bill
- Free Plan: Provides 100 sensors
Cons:
- Browser-Based Tests for Chrome and Internet Explorer: Not Firefox, Microsoft Edge, Opera, or Brave
Paessler PRTG installs on Windows Server and it is offered on a 30-day free trial. This trial has no limit on the number of sensors that can be activated. So, it gives you an opportunity to try each available monitor and work out exactly which monitors you really need. When you buy the software, its price is levied according to the number of sensors to be activated.
9. Google PageSpeed Insights
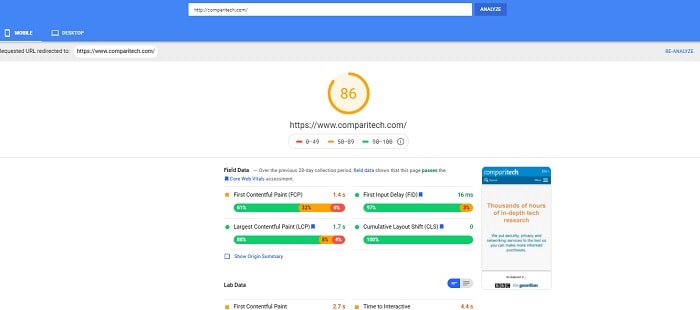
PageSpeed Insights is a free service from Google that lets anyone see the response time statistics. The service is very easy to use. It is presented as a website and the user just needs to enter the address of a Web page in the home page’s only data entry field.
Key Features:
- Free Online Service: A very professional testing service
- On-Demand Tests: No continuous testing options
- Page Rendering Statistics: Provides a score
Why do we recommend it?
Google PageSpeed Insights is a Web-based tool that is free to use. The system will test the performance of any website, not just our own. Its scoring future helps you assess any recent changes you made to improve your site’s performance and the results page also gives you tips on improvements.
The service produces very detailed results and gives the page an overall score for response times. Score ranges are color-coded as bad, okay, or good. Below the overall score, the user sees a list of different response times from the examined page. Below that, the service recommends improvements that could improve the response times of the page. Two tabs at the top of the results section switch between results for responses on desktop computers and responses on mobile devices.
Who is it recommended for?
This tool is free to use and worth a try. It is an on-demand system and you can’t compare results over time automatically. However, you can download the report that the service generates and look at them in progression to see how you have improvised your site’s performance.
Pros:
- Tests from Multiple Platforms: Launches from mobile devices as well as browsers
- Detailed Rendering Stats: Compares to the responses of other sites and pages
- Offers Next Steps: Guides to improve your response time and overall page speed
Cons:
- Not a Replacement for Continuous Monitoring: Although it is a nice on-demand assessor
This is an excellent tool for those who want to analyze a web page. However, this is an on-demand response time monitor so it won’t help you to check on your website automatically.
Synthetic monitoring tools FAQs
What is synthetic monitoring tool?
Synthetic monitoring is implemented by tests rather than passive data gathering – this is why this form of system monitoring is called “active monitoring.” Synthetic monitoring services range from recursive Ping runs to more complicated services that operate through browsers. The main target of a synthetic monitoring system is a website to assess its performance with respect to response times and the first appearance of important features in each page. Options to look out for in synthetic monitoring services are the ability to launch tests from different locations around the world and confirmation tests before alerts are raised.
What is synthetic monitoring example?
Most frequently, synthetic monitoring tools are used to monitor the performance of websites. Some metrics that are specific to Web page delivery include the time it takes to load a page in a browser or the time until a key feature, such as the banner, an advert, or an image appears in a loading page. Synthetic monitoring tools for these metrics are usually run through actual Web browsers and some services give you a range of browsers to choose from. Mobile apps can also be tested with services that offer specific makes and models of devices to run tests from.
What is synthetic performance monitoring?
The most widely used type of synthetic performance monitoring is the availability test. This is performed with Ping on a loop so administrators can know immediately if a server fails to respond. Ping monitoring can be used to test the performance of a wide range of IT assets, not just Web servers. For example, a recursive Ping is often found at the core of many network performance monitors and it can also be used to test the availability of specific applications on a corporate application server or cloud platform. Ping can be used to test the connection to a target across the internet, so it is also often used to check on connection speeds to monitor the delivery of internet services. This is useful for SLA enforcement.
