
Monitoring your application is crucial for ensuring that it performs optimally, remains secure, and delivers a seamless user experience. Applications are the backbone of many businesses, serving as critical tools for customer engagement, data processing, and operational efficiency. However, even the most well-designed applications can experience performance issues, security vulnerabilities, and downtime.
Application performance issues can significantly impact user satisfaction and business operations. Effective application monitoring helps organizations identify and address these issues proactively before they escalate into major problems.
The importance of monitoring extends beyond just uptime and functionality. Monitoring provides real-time visibility into how your application is performing under different conditions, such as varying traffic loads or system updates. By tracking key performance metrics, such as response times, error rates, and resource utilization, businesses can quickly detect any abnormalities and resolve them before they negatively affect the user experience.
Application monitoring is particularly important for applications that handle sensitive data or are critical to business continuity. In these cases, even brief periods of downtime can lead to financial losses or reputational damage.
In addition to performance monitoring, application monitoring is essential for maintaining security. Regularly monitoring user activity, access logs, and system vulnerabilities helps detect potential security breaches, unauthorized access, or malicious behavior. This proactive approach is vital for protecting sensitive data and ensuring compliance with regulations like GDPR or HIPAA.
Moreover, monitoring provides valuable insights into user behavior and system efficiency, enabling businesses to make informed decisions for improving features, optimizing performance, and enhancing the overall user experience. Ultimately, application monitoring is an essential practice for maintaining the health, security, and success of any application in today’s competitive and ever-evolving digital landscape.
Here is our list of the top application monitoring systems:
- ManageEngine Applications Manager EDITORS’ CHOICE This package traces all the supporting modules for your user-facing applications, builds a map of those dependencies, and monitors the performance of every element. Available for Windows Server, Linux, Azure, and AWS. Start a 30-day free trial.
- Site24x7 Application Performance Monitoring (FREE TRIAL) This cloud-based package provides distributed tracing, code profiling, synthetic monitoring, and real user monitoring. Start a 30-day free trial.
- Datadog APM A SaaS platform that offers its APM with or without a code profiler. Get dependency mapping, root cause analysis, and distributed tracing.
- Dynatrace Full-stack Monitoring This AI-based SaaS package offers infrastructure and application monitoring plus digital business analytics
- New Relic An innovative and extensive SaaS platform with 16 monitoring packages all included in the price.
- AppOptics This SaaS platform links together infrastructure and application monitoring to provide full dependency mapping and root cause analysis. This package includes distributed tracing and code profiling.
The purposes of application monitoring
Trying to work out why an application has stopped working is the most complicated task in IT operations. As they are at the top of the stack, applications rely on the smooth running of supporting services and hardware. So, although it might seem that there is a problem with your applications, the real problem might lie elsewhere. If your applications stop working, you have to investigate your entire IT system to work out why.
There are two main benefits to applications monitoring:
- To head off performance issues
- To identify system dependencies
Systems never seize up for no reason and a problem usually evolves rather than suddenly appearing. There are times when a sudden performance issue with an application is the result of a service problem that has been building over time – lack of storage space on a server is one example.
Therefore, it is important to get a monitoring system that can lay down tracks that ease investigations if something goes wrong – this is called root cause analysis. You also need to watch out for gradual degradation in performance that can reach a point where the deterioration is noticeable – this observation task is implemented by constant automated applications monitoring.
Application monitoring obligations
Applications are services to others, whether the uses are within the business, other businesses, or members of the public. Therefore, if an application doesn’t perform well, you are letting people down. That can be disappointing, but if your application delivery is subject to a contract in the form of a service level agreement (SLA), that performance issue can end up costing you a lot of money.
Poor application performance causes long-term reputational damage as well as an immediate financial or opportunity cost. The business for which you run the IT system has a level of expectation that requires the applications you support to be constantly available during business hours and possibly even around the clock.
Application monitoring delivery models
Application monitoring needs to be centralized – you don’t want technicians to have to log into each server to see the activities of the applications that they host. If your application is intended for use by outsiders, then an application monitoring system that accesses the services across the internet more accurately models the working conditions of your system than an internal monitoring package.
There are two hosting options for application monitors – on-premises and cloud-based. As self-hosted centralized monitoring services rely on data transmitted across a network, there isn’t much logical difference between the way that on-site and cloud-based application monitoring tools operate – traveling across the internet is as straightforward as transfers over the network.
Whether the application monitoring system is a SaaS package or a self-hosted system, it will need the ability to monitor hybrid environments. That means that on-premises systems will also need to be able to monitor remote and cloud-based modules. SaaS packages need to be able to examine the delivery systems that operate on your local network as well as other cloud-based services.
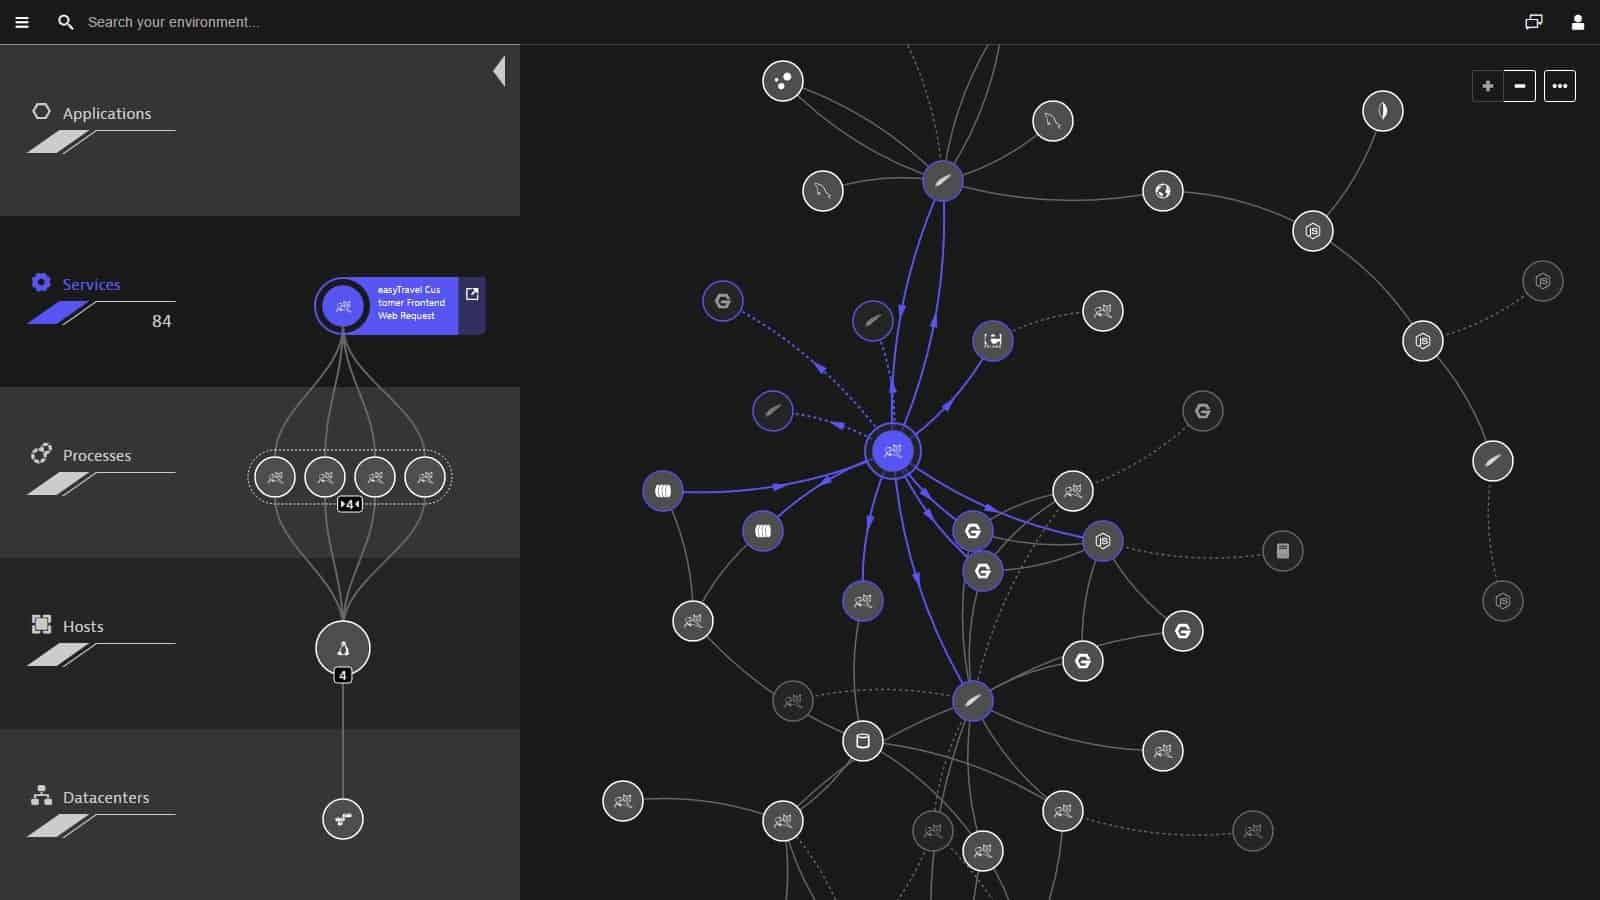
Application dependency mapping
Just listing the applications that you know you use in the interface of a monitoring tool isn’t going to get you sufficient monitoring services for the modern IT environment. An autodiscovery function is now essential because it enables an application monitoring tool to set itself up and it also reveals the applications and services that you use without knowing.
Applications are built up in layers and link through to other applications, which, in turn, rely on server resources. For example, consider a website. If it carries advertising that is delivered through a content delivery network (CDN), there is already a service that influences the load times of your Web pages that you might not have considered. If the site is built in WordPress and includes plug-in services, such as a shopping cart, more elements need to be monitored. The site might be based on a database and it will be dependent on a Web server application.
All of the contributing modules that build up a user-facing application need to be traced and their relationships mapped. Drilling down further, you need to consider the servers that host those contributing modules and the specific resources and services of those servers that support the applications that run beneath the applications that your users interact with.
Poor server performance or connection issues between servers could be the real reason for performance problems with your applications, So, discovering exactly where those servers are and which application modules they support is essential if you are ever going to solve a performance issue in your applications.
Microservices and mobile offloading
If you run mobile apps for access to your business’s services, you probably employ a lot of microservices. Those serverless systems might have been written in-house, they might have been written specifically for your business by a Web application consultancy, or they might be white-labeled third-party tools that you subscribe to and brand. Probably, they are a combination of all those categories.
Development toolkits now speed up the creation of Web applications by providing standard functionality, such as element drag-and-drop, picklist management, and so on. All of those functions get triggered every time a user clicks on a feature in your site or taps or swipes something in your mobile app. All of these functions need to be traced, mapped, and monitored.
Distributed tracing and code profiling
The supporting APIs and plug-ins that make Web application programming so easy and the content delivery networks and content management systems that keep all of your sites efficient have a downside when it comes to monitoring.
Your application monitoring tool can’t catch log messages if the applications don’t generate them and as these systems are built by other people and run on servers that you don’t control, you have no method to force internal reporting out of application modules.
Fortunately, many Web systems are written in plain-text programming languages and so application monitors can scan through the code as it passes from a Web server to a Web browser. This technique is called code profiling and it is becoming an increasingly important service that needs to be included in your application monitoring strategy.
Another recent solution to the new problems of monitoring third-party microservices comes from telemetry systems. Fortunately, the providers of serverless systems recognize that monitoring is important for the smooth running of their products, and they integrate messaging into their programs that output progress reports according to industry standards. OpenTracing, OpenCensus, and OpenTelemetry are three universal standards that have been widely implemented.
The messages that are generated through telemetry systems are picked up by monitoring tools that are called distributed tracing services. So, the addition of code profiling and distributed tracing resolves the problems of monitoring third-party microservices; application dependency mapping identifies where those systems are and how they contribute to the applications that you run.
Application performance monitoring systems
Now you understand that it is important to monitor your applications, you need to work out how to do it. The short answer is automation. You can’t watch every module as it runs because those modules will be running many instances simultaneously and also operate in conjunction with many other modules. An automated application monitoring tool provides constant and consistent performance tracking.
A tool that can simultaneously generate and maintain an application dependency map is a great time saver and tools that offer hybrid monitoring capabilities will cover all of your requirements.
The Best Application Monitoring Systems
Our methodology for selecting an application monitoring system
We reviewed the market for application monitoring systems and analyzed tools based on the following criteria:
- Automatic discovery
- Application dependency mapping
- Monitoring for hybrid systems
- Distributed tracing for microservices
- Code profiling for Web applications
- A free trial or a demo package that enables a no-cost assessment
- Value for money is represented by a full mapping, tracing, and monitoring tool that is offered at a reasonable price
With these selection criteria in mind, we identified excellent application monitoring services that keep up with the latest technology and provide predictive warnings to head off disaster.
1. ManageEngine Applications Manager (FREE TRIAL)
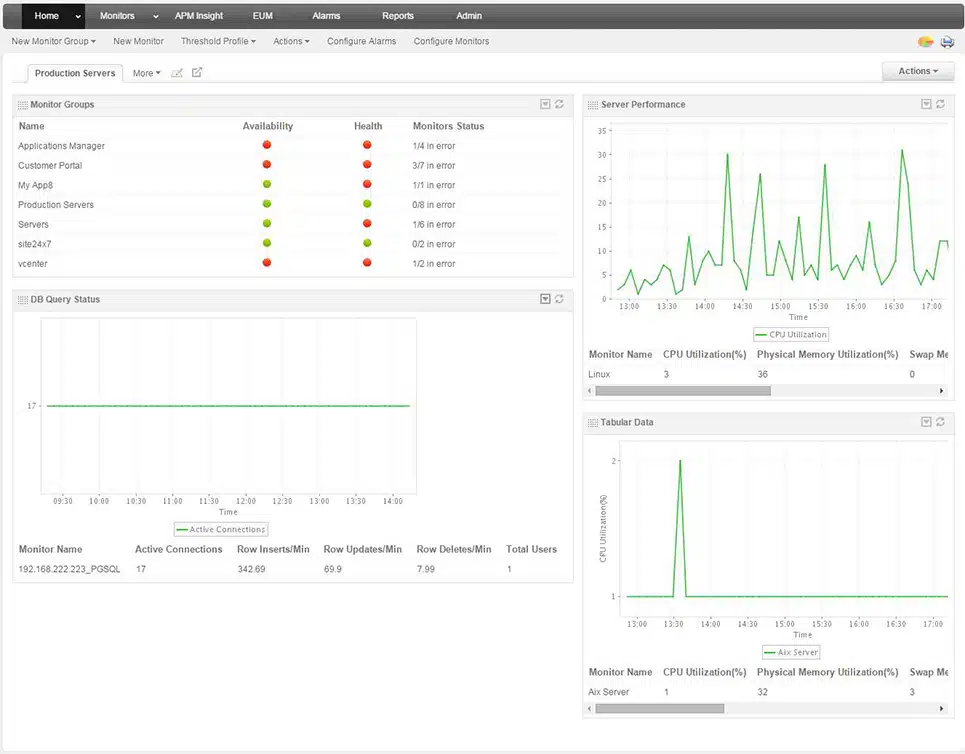
ManageEngine Applications Manager is a software package that is able to trace all of the supporting modules that contribute to a user-facing system. These applications could be standalone software packages, elements in websites, or even the Web applications that your company develops.
The Applications Manager tracks each element of an application no matter where it is run, which means your software might be dependent on a function that is executed on another server, owned by someone else. The service uses a system called distributed tracing to gather operational statistics from each module as it executes. If the system is written in a plain text programming language, such as Java, .NET, Ruby, Python, or PHP, the Applications Manager will even step through the code as it runs and identify the current line when a problem occurs.
Key Features:
- Application dependency mapping
- Distributed tracing
- Code profiling
- Root cause analysis
The tracking function of Applications Manager means that the monitoring tool knows exactly which module behind your user-facing apps was running at the time that a problem occurred. This means that as soon as a performance issue arises, you can pinpoint the issue straight away. This gives you the opportunity to assess whether the error was caused by a software coding error or a physical resource shortage.
The module monitoring system is a useful tool for development teams as well as for operations technicians. It enables managers to assess plug-ins and APIs before fully integrating them into a new application and acceptance testing can assure that the new code is fault free. The package includes synthetic monitoring tools to verify new code and real user monitoring to watch over performance once a Web application is live.
Pros:
- Useful for module verification before development
- Synthetic monitoring for unit testing
- Ongoing Web applications monitoring
- Monitoring for services and server resources
Cons:
- Not a SaaS package
ManageEngine Applications Manager is available in three editions. The first of these is Free, which is limited to monitoring five resources. The Professional edition is the base package for the paid system and the Enterprise edition has a greater capacity to meet the needs of large corporations. The software for all three editions runs on Windows Server or Linux. It is also possible to access the system as a service on AWS or Azure. You can get a 30-day free trial of either the Professional or Enterprise edition and if decide not to buy at the end of that period, your software switches over to the Free edition of the Applications Manager.
2. Site24x7 (FREE TRIAL)
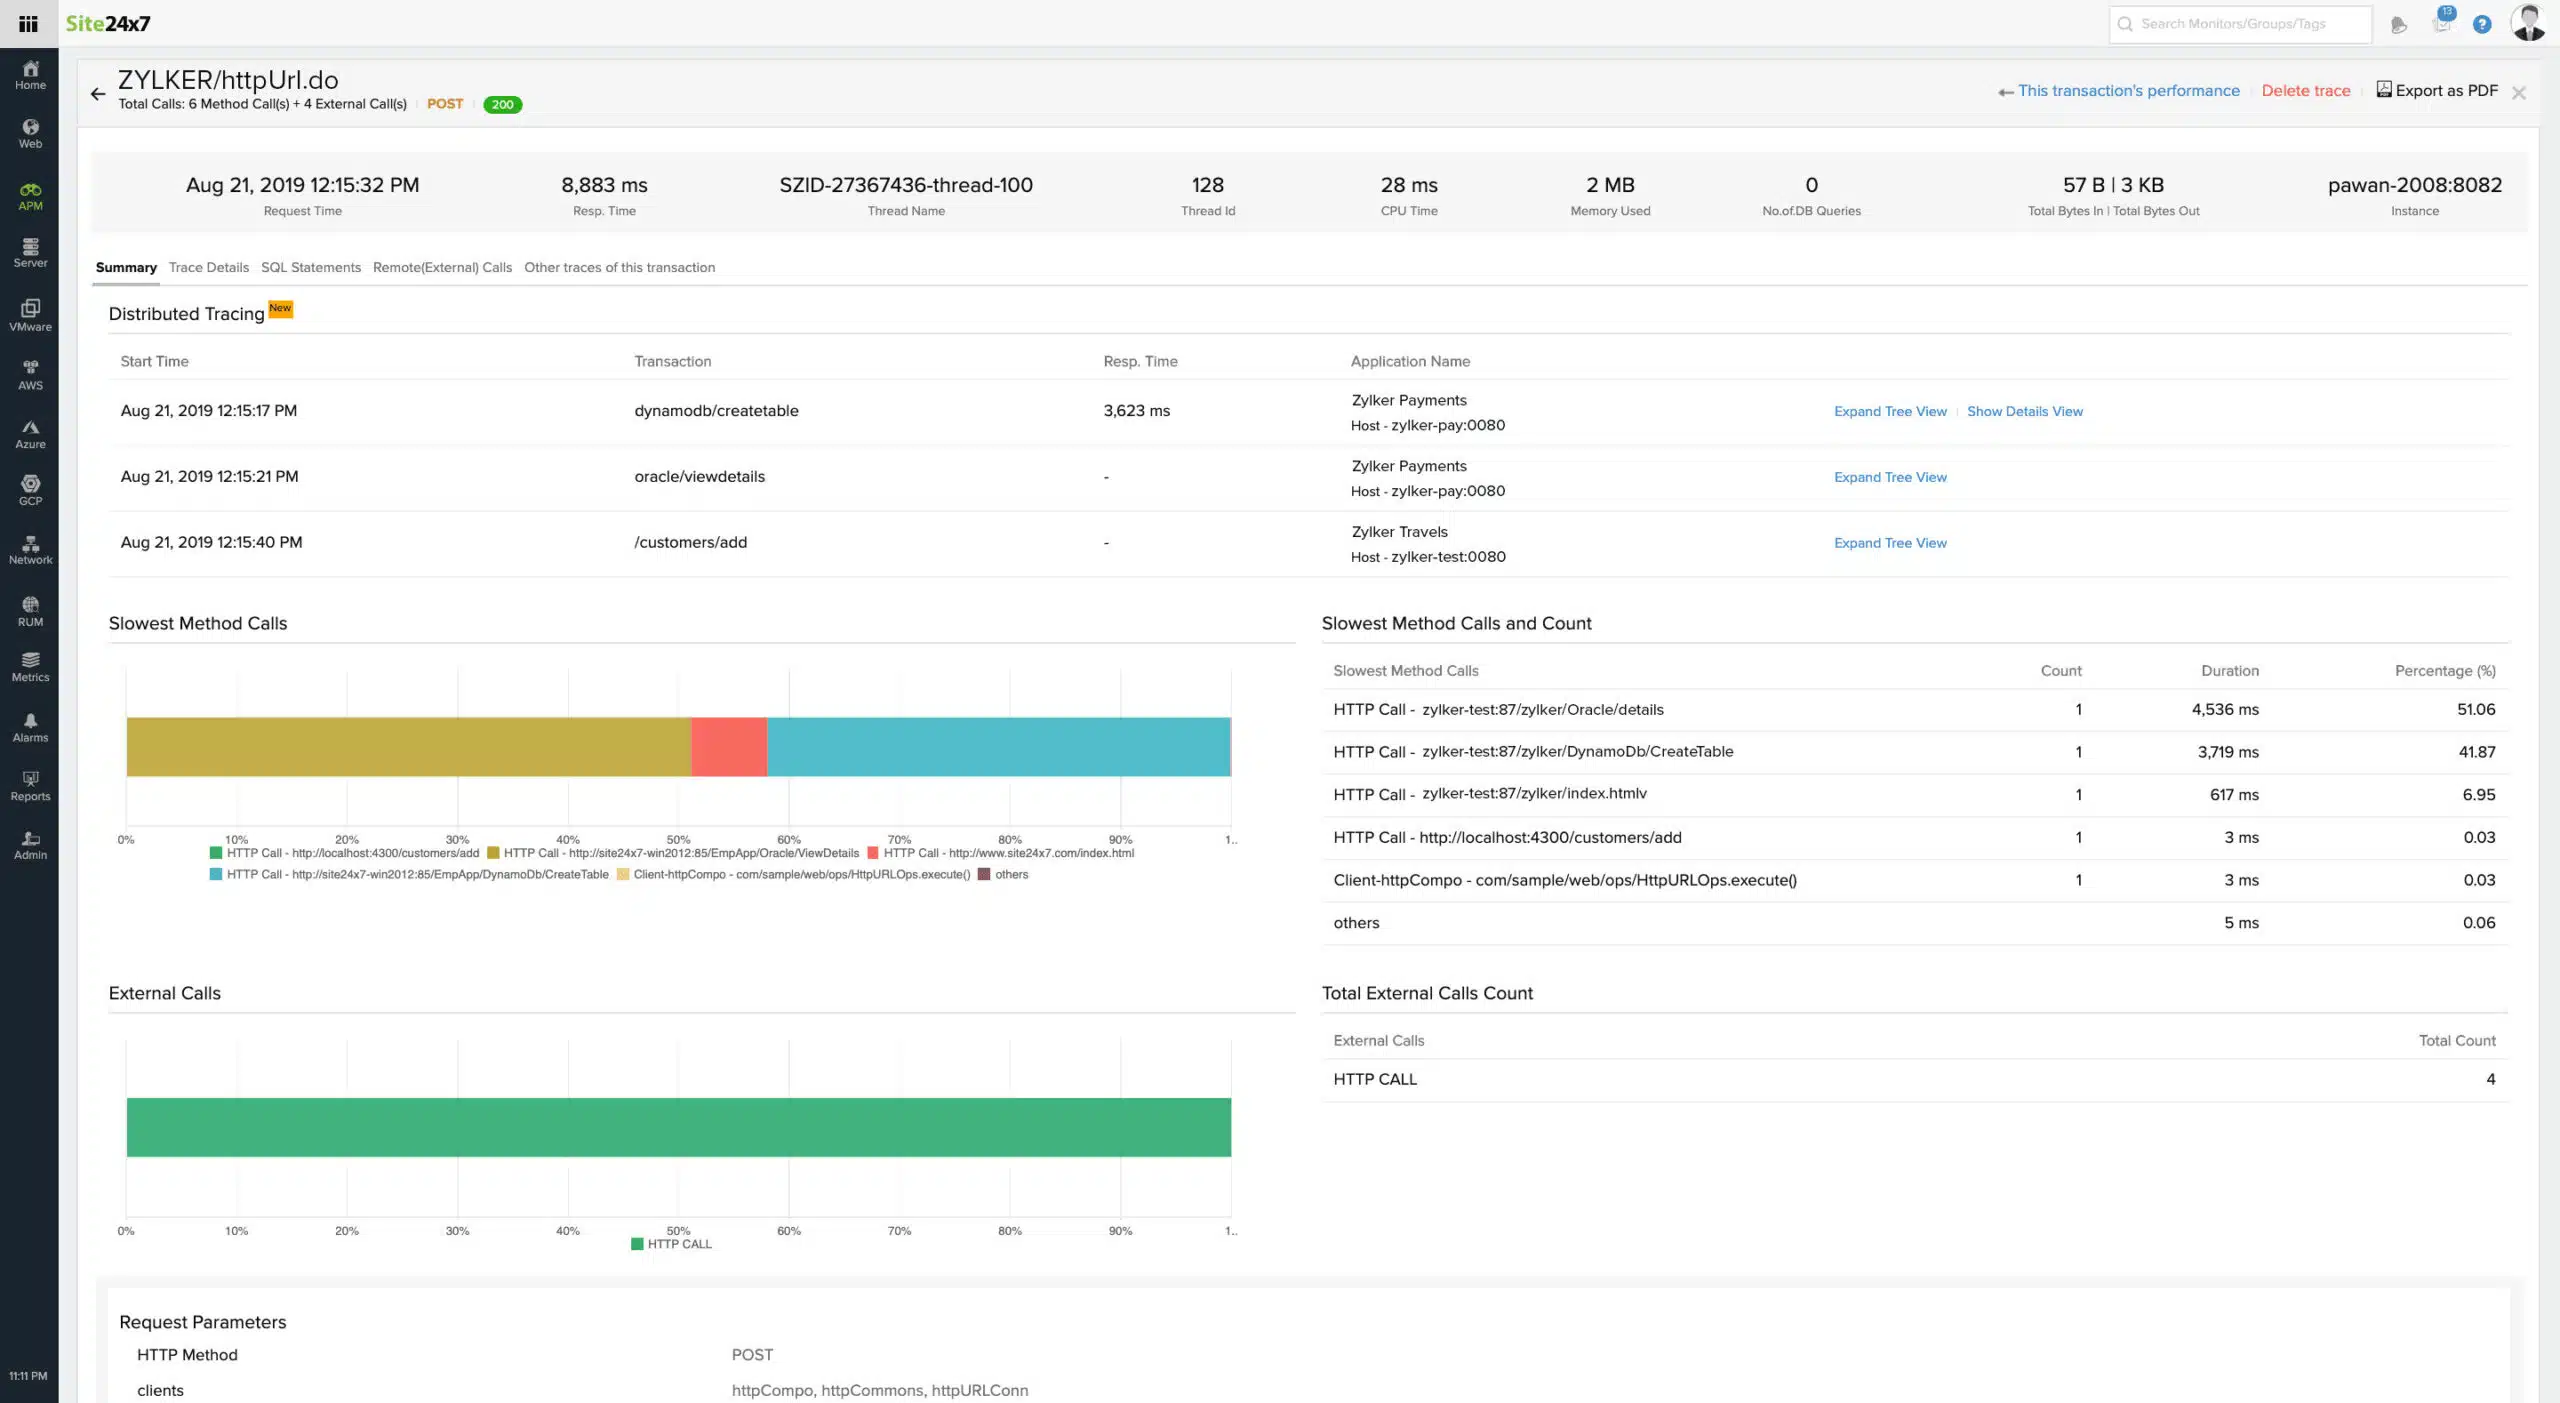
Site24x7 Application Performance Monitoring is delivered from the cloud and it is able to monitor systems hosted on cloud platforms as well as those run on-premises. The service is particularly useful for tracking the activities of Web applications, such as websites, mobile apps, and microservices. The package also includes server and network monitoring systems to provide full-stack observability for root cause analysis.
Key Features:
- Application discovery
- Application dependency mapping
- Distributed tracing
This package gives you the tools to monitor traditional infrastructure applications, such as databases and email systems as well as serverless-based microservices for Web applications. The tool identifies the links between different functions, which could be hosted on third-party servers and delivered as subscription services. This forms an application dependency map, which allows performance to be logged on the entire bundle as well as for each individual element.
The APM includes a facility for tracking the performance of the third-party components that you can’t break into. This is a distributed tracing function that lets you identify problems within a package even though you can see into it. You get a code profiler to step through text-based scripting languages that are visible.
The system discovery and application dependency mapping service gives you real-time tracking of complete Web systems and it also gives you instant root cause analysis when problems arise. Graphs of live activity in the dashboards are supplemented by stored metrics for historical analysis that supports long-term capacity planning as well as immediate troubleshooting.
Pros:
- APM functions for Web applications
- Monitoring for networks, servers, services, and applications for full-stack observability
- Additional synthetic and real user monitoring tools for website performance tracking
Cons:
- Base packages provide minimal capacity and need to be bumped up with paid expansions
The Site24x7 platform is suitable for tracking Web applications alongside hosted, on-premises assets and its application dependency mapping provides predictive alerts, so that your team can head off problems before the users notice that something is wrong. You can assess the Site24x7 APM with a 30-day free trial.
3. Datadog APM
Datadog APM is delivered from a cloud platform of system monitoring and management tools. The Datadog team is very active and is evolving its systems constantly. The APM system is now very heavily based on distributed tracing and the tracking of Web application performance. Much of the traditional application performance monitoring that used to be part of the APM has been moved into the Infrastructure module.
If you need application monitoring for systems such as databases or Web servers, you will find that functionality in the Infrastructure Monitoring tool. The best solution is to get both the Infrastructure and the APM system. Add on Network Monitoring and you have full stack observability.
Key Features:
- Autodiscovery
- Dependency mapping
- Service Catalog
- Distributed tracing
As well as performing distributed tracing and application dependency mapping, the Datadog APM has a deployment tracking feature. This is great for businesses that create their applications or combine third-party systems and need to trial different environment settings before fully rolling out the service.
Code Profiling is offered in a higher plan that still gets you the standard APM features. This will scan through code written in Java, .NET, PHP, Node.js, Ruby, Python, Go, or C++ as it runs.
Pros:
- Application dependency mapping that can link through to infrastructure
- Optional code profiler
- Data retention for historical analysis
- Alerts for performance problems
Cons:
- Many application monitoring services have been shifted to a separate module
You sign up for the Datadog system at the service’s website and access its console through any standard Web browser. You can get a 14-day free trial of the entire platform, which will help you to decide exactly which modules you need to subscribe to.
4. Dynatrace Full-stack Monitoring
Dynatrace is a SaaS platform with a list of modules. Accessing the Full-stack Monitoring package gets you infrastructure monitoring as well as the APM. You also get AlOps features that can predict resource shortages and potential access clashes.
Key Features:
- Dependency mapping down to the server
- Distributed tracing and code profiling
- AI-based root cause analysis
The Dynatrace platform also offers security monitoring and digital experience monitoring. As it is a SaaS package, the Dynatrace Full-stack monitoring stores all of its gathered metrics for manual historical analysis. It also gathers system logs and stores those for examination. The distributed tracing and code profiling services in the bundle also generate their log files that contribute to the analytical pool.
Pros:
- Suitable for development and operations support
- Mixes a range of observability strategies
- Provides predictive alerts for resource issues
Cons:
- Full log management costs extra
5. New Relic
New Relic delivers “full stack” observability in its SaaS package because it has everything from application discovery, dependency mapping, distributed tracing, real-time code profiling, and infrastructure monitoring. The service goes on to provide network monitoring, container, and virtualization tracking, plus machine learning for its alerting system.
Key Features:
- Application dependency mapping
- Full-stack observability down to the network
- A complete system monitoring package
The New Relic service is priced per user and not per server, so its full range of services is available equally to the smallest business as well as to very large organizations. The service offers a bug tracker, plus synthetic web application testing for operations teams. You are allowed one user account for free forever, which is useful for assessment.
Pros:
- AI-driven application scanning
- Predictive alerts
- Data retention for analysis
Cons:
- All of the functions take a lot of training to exploit
6. AppOptics

AppOptics is a cloud platform that offers two modules. The first of these is the Infrastructure Monitoring service. This provides monitoring for on-premises and cloud servers, plus virtualizations and containers. The service identifies all of the systems that support your primary applications.
The second module of the AppOptics system is Application Monitoring. In this package, you get distributed tracing and code profiling. You need both modules to fully track the performance of your applications and fortunately, the top plan of AppOptics provides just that.
Key Features:
- Hybrid systems
- Distributed tracing
- Code profiling
- Server cloud platform
- Virtualizations and containers
Applications can be built up from modules written in different languages and developed on different platforms. This results in a kaleidoscope of code that many APMs can’t cope with.
AppOptics can trace through systems written on Java Virtual Machine (JVM), .NET, and WCF it understands PHP, Python, Ruby, and Node.js. The monitor automatically detects the system in which each segment was written and adjusts its scanning techniques as it progresses through the code.
This service will discover your applications and their underlying services, creating a dependency map and providing continuous monitoring with a range of techniques. The console has a series of performance expectation thresholds, which you can adjust and add to. These automate application monitoring because you don’t have to sit and watch the console on the off-chance that something bad might happen – you’ll be notified if it does.
Pros:
- A SaaS platform with storage for metrics
- Application dependency mapping with root cause analysis
- Performance tracking down to server and cloud platform resource availability
- Distributed tracing and code profiling
- Alerts for automated, unattended monitoring
Cons:
- Doesn’t include network monitoring

