Effective monitoring and management of network infrastructure, applications, and services is essential to maintain performance, prevent downtime, and ensure a seamless user experience. With increasingly complex and distributed IT environments, choosing the right monitoring solution has become critical for organizations.
Two widely adopted platforms for network and infrastructure monitoring are Zabbix and Datadog, each offering robust capabilities to track, analyze, and troubleshoot IT assets.
Zabbix is an open-source solution that excels in flexibility and scalability. It provides real-time insights into networks, servers, and applications by collecting and analyzing performance data. Users can customize dashboards, configure alerting systems, and integrate with third-party tools to suit their specific needs. While Zabbix is cost-effective due to its open-source nature, it may require more hands-on setup and ongoing maintenance compared to commercial alternatives.
Datadog, on the other hand, is a cloud-based platform tailored for modern, dynamic infrastructures. It offers real-time monitoring across a wide range of technologies, including cloud services, containers, and microservices. With native integrations for providers like AWS, Azure, and Google Cloud, Datadog is particularly suited for organizations operating in cloud-centric environments. The platform also includes advanced analytics, machine learning capabilities, and intuitive visualizations to help teams quickly identify and resolve performance issues.
This guide compares Zabbix and Datadog in terms of features, scalability, pricing, and usability. By examining the strengths and differences of each platform, organizations can make an informed decision and select the monitoring solution that best fits their infrastructure and operational needs.
Overview of Zabbix
Zabbix is an enterprise-class distributed monitoring solution designed to monitor and track the performance and availability of IT infrastructure, including networks, servers, applications, virtual machines (VMs), and cloud services in real-time. The company was established in 2005 in Latvia, with offices now spread across Europe, the USA, Japan, Russia, and Latin America. It was named the 2020 Customers’ Choice on Gartner Peer Insights for IT Infrastructure Monitoring Tools. Zabbix is open source and comes at no cost. However, customers are required to pay for professional technical support. Zabbix provides five different support tiers to cater to the various needs of customers. This is to ensure that every customer finds a support level that meets their requirements.
Zabbix monitors and reports key performance metrics such as network utilization, CPU load, and disk space consumption; it enables users to collect, analyze, visualize, and receive notifications regarding impending issues.
Zabbix key features include:
- Metric collection Collects metrics from multiple sources using an agent and agent-based methods.
- Problem detection Automatically detects problem states within the incoming metric flow and performs root cause analysis and trend prediction.
- Visualization and reporting The native web interface provides multiple ways of presenting a visual overview of your IT environment, such as widget-based dashboards, graphs, network maps, slideshows, and drill-down reports
- Notification and remediation Notifies responsible persons about occurring events using many different channels and options.
- Security and authentication Supports strong encryption between all Zabbix components and multiple authentication methods such as Open LDAP and Active Directory.
- Auto-discovery Periodically scans the network to discover devices and takes predefined actions.
- Distribution monitoring Build distributed monitoring solution while keeping centralized control
- Extensibility Gain access to all Zabbix functionality from external applications through Zabbix API.
Zabbix can run on-premise or in the cloud and is scalable to any infrastructure–from intelligent home to multi-tenant enterprise environments. It can monitor Linux and Windows environments, but the software runs mainly on Linux and other Unix-like operating systems (Linux, Solaris, Mac OS/X, etc.).
Pros:
- Open-source transparent tool
- Uses both SNMP and ICMP for a broader monitoring range
- Can detect new devices and configuration changes immediately
- Offers useful templates for quick insights
- Robust notification system supports SMS, email, custom script, and webhook
Cons:
- The interface isn’t as intuitive as solutions such as DataDog or Site24x7
- Would like to see better-alerting features, specifically related to reducing false positives
Overview of Datadog
Datadog is an agent-based on-prem and cloud infrastructure monitoring service for cloud applications, servers, databases, tools, and services. It’s headquartered in New York and has Boston, Dublin, Paris, Singapore, Sydney, essential network protocols, and Tokyo.
Datadog was named a Leader in the 2021 Gartner Magic Quadrant for Application Performance Monitoring. It provides developers and IT operations teams real-time visibility into all technology infrastructure through a single visual interface. Datadog uses its auto-discovery service to explore and identify devices in your network. The outcome of the auto-discovery service is then used to create a device inventory, which forms an index for the complete monitoring service.
Datadog’s key features include:
- Network monitoring Allows companies to visualize traffic flow in cloud-native environments and analyze performance using meaningful, easy-to-understand tags.
- Application performance management Monitors, troubleshoots, and optimizes application performance.
- Log management Allows users to search, filter quickly, and analyze logs for troubleshooting and data analysis.
- Synthetics Synthetic tests proactively monitor end-to-end user experience with an intuitive web recorder.
- Alerts Companies can create custom alerts for any metric or performance problem. Notifications are available via email, PagerDuty, Slack, etc.
- Integrations The software integrates with multiple products and development stacks to aggregate metrics and events.
- Dashboards High-resolution interactive dashboards help companies monitor and graph real-time metrics and events.
- Collaboration Tools provide visibility across teams by letting users annotate changes, record problems, and communication, and discuss issues in context with production data.
- Application programming interface (API) API access helps companies observe apps and infrastructure by capturing events and metrics using client libraries.
Once all devices and links have been identified, you can overview all network activity from the Datadog dashboard. The service also draws up a network topology map that can be used to get quick insights into each node. Any changes to the network can be automatically spotted. This helps to adjust the network inventory and topology map without any human intervention. Traffic flow analysis features in the Datadog tool enable you to examine each device and link to discover total capacity and utilization. The analysis features let you see which applications or endpoints generate the most traffic on your network.
Pros:
- Offers numerous real user monitors via templates and widgets
- Can monitor both internally and externally giving network admins a holistic view of network performance and accessibility
- Changes made to the network are reflected in near real-time
- Allows businesses to scale their monitoring efforts reliably through flexible pricing options
Cons:
- Would like to see a longer trial period for testing
A free 14-day trial with full access to all the features is available for download. After that, the software is generally sold through monthly subscription plans based on hosts, events, or logs.
Zabbix Vs. Datadog: How They Compare
Systems Requirements, Installation, and Configuration
Zabbix runs on Linux with minimal resource requirements for a start (a minimum of 128MB of physical memory and 256MB of free disk space). This, of course, can grow exponentially depending on the number of hosts and parameters that are being monitored and how long you intend to keep a history of monitored parameters. In addition, little in-depth tech skills are needed to deploy Zabbix due to preconfigured virtual appliances for various virtualization platforms (such as VMware, VirtualBox, Hyper-V, Azure, etc.), ISOs, and out-of-the-box templates. This makes it easier to deploy Zabbix without committing to the entire installation and configuration process.
Since Datadog is a SaaS-based application, there are no on-premise system requirements and no installation hassles. However, you’ll be required to install local agents specific to the device or service you wish to monitor for the most part. An agent-based mode means no auto-discovery feature, so you have to deploy an agent for all your devices individually. Datadog supports integration with VMware vSphere, but the setup process is a bit complicated. That said, Datagod provides enough documentation and setup instructions to guide you through the installation and configuration process.
Dashboards and Visualizations
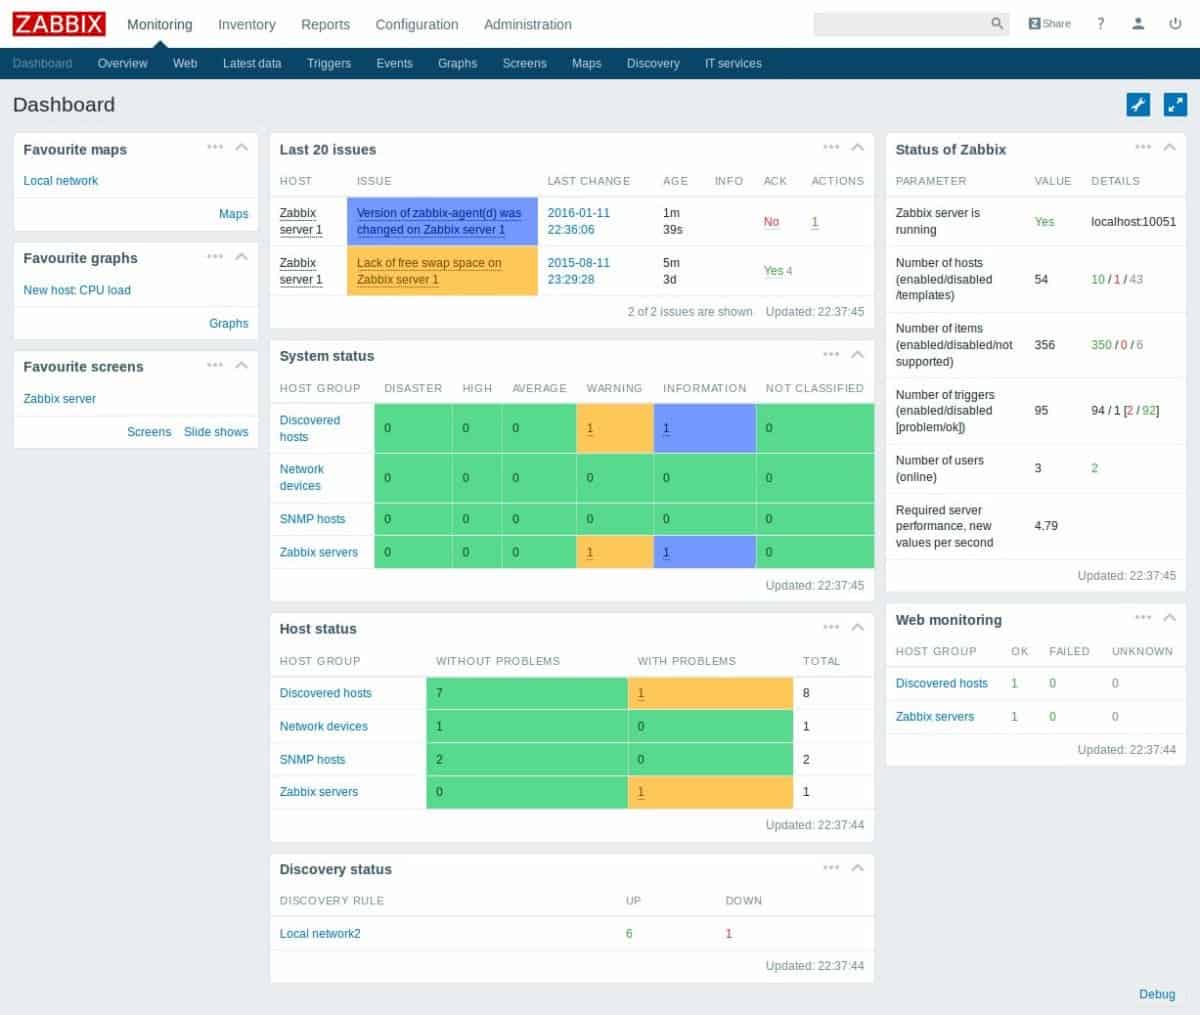
The Zabbix dashboard is entirely customizable and maintains a high-quality appearance. The management interface is crisp and comes with well-defined color-coded displays. In addition, Zabbix provides high-level personalized details about the monitored environment. While you may need some coding knowledge to get the most out of its design, it offers you a more customized experience than Datadog. In terms of overall user experience, usability, and design, Zabbix has a distinct advantage. The mix of modernity and a customizable design makes for a truly personalized monitoring experience.
Datadog is also aesthetically pleasing from a visual perspective with its clean and modern dashboard design. In addition, Datadog also allows you to customize your dashboards with a vast library of visualization tools and drag-and-drop widgets. But it requires a lot of setup work to get things working. But once you successfully get past this, you can easily visualize your data in two primary ways:
- Screenboards These are grid-based dashboards with free-form layouts that include images, tables, host maps, graphs, and logs. They are commonly used as status boards or storytelling views that update in real-time or represent fixed points in the past.
- Timeboards This represents a single point in time—fixed or real-time—across the entire dashboard. They are commonly used for troubleshooting, correlation, and general data exploration. In addition, you also get a time series that can plot any metric being captured from your hosts, such as CPU usage, uptime, or memory usage.
Alerts and Notifications
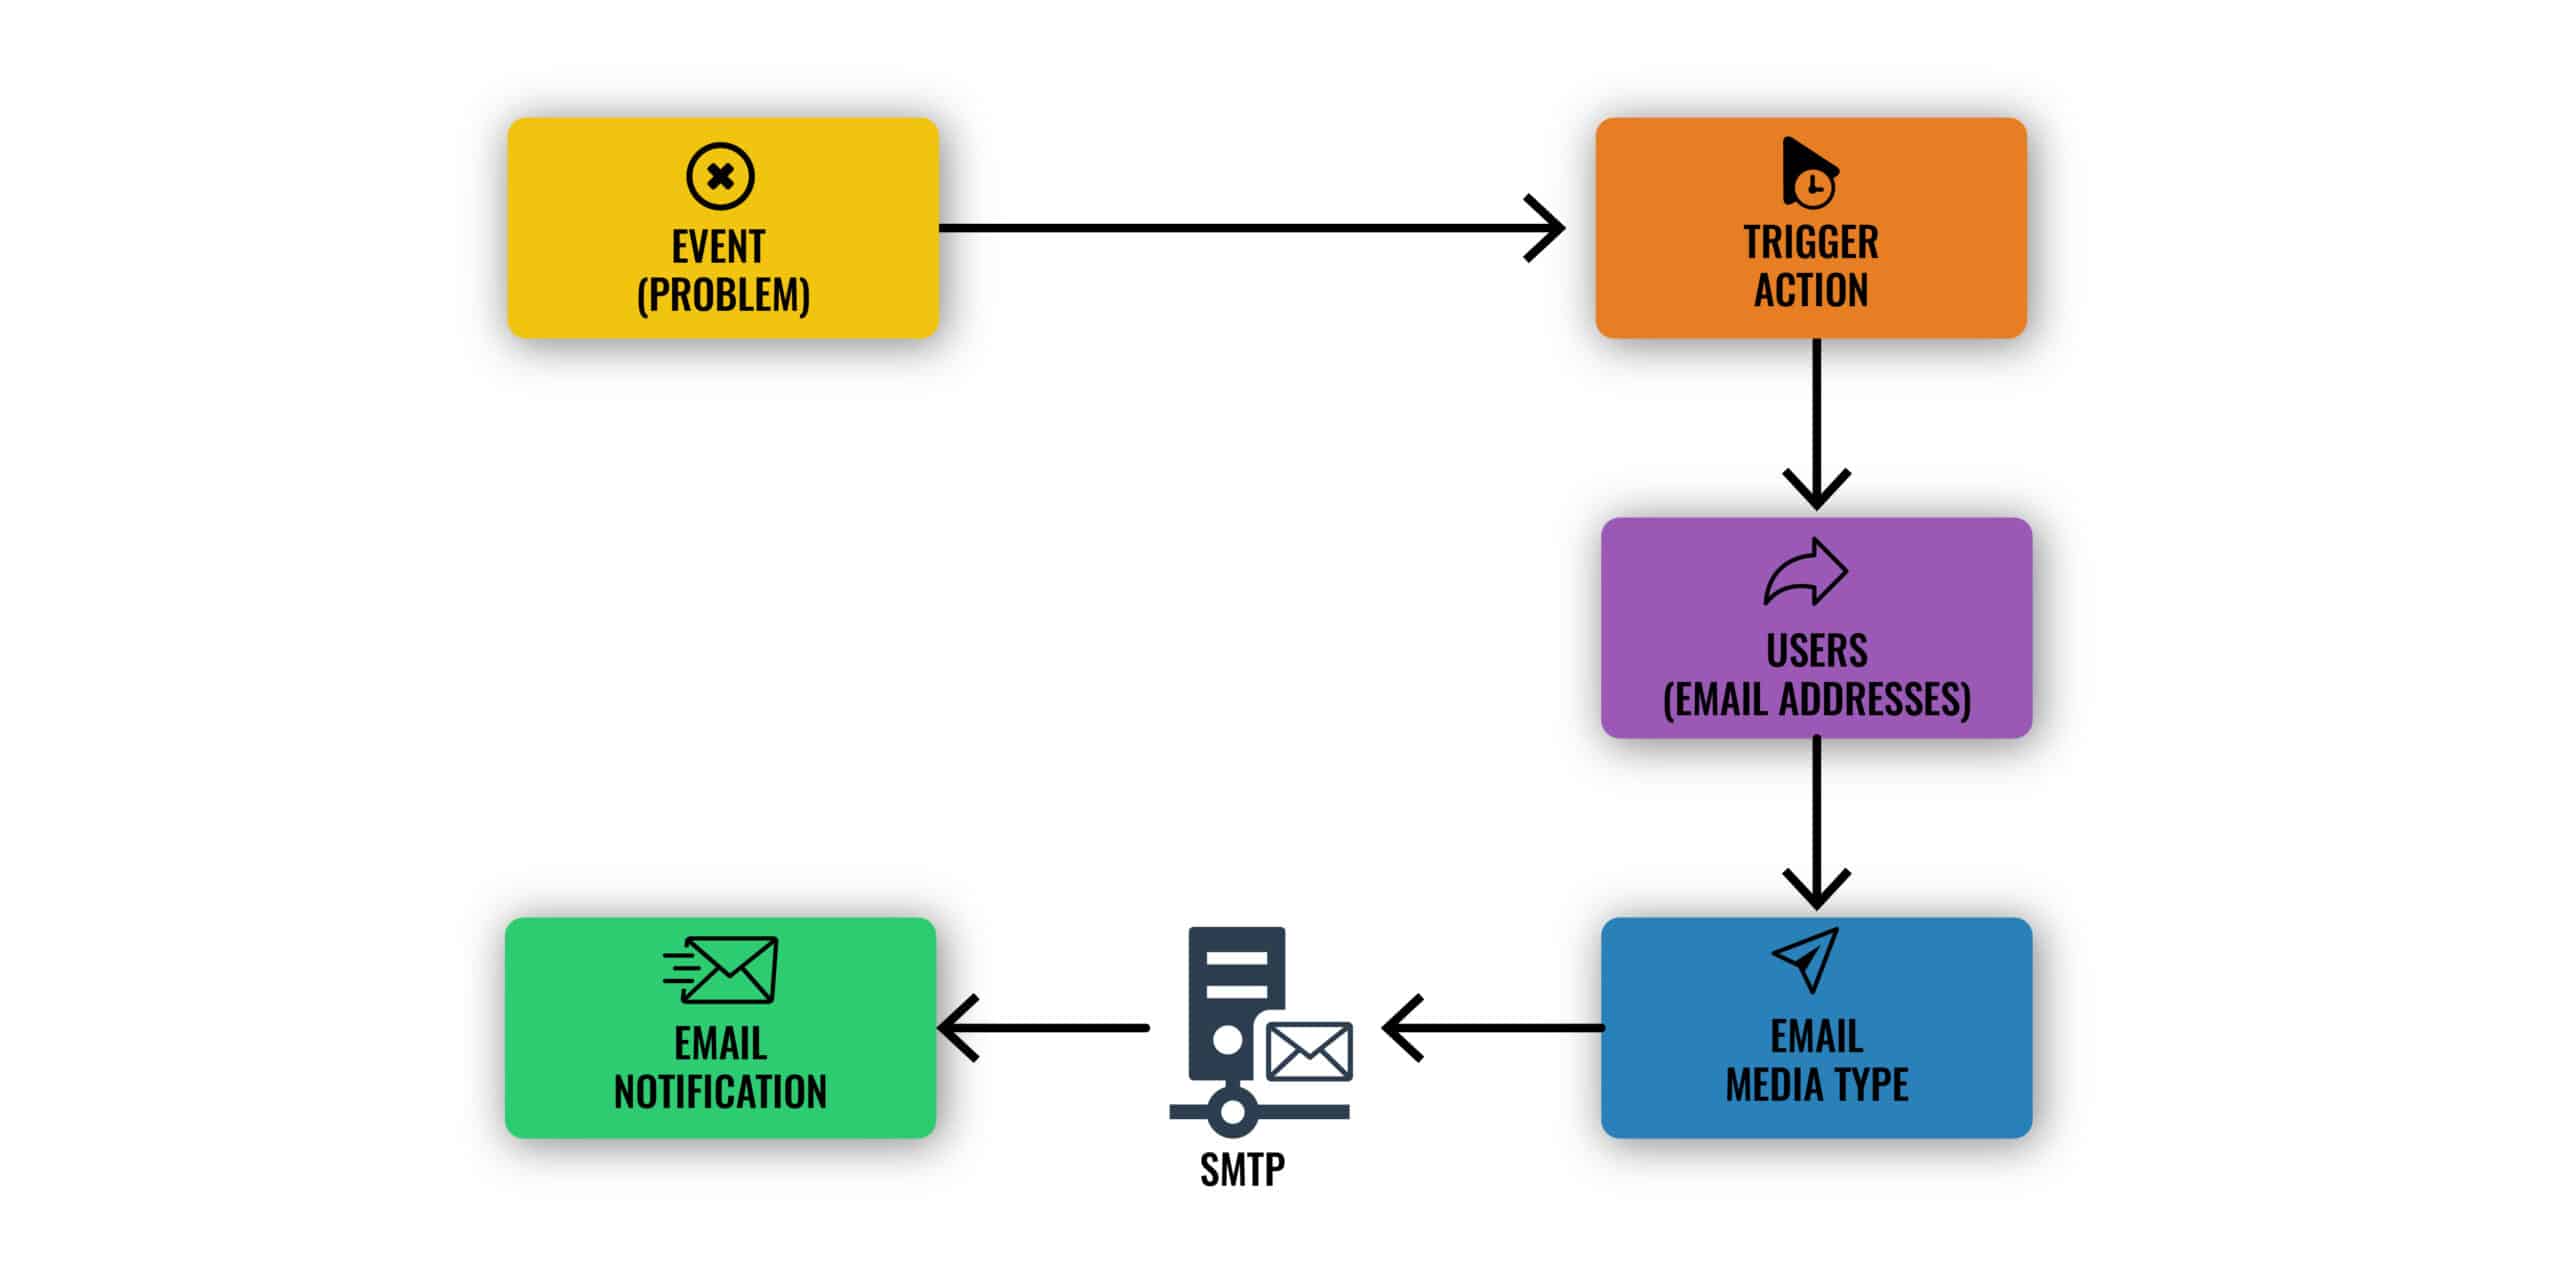
Email, SMS alert script, and webhook are the primary means of delivering alerts in Zabbix. The configuration process is quite simple, but it requires SMTP server information to get it working. Zabbix allows you to customize your message content. What gives Zabbix’s alerts system the edge is its automated escalation capabilities. If your initial message receives no response, then it will be sent to another recipient. If there is no response at the end of the chain, Zabbix will automatically execute actions assigned to each escalation step.
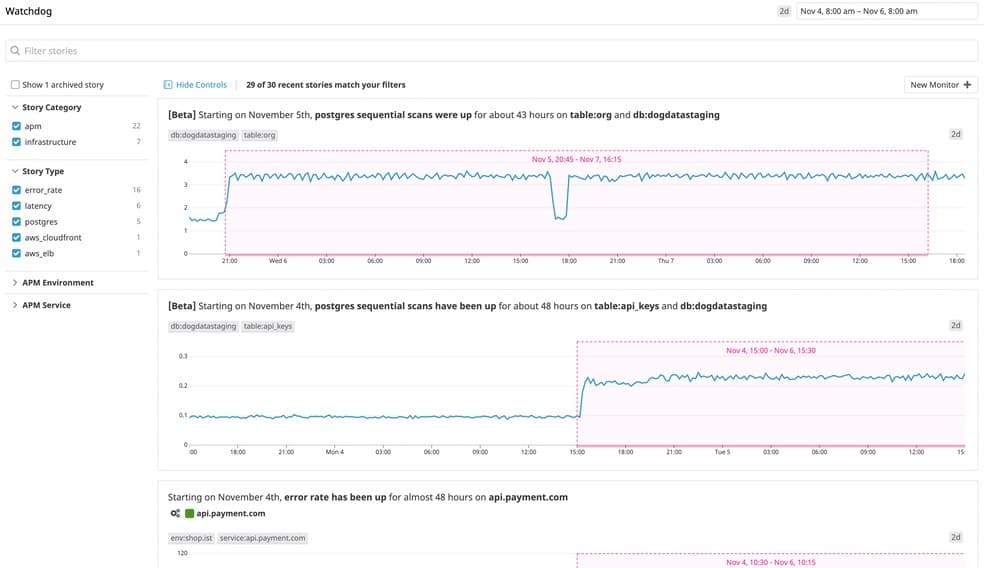
On the other hand, Datadog’s approach to alerts and notifications is based on machine learning (ML), which it calls Watchdog. Watchdog uses modern ML techniques to identify problems in your infrastructure, applications efficiently, and services and flag anomalies. Users can receive alerts and notifications using Pagerduty, Slack, and email. These can be based on nearly any metric that Datadog can capture. As a result, every alert is specific, actionable, and contextual—even in large and temporary environments. This unique approach to alerts and notifications makes Datadog stand out and helps to minimize downtime and prevents alert fatigue.
Reporting and APIs
Zabbix reporting is 100% based on dashboard widgets. Reports are generated out-of-the-box and use existing email to send out the reports (such as availability and trends report) in pdf formats. Zabbix also comes with a web API that provides access to almost all functions available in Zabbix. The web API also makes it possible to integrate Zabbix with third-party software and mobile applications. But in terms of extensibility, the real power of Zabbix comes from its support for plugins. Plugins provide an option to extend the monitoring capabilities of Zabbix. With this level of flexibility, there’s no limit to the monitoring capabilities of Zabbix.
Instead of generating the usual out-of-the-box reports that most network admins expect, the Datadog approach to reporting aims to make metrics easily searchable, and it does excellently. Although most network managers prefer the excellent old out-of-the-box PDF reports, not everybody needs them. Therefore, Datadog also comes equipped with an easy-to-use API that can significantly extend the range of what Datadog can track. The Datadog API is an HTTP REST API that can access the Datadog platform programmatically and returns JSON from all requests.
Licensing and Price Plans
Zabbix’s main competitive advantage is that the application is 100% free, so there are no subscription fees, licenses, or enterprise plans to pay for other than technical support services. You can enjoy all the benefits and features that come with Zabbix free of charge, with no strings attached. However, you would have to pay for regular professional technical support. This freemium pricing model can be a significant long-term saving for SMBs and organizations on tight budgets.
For Datadog, the pricing model is based on per server, per month, and it’s free for up to 5 hosts (with 1-day data retention). But some customers complain that it becomes costly at scale. As a result, Datadog is available in several different pricing tiers:
- The Network Performance tier Suitable for monitoring networks and systems for most small to midsize businesses.
- The Infrastructure tier Ideal for organizations that want to use the software as a centralized monitoring service for systems and services.
- The APM tier Designed for larger organizations looking to fix service and device-layer problems.
- Serverless tier Aimed at those looking to monitor network and application issues.
- Log Management tier Meant for companies with large amounts of log data to parse for context and retention.
- There are also different tiers for security, synthetic, and accurate user monitoring, each appropriate pricing for the core task.
All Datadog prices are billed annually, making it one of the most price-customizable management apps.
| Features | Zabbix | Datadog |
|---|---|---|
| Target market | SMB to large organizations and enterprises. | Developers, freelancers, IT operations teams, security engineers, and business users from SMB to large organizations in the cloud age. |
| Supported platform | Linux OS | Mac OS X, Windows, Linux, Online |
| Deployment model | On-premise or cloud | SaaS-based |
| Plugins and APIs calls | Web API and plugins | HTTP REST API |
| Support methods | Remote troubleshooting On-site visit On-site Training | Phone Online Knowledge base Video tutorials |
Table 1.0 | Comparison of Zabbix and Datadog key features
Concluding Remarks
Zabbix’s freemium pricing model is its competitive advantage. It makes it ideal for SMBs and other open-source-minded organizations with less financial muscle for premium tools and wants to benefit from an excellent infrastructure monitoring tool. But on the other hand, you don’t have professional support or SLAs to rely on. For that, you will be required to subscribe to a paid technical support service. Large organizations and enterprises with an open-source mindset who can afford premium tech support from the vendor can also benefit from this tool. If you’re on a budget and want a robust and customizable monitoring tool, Zabbix is no doubt your best bet.
Datadog’s SaaS-based model makes it ideal for organizations that don’t want to burden themselves with any resource-intensive on-premise monitoring solution. Service-oriented companies, SMBs, or smaller networks that don’t have dedicated IT personnel to keep tabs on the infrastructure at a granular level will find this feature-rich tool suitable. More extensive networks with multiple remote locations may make Datadog’s agent-based model inconvenient since agents will need to be individually installed. But if you can successfully get past the agent installation and configuration process, Datadog is an excellent network monitoring and infrastructure management tool. If you’re looking for a modern tool that responds to highly dynamic cloud environments and possesses excellent application-level monitoring, then Datadog is undoubtedly a better fit.
Zabbix Vs Datadog FAQs
What makes Datadog different?
Datadog is a cloud platform of system monitoring and management tools. There are a number of other cloud-based system monitoring services that offer similar services to Datadog. However, the remarkable attribute of Datadog is that it is constantly evolving. In recent years, the Datadog team has expanded beyond its original network, server, and application monitoring services to provide more specialized tools. The platform includes distributed tracing services to monitor microservices and extensive security monitoring packages that include protection for cloud services.
What is Zabbix used for?
Zabbix is an open source monitoring system that covers networks, servers, applications, virtualizations, and cloud platforms. This is a competent system-wide monitoring package and it is free to use. The Zabbix software installs on Linux. However, you can run it on any operating system as a virtual appliance over VMWare, Hyper-V, Citrix Xen, KVM, or Docker. It can also be installed on cloud platforms, including AWS, Azure, RedHat OpenShift, DigitalOcean, and Google Cloud Platform.
Can Datadog run on premise?
Datadog is a cloud-based SaaS package. However, in rare cases, customers can request the software and run it themselves on a bare-metal server. This is a special request and is priced by negotiation.
