Between 2018 and December 2024, 525 individual ransomware attacks were carried out against US government organizations, costing an estimated $1.09 billion in downtime.
Ransomware attacks on government organizations have doubled in recent years, climbing from 41 in 2022 to 83 in 2023 and 88 in 2024. The number of records impacted also hit an all-time high in 2024 with 2.3 million records impacted–nearly three times the number of records affected in 2023 (almost 850,000).
Attacks on government organizations can cause huge disruptions to key infrastructure and services, such as 911 dispatch centers, sheriff’s offices, city councils, and utilities. Government employees are often left stranded without their systems and have to resort to pen and paper. In some cases, organizations may be able to restore lost data using backups, but in many cases, they are forced to either pay extortionate ransom demands or make the costly decision to rebuild their systems from scratch.
So, what is the true cost of these ransomware attacks across government agencies in the US, how has the ransomware threat changed over the last seven years, and what may governments have to face in 2025?
To find out, our team gathered information on ransomware attacks that have affected government organizations since 2018. Due to the limitations of uncovering these types of breaches, we believe the figures only scratch the surface of the problem.
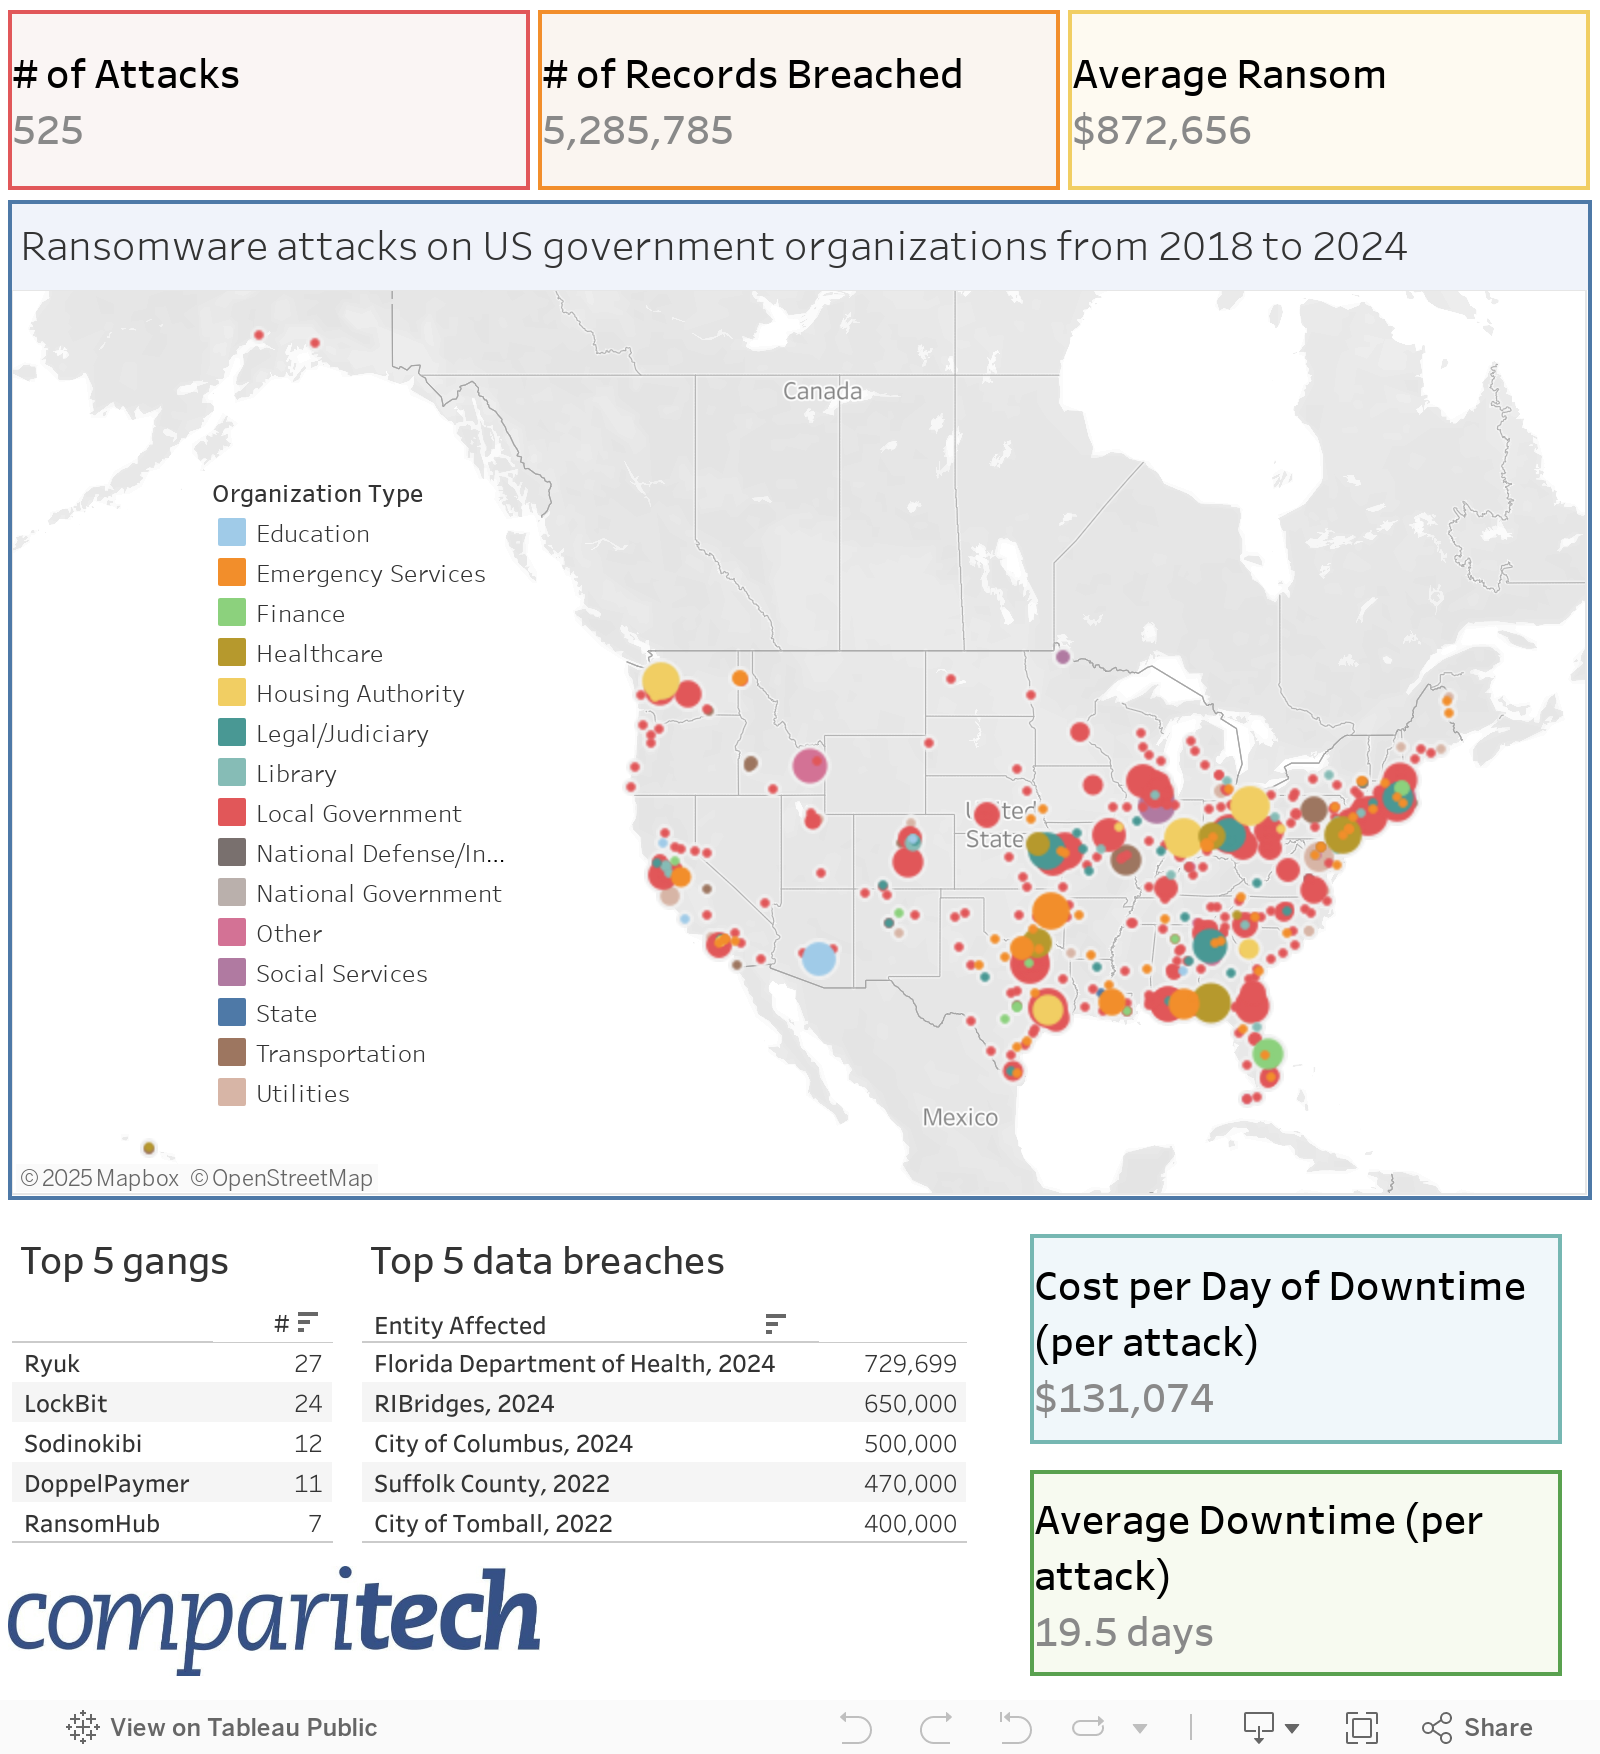
Key findings from 2018 to December 2024
- 525 individual ransomware attacks on government organizations–2019 saw the highest number, accounting for 22 percent (118) of all attacks
- 5,285,785 individual records affected since 2018. 2024 saw the highest number of breached records, accounting for 44 percent (2,345,078) of the total
- Ransomware amounts varied from $1,000 to $23 million with an average demand of $873,000
- Hackers demanded nearly $97 million (111 ransom amounts were revealed)
- Hackers received $10.46 million in payments from 36 of these 111 cases. However, entities are more likely to disclose that they haven’t paid the ransom than if they have
- Downtime varied from minimal disruption (thanks to frequent data backups) to almost a year (343 days), as noted by the City of Newport in July 2022
- On average, government organizations lost nearly 19.5 days to downtime, varying from seven days in 2021 to over 42 days in 2022
- Based on the average downtime per year, government organizations lost an estimated 9,706 days to downtime
- The overall cost of these attacks is estimated at $1.09 billion
- Local governments have remained a key target for hackers over the years, as have emergency services, legal/judiciary entities, transport authorities, and libraries
- BlackSuit was the most prolific ransomware gang in 2024, with LockBit taking the top spot in 2023. LockBit was joined by ALPHV/BlackCat in 2022, while Dopplepaymer and Conti dominated in 2020/21, followed by Ryuk and Sodinokibi/REVIL in 2019, and SamSam in 2018
- Ransomware payment bans on government entities haven’t deterred hackers from targeting organizations within these states, as Florida (one of the two states with such a ban) saw the biggest data breach on a government entity via ransomware in 2024
How much did these ransomware attacks cost government organizations?
Ransom demands vary dramatically, ranging from $1,000 to $23 million. Only 21 percent of the organizations impacted revealed the specific ransom amount demanded. Understandably, organizations don’t want to discuss ransom amounts or whether they have paid them because doing so may incentivize further attacks.
2024 saw an all-time high for the average ransom demand, reaching just over $2.3 million. This is almost three times the average across all years – $873,000. The average ransom paid was also the highest it’s been at $923,000 (compared to $291,000 on average). However, this is only based on two known payments–Wood County’s payment of $1.5 million and Washington County’s payment of $347,000.
Ransom demands by year
| Year | Total Ransom Demanded ($) | # of Known Ransom Demands | Average Ransom Demand ($) | # of Confirmed Ransom Payments | Total Ransom Paid ($) | Average Ransom Payment ($) | # of Confirmed Non-Payments | Estimated Ransom Demanded ($) |
|---|---|---|---|---|---|---|---|---|
| 2018 | 1,021,824 | 18 | 56,768 | 7 | 123,324 | 17,618 | 23 | 2,441,024 |
| 2019 | 12,064,500 | 23 | 524,543 | 9 | 1,965,500 | 327,583 | 78 | 61,896,130 |
| 2020 | 11,686,280 | 22 | 531,195 | 10 | 1,754,780 | 194,976 | 30 | 49,401,093 |
| 2021 | 7,730,471 | 9 | 858,941 | 5 | 1,440,471 | 480,157 | 25 | 50,677,532 |
| 2022 | 9,177,300 | 9 | 1,019,700 | 7 | 1,478,300 | 246,383 | 16 | 41,807,700 |
| 2023 | 6,772,806 | 9 | 752,534 | 3 | 1,850,000 | 616,667 | 19 | 62,460,322 |
| 2024 | 48,411,687 | 21 | 2,305,318 | 2 | 1,846,687 | 923,344 | 27 | 202,868,022 |
| Totals | 96,864,868 | 111 | 872,656 | 36 | 10,459,062 | 290,529 | 222 | 471,551,823 |
In 2021, North Carolina and Florida introduced cybersecurity laws that ban government entities from paying ransom demands.
How has this affected the number of ransomware attacks in these states?
While North Carolina saw a dip in attacks in 2021 and 2022 (just one in each year) after six in 2019 and three in 2020, attacks rose again in 2023 and 2024 (two in each year). Therefore, even though the dip after the legislation was introduced may have seemed promising, this dip (and the subsequent increase) follows the general trend in attacks across these years.
It’s a similar case in Florida. After witnessing eight attacks in 2019 and seven attacks in 2020, it suffered just two in 2021 and one in 2022. However, 2023 saw five confirmed attacks, while 2024 saw eight.
This suggests that the legislation has had little effect on hackers who are still targeting entities within these states. Ultimately, ransomware groups are likely targeting entities at random/via vulnerabilities and aren’t checking whether or not they’re banned from paying ransom payments.
With an increased focus on stealing data, attackers always know that they can sell stolen data if ransom negotiations fail. This was further highlighted in July 2024 after RansomHub targeted the Florida Department of Health. When the ransom demand wasn’t met, RansomHub leaked 100 GB of data. The data breach involved nearly 730,000 people and included a treasure trove of data, including Social Security Numbers, identification, credit card information, medical data, passwords, and more.
The top five largest ransom demands (not payments) on US government organizations include:
- RIBridges (Department of Administration) – $23 million: After previously making a claim on Deloitte, it was later revealed that Brain Cipher had in fact breached one of its client’s systems – RIBridges. Brain Cipher sought $23 million for the stolen data. While the ransom payment remains unconfirmed, Deloitte did give RIBridges $5 million to help with expenses related to the breach.
- Seattle Public Library – $6 million: In May 2024, Seattle’s Public Library was hit by an unknown attacker who demanded $6 million. The library didn’t confirm whether it met the hacker’s demands, but it took around 100 days and $1 million for it to recover from the attack. Nearly 27,000 people have just been confirmed to have been impacted in the breach.
- Port of Seattle/Seattle-Tacoma International Airport – $5.8 million: The Rhysida ransomware gang claimed responsibility for the attack in August 2024, demanding $5.8 million. The Airport refused to pay the attackers.
- City of New Bedford – $5.3 million: In July 2019, the City of New Bedford was hit by Ryuk ransomware, and a $5.3 million ransom was demanded. To buy time, the city counter-offered $400,000 and while the attackers refused this amount, the city was able to restore systems while negotiations were taking place. In the end, no ransom was paid.
- City of Wheat Ridge and North Miami Beach Police Department – $5 million: In August 2022, the City of Wheat Ridge was attacked by the ALPHV/BlackCat ransomware strain and was instructed to pay $5 million in ransom. The city refused to pay but did struggle to get systems back up and running for a week. North Miami Beach Police Department was hit by the same ransom amount in February 2020 by an unknown group. The city refused to disclose if a ransom was paid.
The highest confirmed ransom payment made by a government agency was Wood County, in December 2024, which paid $1.5 million to an unknown group of hackers. Systems returned to normal shortly after the payment was made. The attack led to the resignation of the department’s head of IT.
Based on the figures we do have available, we know:
- Average ransom amount:
- 2024 – $2,305,318
- 2023 – $752,534
- 2022 – $1,019,700
- 2021 – $858,941
- 2020 – $531,195
- 2019 – $524,543
- 2018 – $56,768
- Ransom amounts demanded (known cases):
- 2024 – $48.4 million (21 cases)
- 2023 – $6.8 million (9 cases)
- 2022 – $9.2 milion (9 cases)
- 2021 – $7.7 million (9 cases)
- 2020 – $11.7 million (22 cases)
- 2019 – $12.1 million (23 cases)
- 2018 – $1 million (18 cases)
- Ransom amounts paid (known cases)
- 2024 – $1.85 million (2 cases)
- 2023 – $1.85 million (3 cases)
- 2022 – $1.48 million (6 cases)
- 2021 – $1.44 million (3 cases)
- 2020 – $1.75 million (9 cases)
- 2019 – $1.97 million (6 cases)
- 2018 – $123,324 (7 cases)
Adding in the cost of downtime to ransomware attacks
Unfortunately, even when organizations manage to avoid paying ransom, they are often left with extortionate costs as they try to restore their systems and add extra layers of security to prevent further attacks.
Systems can be taken down for hours, days, weeks, and even months. And as we’ve already noted, the average downtime across all years was 19.5 days. The cost of this downtime can vary dramatically.
To try and put a cost to the downtime caused to government organizations, we’ve used the overall ransomware recovery costs quoted by 67 entities. Using these amounts and the downtime caused in each of these attacks, we’ve created an average downtime cost per day. These were the average cost per day per year:
- 2018 – $232,948 per day
- 2019 – $217,026 per day
- 2020 – $46,413 per day
- 2021 – $124,299 per day
- 2022 – $190,581 per day
- 2023 – $75,841 per day
- 2024 – $23,796 per day
Based on these figures, the average across all years was $131,074 per day and we estimate that the total cost of downtime to government organizations in the last seven years is more than $1.09 billion.
Some of the other highest recorded downtime costs are as follows:
- The City of Baltimore – $18.2 million: Attacked by RobinHood ransomware in May 2019, Baltimore spent a reported $18.2 million recovering from this attack.
- Suffolk County – $17.4 million: Breached in September 2022, ALPHV/BlackCat initially demanded a $2.5 million ransom. Suffolk County refused to pay even when the amount was reduced to $500,000. Instead, it spent more than five months (162 days) restoring systems and $17.4 million ($5.4 million in the initial investigation and $12 million for new hardware) on recovery (nearly 7 times the initial ransom demand made).
- The City of Atlanta – $17 million: Spent an estimated $17 million recovering from its SamSam ransomware attack in March 2018.
- The Unified Government of Wyandotte County and Kansas City – $10 million: Only managed to restore systems two months after they were taken offline in April 2022. The total cost was said to be in excess of $10 million.
- The City of Dallas – $8.5 million: The city faced $8.5 million in downtime costs after an attack by the Royal ransomware gang in May 2023. The city recovered 90 percent of its network after 30 days.
- The City of Columbus – $7.3 million: After being hit with Rhysida ransomware in July 2024, Columbus refused to pay the $1.9 million ransom demand. Instead, the city spent $7.3 million in total on recovery costs, which included $2.4 million for system forensics, remediation, and data mining, $1.6 million for Experian identity theft protection, and $1.95 million for legal counsel.
Ransomware attacks on US government organizations by month and year
As we’ve already noted, 2019 was the worst year for the number of ransomware attacks on government organizations, with its 118 attacks accounting for just over 22 percent of the total attacks (525). In 2021 and 2022, attacks dropped significantly (to 59 and 41, respectively) before doubling in 2023 (83) and remaining high in 2024 (88).
Despite 2019 being the worst year for the volume of attacks, it accounts for just over one percent of all the records breached (63,300 out of 1.09 million). In contrast, 2024, which saw the most records breached in these attacks (more than 2.3 million), accounts for nearly 44 percent of all the records breached. This highlights the increasing focus on data theft as well as system encryption, particularly as this figure of 2.3 million will likely rise in the coming months as more breaches are reported.

- Number of attacks:
- 2024 – 88
- 2023 – 83
- 2022 – 41
- 2021 – 59
- 2020 – 93
- 2019 – 118
- 2018 – 43
- Number of records impacted:
- 2024 – 2,345,078
- 2023 – 848,594
- 2022 – 1,328,200
- 2021 – 485,507
- 2020 – 215,106
- 2019 – 63,300
- 2018 – N/A
- Average downtime:
- 2024 – 29.58 days
- 2023 – 16.02 days
- 2022 – 42.24 days
- 2021 – 7.27 days
- 2020 – 14.71 days
- 2019 – 14.56 days
- 2018 – 12.23 days
- Estimated downtime caused (based on known cases and average in unknown):
- 2024 – 2,603 days
- 2023 – 1,330 days
- 2022 – 1,732 days
- 2021 – 429 days
- 2020 – 1,368 days
- 2019 – 1,718 days
- 2018 – 526 days
- Estimated cost of downtime:
- 2024 – $262.2 million
- 2023 – $162.2 million
- 2022 – $202 million
- 2021 – $52.6 million
- 2020 – $156.3 million
- 2019 – $192.9 million
- 2018 – $65 million
Which state had the most ransomware attacks on government organizations from 2018 to December 2024?
The overall figures by state aren’t too much of a surprise. One of the most heavily populated states in the US, Texas, had the highest number of attacks (51). This was followed by California with 41. Making up the rest of the top five most affected states were Florida and Georgia (with 33 attacks each) and Ohio (27 attacks).
As for the number of records affected, Florida reported the most with 977,000. This is largely due to the attack on the Florida Department of Health by RansomHub in July 2024, which affected 729,699 records. The second worst-hit state for records affected was Rhode Island with 796,000 (across just 10 attacks). The vast majority of records were due to the December 2024 attack on RIBridges (Department of Administration), which affected 650,000 people.
In 2024, California was the hardest-hit state with nine attacks in total, yet only 1,125 records were impacted (this figure may still grow). Florida reported the second-highest number of attacks with eight and also the highest number of records (due to the large-scale attack mentioned above) with a total of 864,000 records impacted in 2024.
Which ransomware gangs are targeting US government agencies?
In 2023, LockBit was behind the most confirmed attacks on government agencies with 14 in total. In 2024, BlackSuit was the most prolific hacking group reported with nine attacks. This was followed by Medusa (8), RansomHub (7), and INC (7).
These gangs have been prolific across most sectors, so which have perhaps been more “successful” than others in their attacks against government organizations?
With little data to go on as to ransoms paid, we are unable to use confirmed payments as a way to determine how successful a group has been. Instead, we can look at the amount of data each group has stolen as well as the number of confirmed attacks vs. unconfirmed attacks made against government entities by each gang. (Unconfirmed attacks are those that haven’t been acknowledged by the organization involved, e.g., through a data breach notification, public notice, or report).
Ransomware groups that have stolen the most data since 2018 are:
- RansomHub – 729,699 records: All of these records stem from the Florida Department of Health attack in July 2024.
- Brain Cipher – 650,000 records: These were all as a result of the attack on RIBridges (Department of Administration) in December 2024.
- ALPHV/BlackCat – 559,426 records: 470,000 of these records are from the attack on Suffolk County in September 2022.
- Rhysida – 500,000 records: These records came from the City of Columbus attack which took place in July 2024.
- Play – 244,050 records: 201,404 of these records are due to an attack on Dallas County in October 2023.
- DoppelPaymer – 198,862 records: DoppelPaymer’s attack on the Cuyahoga Metropolitan Housing Authority in 2021 saw 189,008 bread records.
Also within the top ten are LockBit (97,124), Conti (87,282), NoEscape (82,745), and El Dorado/BlackLock (82,469).
The most “successful” ransomware gangs in 2024
To see which gangs came out on top in 2024, we can look at those with the highest percentage of confirmed attacks to unconfirmed attacks. These were:
- BlackSuit – 90% confirmed: Just one claim on a government entity remains unconfirmed from BlackSuit, while nine are confirmed.
- Rhysida – 83% confirmed: Just one attack remains unconfirmed vs. five confirmed attacks.
- RansomHub – 78% confirmed: Out of nine attacks, seven were confirmed and two unconfirmed.
- Medusa – 73% confirmed: Three attacks remain unconfirmed for Medusa, while eight were confirmed.
- INC – 70% confirmed: INC had seven confirmed attacks on government agencies and three unconfirmed.
How does 2025 look for government ransomware attacks?
Throughout 2025 so far, we’ve confirmed eight attacks on government agencies and have noted a further 15 unconfirmed attacks. Not only that, but we’ve witnessed some extensive downtime as a result of some of these attacks. For example, after an attack by RansomHub in February 2025, the Sault Ste. Marie Tribe of Chippewa Indians had to shut down a number of its services, including casinos, for at least a couple of weeks. And the Town of Bourne, also hit by RansomHub, was only able to restore its services on March 4 after being attacked on January 12.
But 2024 also highlighted that downtime isn’t the only threat government agencies face as a result of these attacks. With data theft becoming another key priority for hackers, government agencies are not only impacted by system encryption but the knock-on effect of data breaches. And, as many government agencies are unable to pay ransom demands or unwilling to negotiate with hackers, it’s likely we’ll see growing figures when it comes to data breaches arising from ransomware attacks.
Methodology
Using the database from our US ransomware attack map, our research found 531 ransomware attacks in total. From this, we were able to ascertain how much ransom had been demanded and how much had been paid.
In the case of Texarkana Water Utility, which affected residents in both Texas and Arkansas, the attack has been counted in both states (as an attack). But in yearly figures, it is included as a single attack. The same can be said for the Washoe Tribe of Nevada and California, which was added in the same way. Both of these were omitted from state totals for the cost of downtime due to the inability to divide the total amount lost by each state.
Only one attack cannot be pinpointed to a specific month and has been omitted from these comparisons. This was the Azusa Police Department attack that occurred in 2018.
If no specific figures were given for downtime, i.e. “several days,” “one month” or “back to 80% after 6 weeks” were quoted, then we created estimates from these figures based on the lowest figure they could be. For example, several days was calculated as three, one month was calculated as the number of days in the month the attack happened, and the number of weeks quoted in % recovery statements was used (e.g. 6 weeks per the previous example).
From there we were able to create an estimate for downtime costs. Those that could provide the information, we divided the total cost of the incident by how many days their systems were affected. For example, the City of Columbus (attacked in July 2024) reported that the total cost of the incident was $7.3 million and reported they had restored systems after 71 days (7.3 million divided by 71 days equated to a $102,817 cost per day). We then assigned the average from all years ($131,074) to estimate how much these attacks cost.
Data researchers: Charlotte Bond, Danka Delić