According to data collated from Shodan.io, the US is home to the most NDAA-prohibited cameras in the world.
The 2019 National Defense Authorization Act (NDAA) prohibited the use of certain equipment manufactured in China, including cameras, by US federal government agencies, contractors, and grant loan recipients (it does not cover non-federal entities or consumers). The list of banned cameras includes brands like Hikvision and Dahua and their original equipment manufacturer (OEM) brands. Huawei was omitted from the study due to a lack of IP cameras/DVRs, with the vast majority of products showing on Shodan being modems and home gateways.
The NDAA banned federal use of these Chinese manufacturers due to heightened security risks and questions over how secure these cameras were. With increased connectivity and smarter technologies, there are concerns over how easily these devices can be hacked into or whether a “back door” can be installed to allow hackers to steal data and penetrate networks.
While the NDAA may only apply to US federal use, it does pose the question as to whether any business, other worldwide government organization, or consumer may think twice about installing such a system.
To find out where in the world these cameras are most widely used, our team used the Shodan search engine to search for internet-connected cameras by city and country. Shodan finds and pinpoints the internet protocol (IP) addresses of the cameras’ networks. As there are normally multiple cameras per network, The figures we have found are probably a fraction of the total number of NDAA-prohibited cameras within each country and city.
Despite the restrictions within the US, these NDAA-prohibited brands are found there in their thousands.
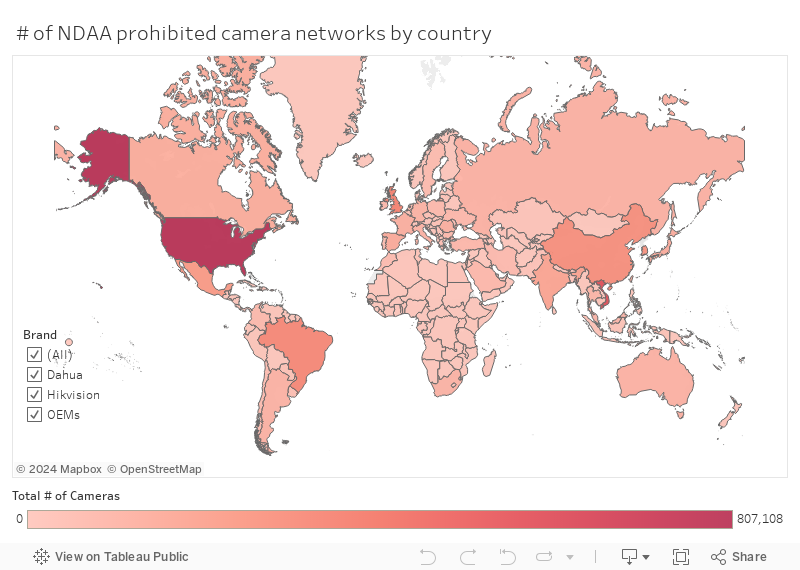
The top 10 countries for NDAA-prohibited camera networks
According to our findings, the following countries are hotspots for NDAA-prohibited camera brands:
- The United States = 807,108
- Vietnam = 589,607
- United Kingdom = 351,459
- Brazil = 320,908
- China = 287,935
- South Korea = 267,143
- Mexico = 233,358
- India = 184,710
- Spain = 148,443
- Canada = 139,892
With over 800,000 individual IP addresses for NDAA-prohibited manufacturers, the US takes the top spot. The vast majority of these are Hikvision (not including OEMs), with 674,956 registered in total.
Vietnam also hosts a large number of Hikvision camera networks, with over 433,700. It is also home to the largest number of Dahua camera networks (not including OEMs)–nearly 156,000.
The top 10 worldwide cities for NDAA-prohibited camera networks
To see where some of the biggest hotspots for these cameras were, we searched for each camera brand and its OEMs within the top 100 most populated cities in the world.
- Seoul, South Korea: 93,355 camera networks to a population of 9,988,049 = 9.35 per 1,000 people
- London, UK: 91,317 camera networks to a population of 9,648,110 = 9.46 per 1,000 people
- São Paulo, Brazil: 85,115 camera networks to a population of 22,619,736 = 3.76 per 1,000 people
- Paris, France: 81,850 camera networks to a population of 11,208,440 = 7.30 per 1,000 people
- Singapore, Singapore: 75,708 camera networks to a population of 6,080,859 = 12.45 per 1,000 people
- Mumbai, India: 74,242 camera networks to a population of 21,296,516 = 3.49 per 1,000 people
- Sydney, Australia: 71,692 camera networks to a population of 5,120,894 = 14 per 1,000 people
- Cape Town, South Africa: 66,581 camera networks to a population of 4,890,280 = 13.61 per 1,000 people
- Ho Chi Minh City, Vietnam: 66,018 camera networks to a population of 9,320,866 = 7.08 per 1,000 people
- Tokyo, Japan: 60,878 camera networks to a population of 37,194,104 = 1.64 per 1,000 people
While Seoul has the largest number of NDAA-prohibited camera networks, it’s Sydney that has the highest ratio of cameras to people.
Things also change if we look at the number of camera networks per square mile of each city, too.
- Seoul, South Korea: 93,355 camera networks for 234 miles² = 400 cameras per square mile
- Singapore, Singapore: 75,708 camera networks for 281 miles² = 269 cameras per square mile
- Mumbai, India: 74,242 camera networks for 438 miles² = 169 cameras per square mile
- Cape Town, South Africa: 66,581 camera networks for 439 miles² = 152 cameras per square mile
- London, UK: 91,317 camera networks for 607 miles² = 150 cameras per square mile
- New York City, United States: 28,611 camera networks for 300 miles² = 95 cameras per square mile
- Johannesburg, South Africa: 11,788 camera networks for 129 miles² = 91 cameras per square mile
- Ho Chi Minh City, Vietnam: 66,018 camera networks for 796 miles² = 83 cameras per square mile
- Paris, France: 81,850 camera networks for 1,102 miles² = 74 cameras per square mile
- Hong Kong, Hong Kong: 27,415 camera networks for 429 miles² = 64 cameras per square mile
# of NDAA-prohibited camera networks by the top 50 US cities
If we take the top 50 most populated US cities and the number of NDAA-prohibited camera networks in each of these, we get some interesting results.
- San Jose, California: 56,464 camera networks to a population of 1,033,430 = 54.64 per 1,000 people
- New York City, New York: 28,611 camera networks to a population of 8,992,908 = 3.18 per 1,000 people
- Houston, Texas: 21,830 camera networks to a population of 2,366,119 = 9.23 per 1,000 people
- Miami, Florida: 14,127 camera networks to a population of 455,075 = 31.04 per 1,000 people
- Chicago, Illinois: 13,782 camera networks to a population of 2,761,625 = 4.99 per 1,000 people
- Philadelphia, Pennsylvania: 10,908 camera networks to a population of 1,627,134 = 6.7 per 1,000 people
- Los Angeles, California: 10,669 camera networks to a population of 3,930,586 = 2.71 per 1,000 people
- Atlanta, Georgia: 7,801 camera networks to a population of 522,328 = 14.94 per 1,000 people
- Phoenix, Arizona: 5,256 camera networks to a population of 1,656,892 = 3.17 per 1,000 people
- Dallas, Texas: 5,208 camera networks to a population of 1,336,347 = 3.9 per 1,000 people
While it’s perhaps no surprise that New York is one of the biggest hotspots for these camera networks, San Jose’s figures are huge in comparison, especially when taking its population into account. With one-ninth of New York City’s population but twice the number of camera networks, San Jose has 54.64 camera networks per 1,000 people. And when we consider the fact that these camera networks likely have more than one camera, it means San Jose is the most surveilled city in the US via NDAA-prohibited camera networks. The vast majority of these camera networks are Hikvision, with 55,719 in total.
NYC has the highest number of Dahua camera networks (4,119).
Some of the biggest OEM brands within the US were Luma (Hikvision) and Lorex (Dahua). Phoenix has the highest number of Luma camera networks and NYC had the highest number of Lorex camera networks.
Based on the number of cameras per square mile, Miami has the most with 392.42 per square mile.
Methodology
To collate figures of the camera networks by country and city, our team first went through the list of NDAA-prohibited brands as well as the list of OEMs for Dahua and Hikvision, as provided by IPVM. In many cases, the OEMs provided 0 results, but the following OEMs were included:
- Abus (Hikvision)
- Amcrest (Dahua)
- CP Plus (Dahua)
- EyeSonic (Hikvision)
- Ezviz (Hikvision)
- Grundig (Hikvision)
- IC Realtime (Dahua)
- Intelbras (Dahua)
- Lorex (Dahua)
- Luma (Hikvision)
- RVi (Hikvision/Dahua)
- Siqura (Hikvision)
- Space Technology (Dahua)
- SPRO (Dahua)
- TRENDnet (Hikvision)
- Unisight (Dahua)
- WatchNET (Dahua)
We searched each of the aforementioned brands through the Shodan.io search engine, which provides a list of internet-connected devices around the world. It lists the connected devices and their internet protocol (IP) address alongside information on the type of device, e.g. an IP camera, its city and country location, its server, when it was last modified, and other data. The vast majority of the results we collated are for IP cameras and digital/network video recorders but there may be some instances where other internet-connected products were included, e.g. a remote desktop, but these were omitted where possible. Huawei wasn’t included in this study due to a lack of IP cameras/DVRs, with the vast majority of products showing on Shodan being modems and home gateways.
Xinbei was omitted from our top 100 cities due to Shodan not recognizing this as a city (likely due to recent changes between Taipei and New Taipei City).
Our city sizes were taken from government sources or citypopulation.de where we found the area size that correlated best with the population figures we have. Often, this is the metropolitan area rather than the city as camera figures spread into these areas.
