
Microsoft Network Monitor is a packet analyzer for Windows that allows users to analyze network packets and protocols. The tool can help to diagnose performance issues within a network.
Here is our list of the best Microsoft Network Monitor alternatives:
- ManageEngine OpManager EDITOR’S CHOICE This tool excels as an alternative to Microsoft’s network monitor, offering integrated network, server, and application management with user-friendly security log monitoring. Download a 30-day free trial.
- ManageEngine NetFlow Analyzer (FREE TRIAL) A live monitoring tool for network traffic flows that includes analysis and capacity planning features. Available for Windows Server and Linux. Start a 30-day free trial.
- Site24x7 (FREE TRIAL) This cloud-based platform implements full-stack observability with network monitoring at the heart of its functions – making it a much broader package than Microsoft Network Monitor. Get a 30-day free trial.
- Paessler PRTG Network Monitor (FREE TRIAL) Unified network monitoring tool and packet analyzer that supports IP, TCP, and UDP traffic. Start a 30-day free trial.
- Wireshark Open-source packet analyzer for Windows and UNIX with filters, and packet colorization.
- SolarWinds NetFlow Traffic Analyzer A network packet analyzer with a web-based GUI with support for NetFlow, sFlow, J-Flow, IPFIX, and NetStream.
- WinPcap Packet analysis tool and a programming interface that was used to create the same filtering engine used by Wireshark and Nmap.
- Colasoft Capsa Free packet capture software that can monitor traffic in real-time with TCP flow analysis and VoIP analysis.
- Tcpdump Command-line-based packet analyzer that allows you to run basic network scans.
Microsoft has archived the tool and it’s no longer under development. Although Microsoft moved users over to their Microsoft Message Analyzer (MMA) for updated parser support, it too was also retired in November of 2019.
While both tools had their uses and fans, there are many other alternative packet analyzers on the market that provide a similar if not better monitoring experience.
The Best Microsoft Network Monitor Alternatives
Our methodology for selecting an alternative to Microsoft Network Monitor
We reviewed the market for network monitoring systems like Microsoft Network Monitor and analyzed tools based on the following criteria:
- An easy-to-use package with a good graphical user interface
- Live graphs that show network activity
- Traffic flow statistics from several points on the network
- The ability to communicate with switches and routers to extract data
- Network discovery
- A free trial, a demo, or a free tool for a cost-free assessment
- A free tool that provides valuable insights into the network activity or a value-for-money paid tool
With these selection criteria in mind, we identified a number of network monitoring systems that will more than replace the functionality that was offered by Microsoft Network Monitor.
The following tools are ranked according to their ease of implementation, usability, and overall reliability.
1. ManageEngine OpManager (FREE TRIAL)
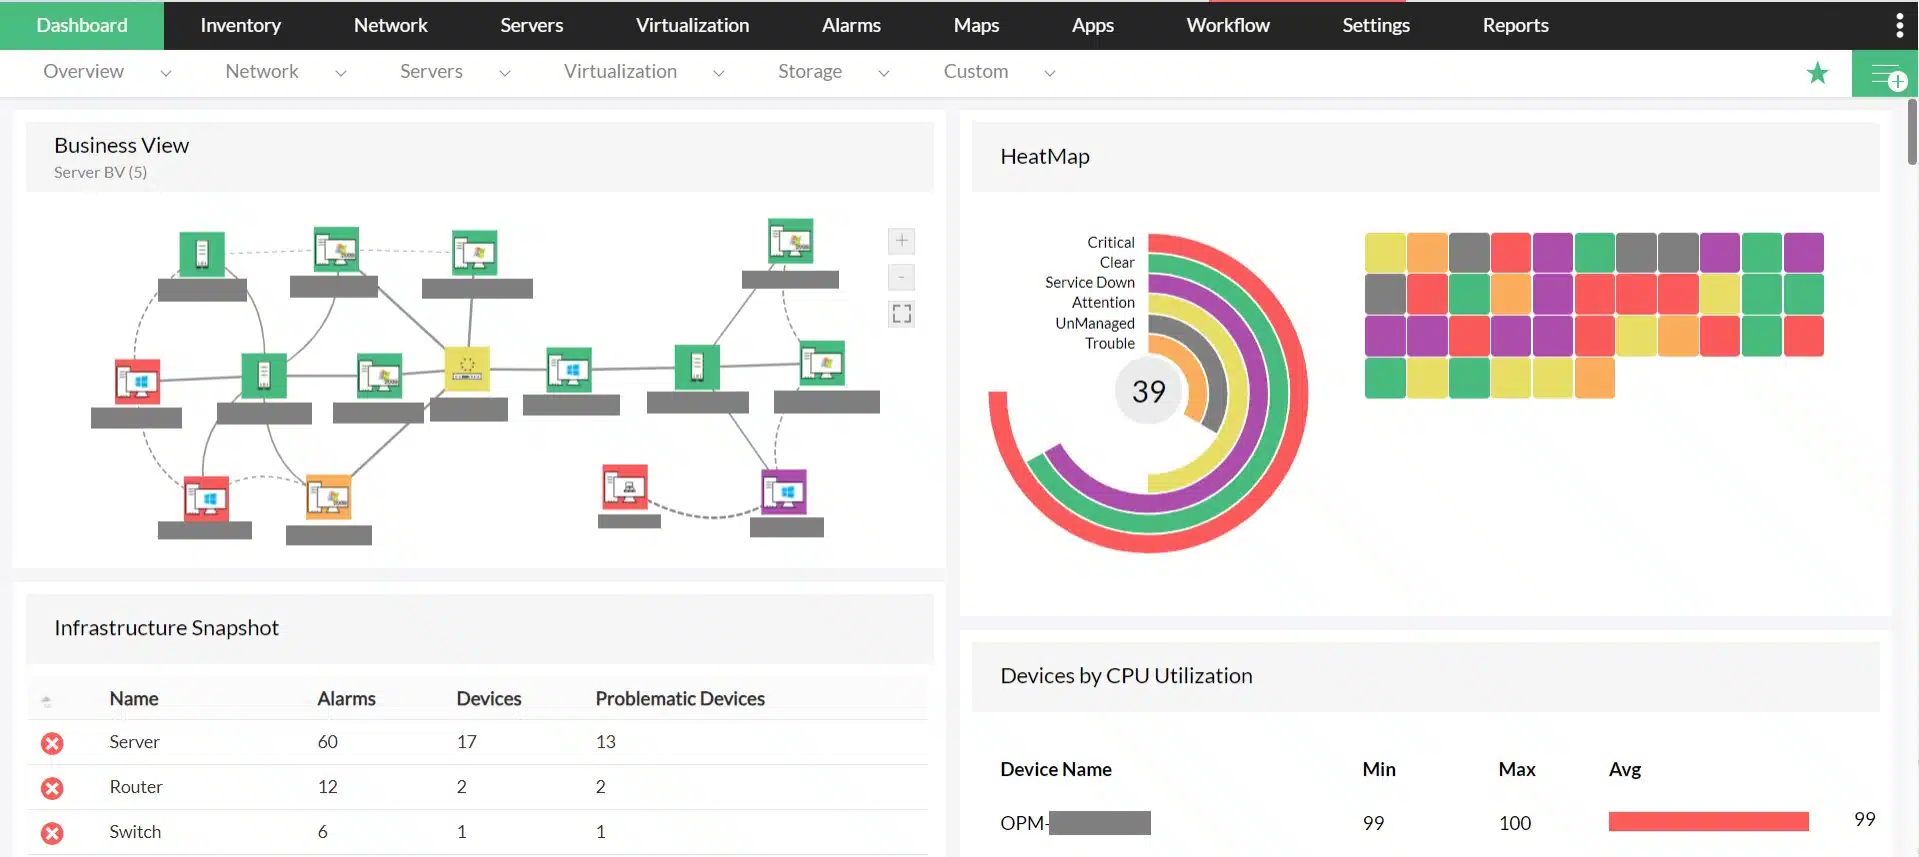
ManageEngine OpManager offers robust network monitoring capabilities, providing real-time visibility into network performance and health. It supports comprehensive monitoring of network devices, including routers, switches, firewalls, and servers, ensuring all critical infrastructure components are operational. The tool features customizable dashboards, automatic device discovery, and proactive alerting to detect and resolve network issues swiftly. Additionally, OpManager’s extensive reporting capabilities help in analyzing network trends and optimizing performance.
Key Features:
- Security Event Monitoring: Automatically detects and alerts on critical security events like failed logons and account lockouts.
- Application & System Monitoring: Monitors logs for crucial applications such as IIS, Exchange, SQL, and ISA servers.
- Custom Rule Creation: Allows for the creation of custom monitoring rules to enforce specific security policies and monitor any application.
- Integrated Solution: Combines event log monitoring with overall network, server, and application management, eliminating the need for additional consoles.
- Predefined Rules: Offers numerous out-of-the-box rules for monitoring various applications and services, enhancing usability.
Why do we recommend it?
OpManager stands out as a robust Microsoft network monitor alternative, offering seamless integration of event log monitoring with network and server management in a single interface.
Who is it recommended for?
OpManager is recommended for IT administrators and network managers seeking a comprehensive monitoring solution that consolidates various management tasks into one platform, especially those in Windows-dominated environments.
Pros:
- Comprehensive Security Monitoring: Automatically detects and alerts on critical security events, improving overall network security.
- Extensive Application Support: Provides thorough monitoring for essential applications like IIS, Exchange, and SQL servers.
- Customizable Rules: Users can create and customize monitoring rules to suit their specific security and operational needs.
- Unified Management Console: Integrates event log monitoring with network and server management, streamlining operations.
- User-Friendly: Designed to be accessible for users without extensive technical expertise, making it easy to deploy and manage.
Cons:
- Learning Curve: New users might need time to familiarize themselves with the extensive features and customization options.
Download a 30-day free trial.
EDITOR'S CHOICE
ManageEngine OpManager is our top network monitor because it serves as a powerful alternative to Microsoft’s network monitoring tools, integrating Windows event log monitoring with comprehensive network, server, and application management. This integration streamlines operations, allowing administrators to monitor their entire infrastructure from a single console. The tool comes equipped with numerous automatic rules for monitoring critical security logs, making it user-friendly for non-experts. It also supports extensive application and system log monitoring for essential services like IIS, Exchange, and SQL servers, with the flexibility to create custom rules for any application. This versatility and ease of use make OpManager an excellent choice for IT teams.
Download: Access a 30-day FREE Trial
Official Site: https://www.manageengine.com/network-monitoring/download.html
OS: Windows, Linux, Cloud-based
2. ManageEngine NetFlow Analyzer (FREE TRIAL)

ManageEngine NetFlow Analyzer is a bandwidth monitor that identifies the capacity of each link on your network and then watches traffic flows to see whether any stretches are approaching overloading.
Key Features:
- Broad Protocol Support: Works with numerous protocols, including NetFlow and sFlow, for diverse network monitoring.
- Comprehensive Traffic Analysis: Detailed per-device and per-interface traffic insights.
- Proactive Alerts: Notifies technicians of network issues promptly.
- Flexible Installation: Available on Windows Server, Linux, AWS, and Azure.
- Packet Analysis Capability: Facilitates in-depth examination of packet headers for detailed traffic insights.
Why do we recommend it?
ManageEngine NetFlow Analyzer is a major rival to the SolarWinds NetFlow Traffic Analyzer. This tool provides traffic tracking, per device and per interface. You can also examine the performance of paths and identify the root cause of slow transmissions or lost packets. The tool assists in traffic shaping to correct problems.
This tool doesn’t look at the cable – network cable can’t provide feedback. Instead, it examines the interfaces of the switches on the network. Each switch logs all of its throughput capacity as it copies data from one port to another. The NetFlow Analyzer extracts this data as it gets recorded on the switch.
Switches communicate their traffic statistics through a built-in query language and different manufacturers use different standards for this function. NetFlow Analyzer can communicate with the NetFlow, sFlow, J-Flow, IPFIX, NetStream, AppFlow, and FNF protocols. Those statistics break down by source and destination and also protocol, so the NetFlow Analyzer dashboard is able to show segmented data as well as overall traffic statistics.
The traffic analysis protocols used by switches also enable the NetFlow Analyzer to extract passing packet headers, either as a flow or as samples. The NetFlow Analyzer includes packet analysis screens that enable you to sort and filer packet headers to identify traffic from specific sources or applications. It can also highlight the exchanges in conversations between two endpoints.
Who is it recommended for?
Unlike the SolarWinds bandwidth analyzer, this system can operate as a standalone package. The software package is available for Windows Server and Linux. You can also get it as a service on AWS or Azure. There is a Free edition but this is limited to monitoring three devices.
Pros:
- Cisco Compatibility: Excellently monitors Cisco equipment, among others.
- Intuitive Interface: Automatically identifies and highlights network traffic anomalies.
- Port Monitoring: Proactively checks switch port status to prevent failures.
Cons:
- Enterprise Scale: Best suited for large networks, not ideal for smaller or home setups.
The NetFlow Analyzer is a software package that installs on Windows Server and Linux. It is available in three editions: Free, Essential, and Enterprise. The Free edition is limited to monitoring only two interfaces. The Essential edition is designed to monitor a single site and multi-site businesses should opt for the Enterprise edition because that has distributed monitoring capabilities. You can get a 30-day free trial of ManageEngine NetFlow Analyzer.
3. Site24x7 (FREE TRIAL)
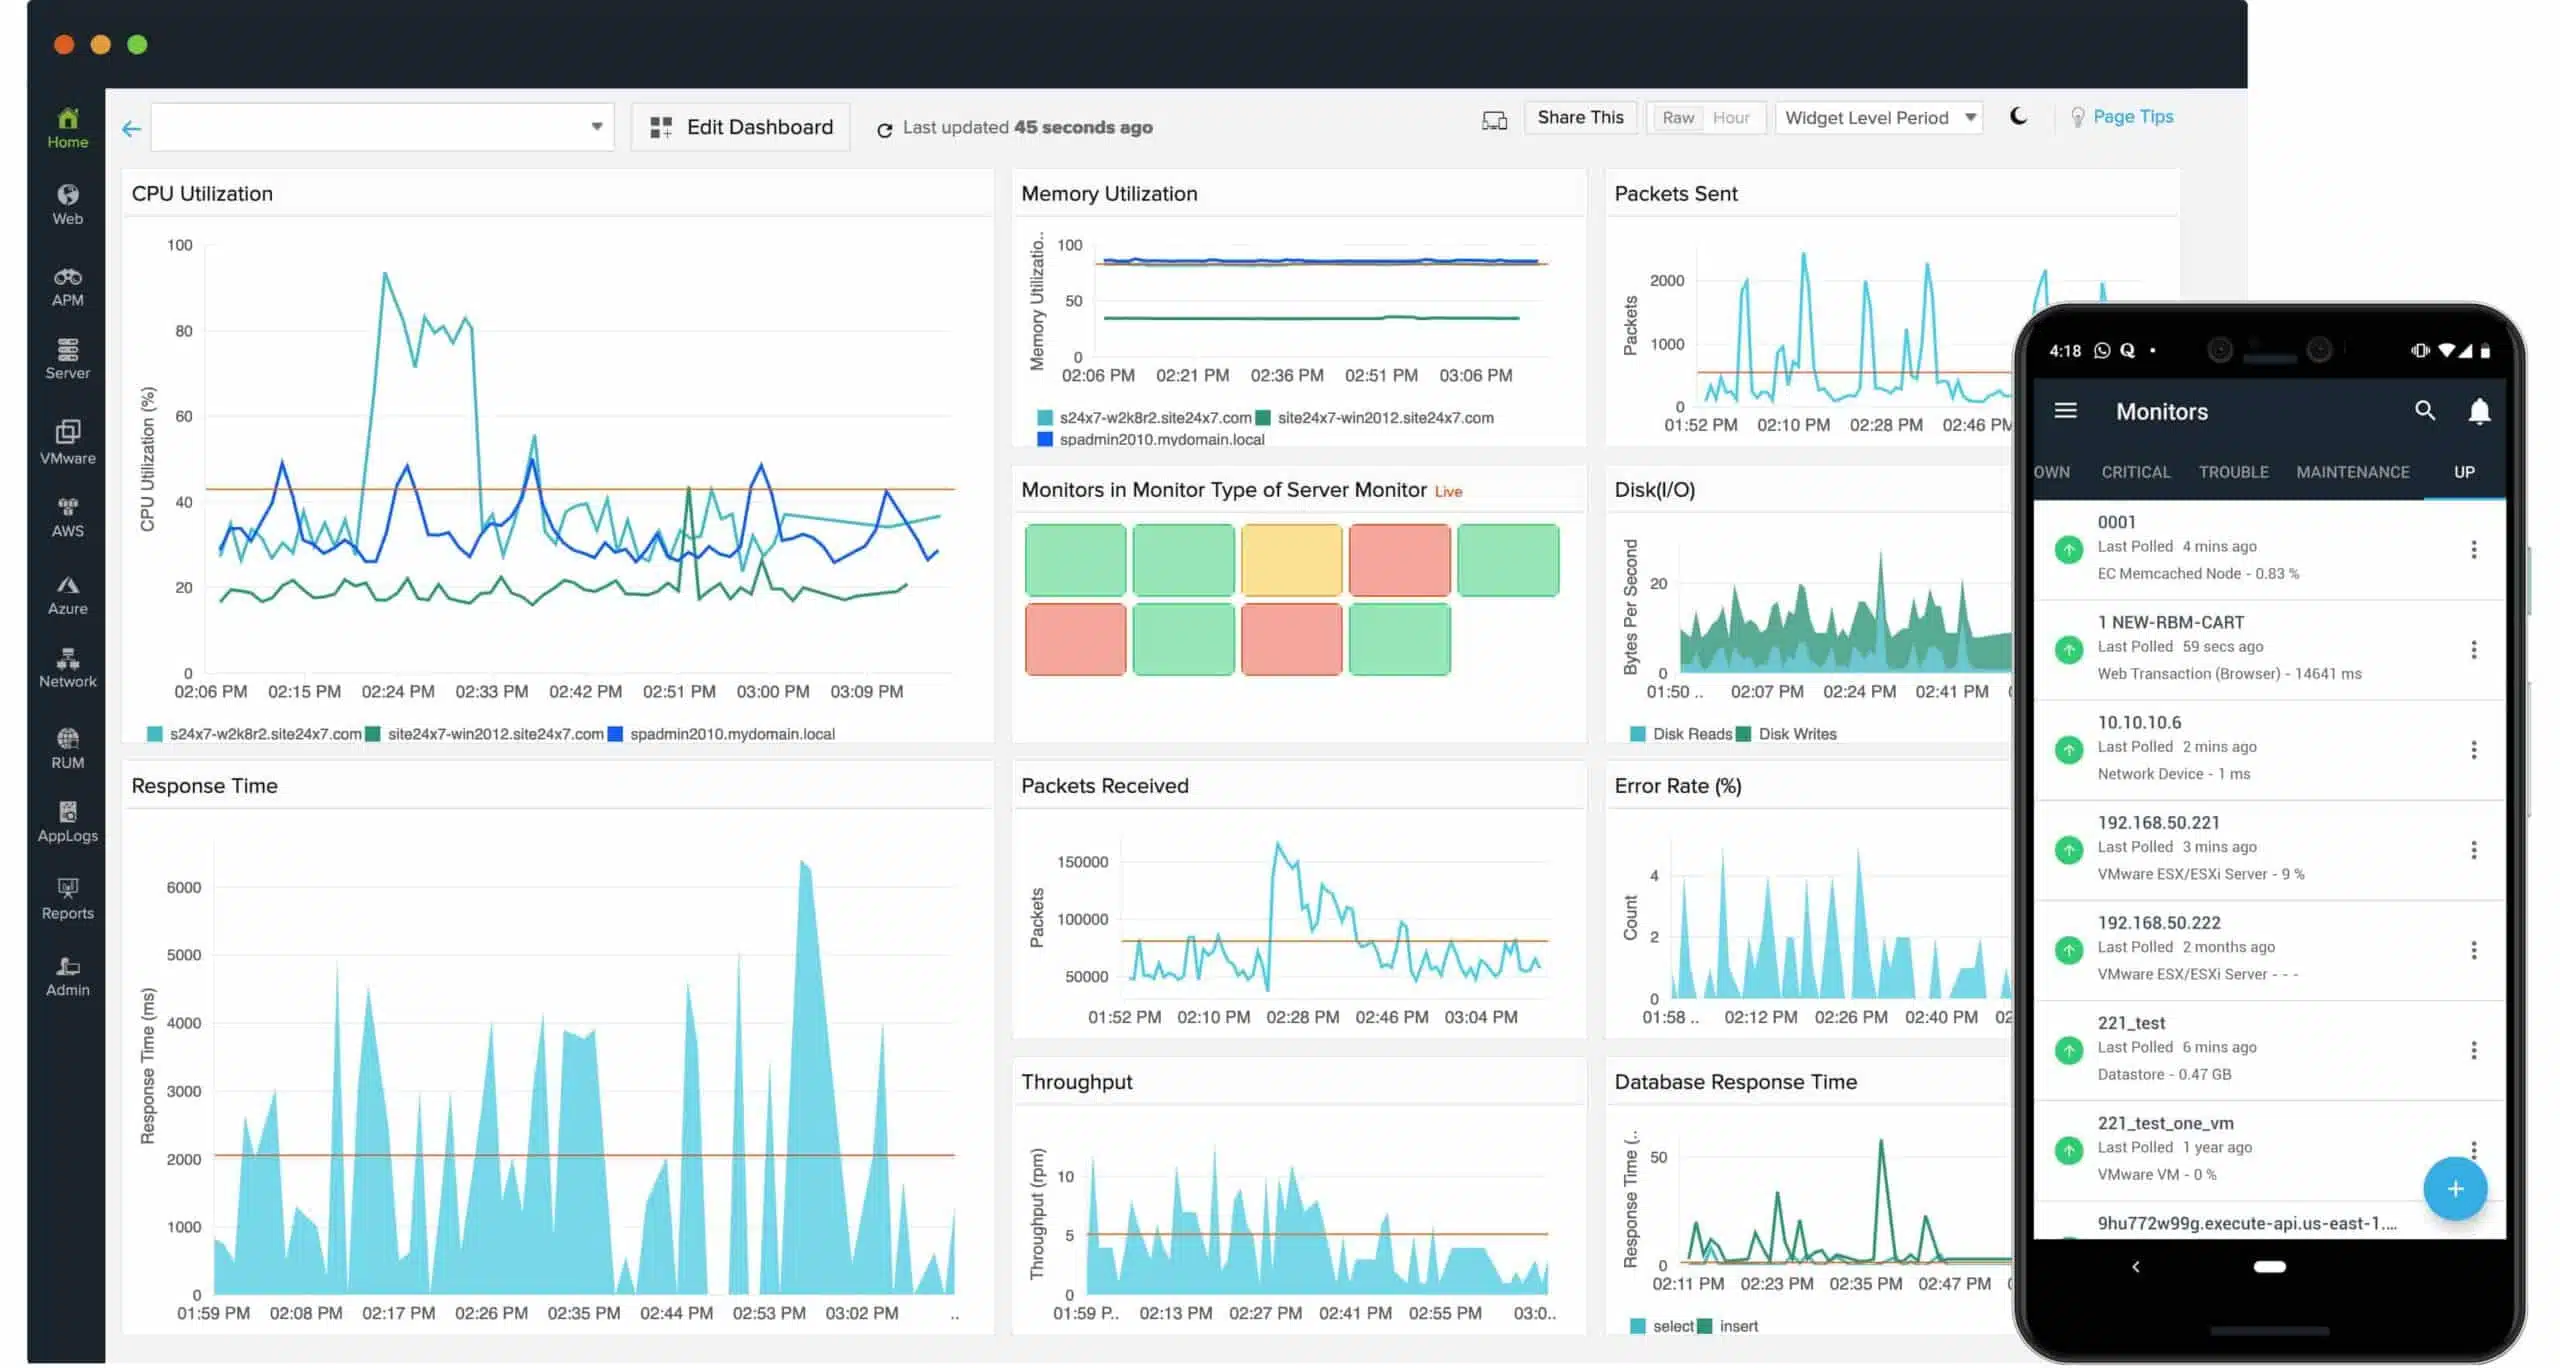
Site24x7 is an excellent alternative to Microsoft Network Monitor, offering comprehensive network monitoring features that provide real-time insights into network performance. Unlike Microsoft Network Monitor, which is primarily focused on packet capture and analysis, Site24x7 gives administrators a broader view of the entire network by tracking key metrics such as bandwidth usage, device health, and network traffic flow. It supports a variety of devices, including routers, switches, firewalls, and servers.
Key Features:
- Real-Time Network Monitoring: Continuous monitoring of network devices such as routers, switches, firewalls, and load balancers.
- Bandwidth Monitoring: Monitors bandwidth usage across network interfaces to identify and address potential bottlenecks.
- SNMP Monitoring: Utilizes Simple Network Management Protocol (SNMP) to gather and analyze data from network devices.
Why do we recommend it?
This package allows IT teams to keep tabs on all critical network components. The platform also includes advanced network discovery tools that automatically detect devices across the network, streamlining the monitoring setup for businesses with dynamic or large network environments.
As well as real-time monitoring, Site24x7 offers network mapping, which visually represents device connections and their status, making it easier for teams to troubleshoot issues. The platform provides customizable alerts that notify administrators whenever performance thresholds are exceeded, ensuring immediate attention to any potential disruptions. Site24x7 also offers in-depth reporting capabilities, enabling businesses to track network performance trends over time and optimize infrastructure for scalability.
Who is it recommended for?
With its comprehensive network monitoring, proactive alerts, and intuitive interface, Site24x7 serves as a versatile and scalable alternative to Microsoft Network Monitor for businesses looking to ensure seamless network operations. The Site24x7 plans are suitable for businesses of all sizes and you can expand an account as your network grows.
Pros:
- NetFlow Analysis: Analyzes network traffic using NetFlow, SFlow, and IPFIX to provide insights into traffic patterns and usage.
- Network Path Analysis: Tracks and visualizes the path of network traffic to identify points of failure and latency issues.
- Device Discovery: Automatically discovers and maps network devices to create a comprehensive network topology.
Cons:
- No On-Premises Version: You can only get this service as a cloud-based SaaS package
Site24x7 plans are priced and sized for small businesses. For example, The Infrastructure Monitoring package is priced at $9. However, that is the starting price and larger companies have to pay more to monitor more devices. Assess this system with a 30-day free trial.
4. Paessler PRTG Network Monitor (FREE TRIAL)

Paessler PRTG Network Monitor is a unified network monitoring tool for Windows that can capture packets. It can monitor IP, UDP, and TCP traffic throughout your network. The software supports a handful of protocol types including NetFlow, IPFIX, sFlow, and jFlow.
Key Features:
- Unified Monitoring: Captures and analyzes traffic across networks, servers, and applications.
- Protocol Versatility: Supports NetFlow, IPFIX, sFlow, and jFlow for comprehensive traffic monitoring.
- Live Traffic Graphs: Offers real-time traffic visualization to track network performance.
Why do we recommend it?
Paessler PRTG Network Monitor is a flexible package of sensors that is based around an SNMP network discovery, inventory, and topology mapping service. That SNMP sweep continues to repeat, noting status reports from network device agents. You can also activate traffic sensors within the package for bandwidth analysis.
Configuring PRTG is easy, but you need to set up sensors first before you can monitor anything. For packet sniffing, you can use the preconfigured Packet Sniffer Sensor, which can monitor total traffic, web traffic, mail traffic, infrastructure traffic, UDP traffic, and TCP traffic. There are also sensors for other protocols included out-of-the-box (although you can design your own if you wish).
So you don’t miss any performance issues, PRTG has an alerts system. The user configures alert conditions by selecting thresholds and then the software generates a notification if a sensor matches that criteria. Notifications can be sent through a variety of means including email, SMS, push notifications, Slack messages, Microsoft teams messages, and more.
Who is it recommended for?
This package is suitable for businesses of all sizes. It is a bundle of tools and you decide which of them to turn on. However, the network discovery service is central to the base package of the system. If you only activate 100 sensors, you never have to pay for the monitoring system.
Pros:
- Multi-Sensor Support: Customizable monitoring with a wide array of sensor options.
- Integrated Monitoring: Combines network, server, and application monitoring in one platform.
- Flexible Alerts: Offers a variety of notification channels for immediate issue resolution.
- Graphical Traffic Analysis: Utilizes clear, intuitive graphs for traffic data presentation.
Cons:
- Learning Curve: The platform’s depth and breadth require time to master all available features.
Paessler PRTG Network Monitor is an ideal packet analyzer for those who want a general network monitoring solution as well. There is a freeware version that supports up to 100 sensors. Paid versions start at $1,600 (£1,247) for 500 sensors. You can download the 30-day free trial.
See also: Full Paessler PRTG Network Monitor Review
5. Wireshark
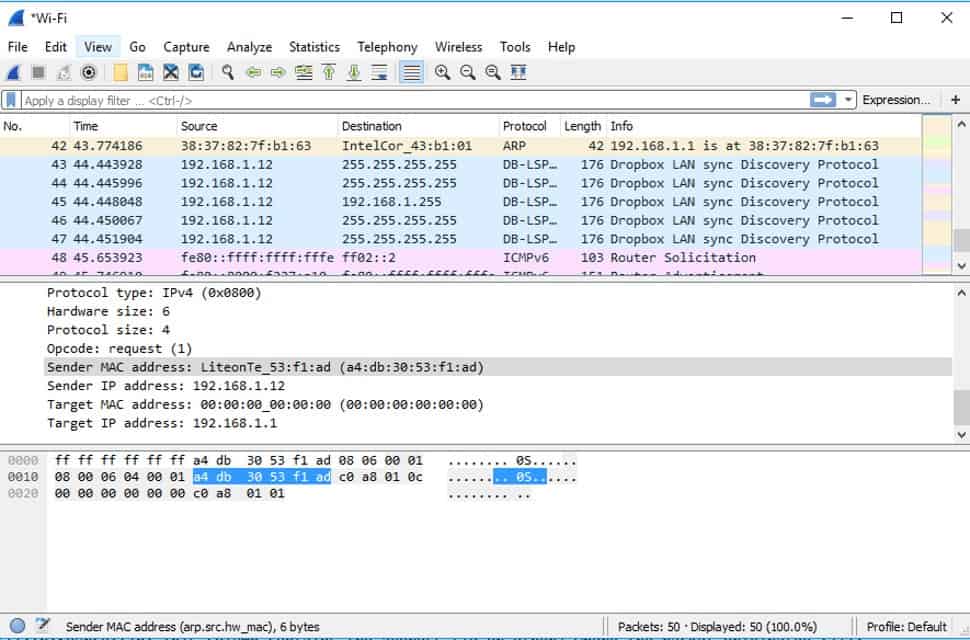
Wireshark is perhaps the most widely used open-source packet analyzer on the market. With Wireshark, you can conduct deep packet inspection of network traffic captured from network interfaces and monitor the results through an intuitive GUI. The platform enables you to monitor live captures and offline data with the assistance of color-coding.
Key Features:
- Open-Source: Available at no cost, fostering a large community of users and contributors.
- Comprehensive Packet Analysis: Offers deep packet inspection capabilities with intuitive GUI.
- Customizable Color Coding: Utilizes color rules to simplify traffic analysis and identification.
Why do we recommend it?
Wireshark is a traffic analyzer that captures packets and displays them. The tool has its own filtering and searching language, which is extensive and takes a long time to master. This can be applied to packet captures so that it reduces the amount of traffic that is copied.
Color coding highlights different types of traffic in different colors. For example, TCP, UDP, ICMP, HTTP, and ARP packets each have a different color so you can easily differentiate different types of traffic when scanning your network. These rules can be changed by editing Coloring Rules, which allows the user to customize how traffic is displayed.
Filters enable you to search through the packets that you’ve captured and narrow down to certain protocol types. There are two types of filters; display filters and capture filters. Display filters allow you to filter information that you’ve already captured and capture filters allow you to filter the information that you’re capturing.
Who is it recommended for?
This system is widely used by network managers and security specialists. It allows you to view packet header data and identify features, such as the endpoints and protocols involved in each transmission. You can reduce the number of packets in your collection through analysis.
Pros:
- Widely Adopted: Recognized as the leading packet analyzer tool, supported by an extensive community.
- Continuous Innovation: Regularly updated with new features and plugins by its open-source community.
- Versatile Collection and Analysis: Integrates packet capturing and analysis in a single application.
- Cost-Effective: Completely free, making it accessible to a broad range of users.
Cons:
- Complex Learning Curve: Designed for professionals, requiring time to master its extensive features.
- Intensive Filtering: Default settings may overwhelm users without customized filters.
Wireshark is highly recommended for users who want an open-source packet capture tool that’s easy to use. The user experience holds up against the very best tools and is one of the top Microsoft Network Monitor alternatives. It’s available for Windows, Linux, macOS, Solaris, FreeBSD, NetBSD, and more. You can download the software for free.
6. SolarWinds NetFlow Traffic Analyzer

SolarWinds NetFlow Traffic Analyzer is a web-based network packet analyzer that allows you to monitor network protocols and traffic. It supports multiple protocol types including NetFlow, sFlow, J-Flow, IPFIX, and NetStream. Traffic can be viewed through the dashboard, which displays application traffic. For example, you can view the Top 5 Applications as a graph or the Top 10 Applications as a pie chart.
Key Features:
- Multi-Protocol Support: Enables monitoring across various protocols like NetFlow and sFlow.
- Integrated Performance Monitoring: Seamlessly combines with performance monitoring tools for comprehensive insights.
- Advanced Alerting System: Provides timely alerts on network anomalies or excessive traffic.
Why do we recommend it?
SolarWinds NetFlow Traffic Analyzer is a bandwidth analyzer that runs on Windows Server. This package shows the capacity of each switch, router, or other network device and the live throughput on each interface. You can also use a path analysis tool, called NetPath to see end-to-end connections across the network.
If you want to take a closer look at performance data then you can use the custom network traffic reports to view performance data. Creating a report on historical data can help you see if there are any long-term performance trends that you need to be aware of.
Alerts keep you notified if there is an abnormal amount of traffic traveling through the network. Alerts are invaluable for giving you a heads up so that you can check out whether the usage has temporarily peaked or indicated something more malicious such as a DDoS attack).
Who is it recommended for?
This tool is a solution for large businesses. You have to buy and install the Network Performance Monitor and then install the NetFlow Traffic Analyzer. With these two units in operation, You get network device discovery and constant status checks as well as live traffic reports.
Pros:
- User-Friendly Interface: Navigating the dashboard is intuitive, even in complex network environments.
- Hardware-Agnostic: Supports a broad range of networking technologies for versatile monitoring.
- Immediate Insights: Pre-configured templates deliver instant data analysis.
Cons:
- Enterprise Focus: Primarily designed for large networks, which may not suit smaller setups.
SolarWinds NetFlow Traffic Analyzer is one of the top Microsoft Network Monitor alternatives because it provides complete visibility over network users and protocols. It has the right balance of simplicity and customization to support most enterprises. Prices start at $1,945 (£1,516) You can download the 30-day free trial.
7. WinPcap
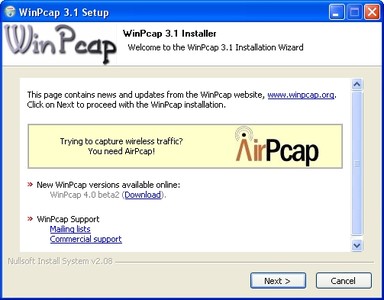
WinPcap is a packet analysis tool and a programming interface that can capture packets and then filter these packets according to rules. WinPcap’s filtering engine has been used by many of the top networking products including Wireshark and Nmap. The platform offers kernel-level filtering and partial packet copy to help the user monitor traffic more efficiently.
Key Features:
- Essential Packet Capture: Foundation for many network analysis tools, including Wireshark and Nmap.
- Efficient Traffic Monitoring: Offers kernel-level packet filtering for high performance.
Why do we recommend it?
WinPcap is a packet capture system. This is the actual packet sniffing mechanism that provides the Windows implementation of Wireshark with network packets. The Linux version of this system is called libpcap. There isn’t much to this tool because it is only intended to be used to capture packets.
One of the main advantages of working with WinPcap is the level of documentation there is available online. An extensive online user manual explains how to use the program and provides step-by-step tutorials. The high amount of resources is particularly useful to new users who want to learn how to use the program. However, it’s important to note that the program is no longer being maintained.
Who is it recommended for?
The WinPcap tool will show packets to the standard output or you can direct it to store packets in a file. The command line options allow you to focus on packets with specific characteristics. You can’t leave this utility running too long because it generates very large files.
Pros:
- Resource-Efficient: Minimal impact on system resources, ideal for continuous monitoring.
- Well-Documented: Extensive online documentation facilitates learning and troubleshooting.
- High Performance: Efficiently manages traffic monitoring, even on busy networks.
Cons:
- Discontinued Support: Lack of ongoing maintenance may pose compatibility issues.
- Professional Orientation: Targets users with technical expertise, may be challenging for novices.
WinPcap is essentially the Windows version of libpcap. It is recommended to users who want a basic, free packet capture solution. The solution is available for Windows NT4, 2000, XP, 2003, Vista, 2008, Win7, 2008 R2, and 8. You can download the program from this link here.
8. Colasoft Capsa
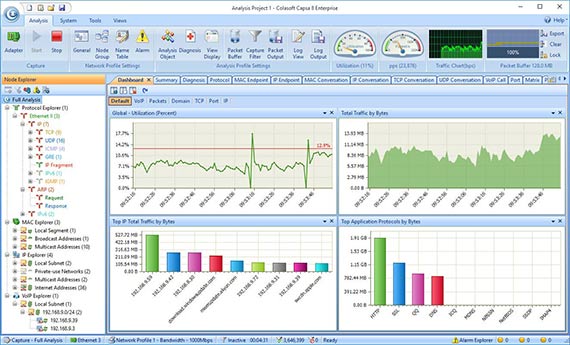
Colasoft Capsa is a free packet capture tool for Windows that allows you to monitor network performance in real-time. The software can monitor over 1800 different protocols giving you deep visibility into the conversations going on throughout your network. Through the dashboard, you can view an overview of performance with the assistance of charts and graphs.
Key Features:
- Windows Compatibility: Free network analysis tool designed specifically for Windows users.
- Extensive Protocol Support: Monitors over 1800 protocols, offering deep network insights.
- VoIP Performance Analysis: Specialized features for diagnosing VoIP call issues.
Why do we recommend it?
Collasoft Capsa is a network monitor that operates by scanning network packets. This is a little like a cross between the SolarWinds NetFlow Traffic Analyzer and Wireshark. The tool displays attractive and easy-to-read graphs and charts based on packet header data. The tool provides a nice combination of services.
The analysis features are wide-ranging. TCP flow analysis allows you to troubleshoot the cause of a slow network and VoIP analysis lets you analyze VoIP calls for performance issues. These give you the ability to take a microscope to the issues most relevant to your environment.
A key advantage of Colasoft Capsa has over Microsoft Network Monitor alternatives is its network security analysis capabilities. The tool can detect DoS attacks, worms, ARP attacks, TCP port scanning, and other malicious activities that could derail your network. You also have the assistance of email and audio alerts to let you know when something happens that needs your attention.
Who is it recommended for?
Colasoft Capsa is a free tool and you can set it up with analysis criteria, such as a specific protocol to look for, and then leave it running to observe traffic patterns over time. The tool also operates over wireless networks. This is a great tool for Windows, but it is probably too pricey for small businesses.
Pros:
- Comprehensive Monitoring: Capable of analyzing a wide array of network activities and protocols.
- Security Analysis: Detects network threats like DoS attacks and port scans, enhancing security posture.
- Intuitive Alerts: Provides immediate notifications for critical network events.
Cons:
- Complex Interface: Can become overwhelming when tracking extensive network data.
Colasoft Capsa is a solid packet capture tool for enterprises of all sizes. The free version called Capsa Free supports monitoring for up to 10 IP addresses. The paid version, Capsa Enterprise costs $995 (£776.04) and supports unlimited IP addresses. You can download the free trial.
9. tcpdump
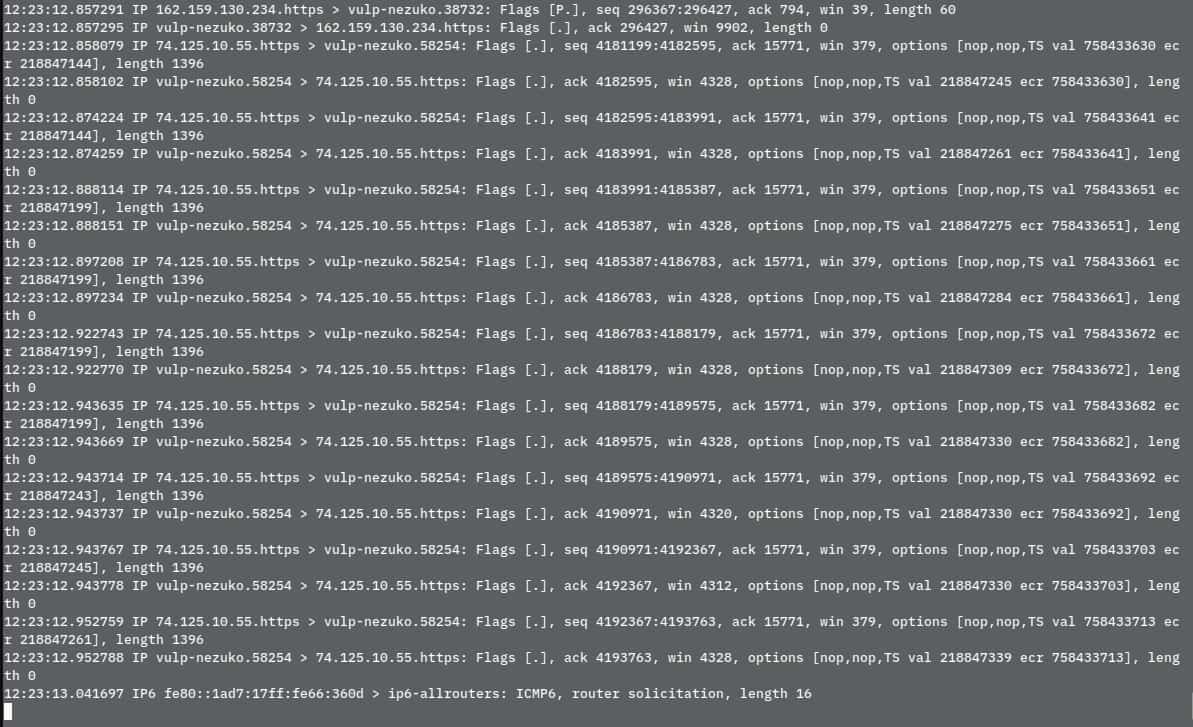
tcpdump is a packet analyzer for Linux that’s based through the command line. With tcpdump, you can run basic network scans. For example, you can scan network interfaces, save the captured packets, or capture only TCP / IP address packets.
Key Features
- Linux-Focused: Command-line packet analyzer designed for Linux and Unix systems.
- Versatile Capture Options: Captures packets live or saves for later analysis.
Why do we recommend it?
The tcpdump utility is similar to T-shar, the command line version of Wireshark. This packet analyzer runs at the command line and it operates on Linux and Unix operating systems. It uses libpcap libraries to capture packets. Effectively the purpose of this tool is to add a filtering language to the operations of libpcap.
Who is it recommended for?
tcpdump can show packets on the screen or write them to a file. You would probably use this tool to capture packets and then read them into another tool for analysis. There is a version for Windows available, called WinDump, which is based on WinPcap. This is a free utility.
Pros:
- Community-Supported: Benefits from a robust, open-source community for updates and support.
- Lightweight and Flexible: Command-line interface ensures minimal resource usage and adaptability.
- No Cost: Freely available, making it accessible to anyone with Linux or Unix.
Cons:
- User Experience: Lacks the ease of use found in graphical interfaces, requiring command-line proficiency.
- Specialized Filtering: Filtering language has a steep learning curve for newcomers.
tcpdump is suitable for those users who are looking for a classic packet analysis experience through the command line. If you prefer a GUI experience with more features then you’re better off trying another tool. The software is available with most Linux distributions but you can use source code as well. You can download the program here. be sure to download our tcpdump cheat sheet.
See also: What is tcpdump?
Choosing a Microsoft Network Monitor Alternative
Our editor’s choice is ManageEngine OpManager, followed by ManageEngine NetFlow Analyzer, Site24x7, Paessler PRTG Network Monitor, and Wireshark. All of these tools offer users an affordable option to monitor network packets with GUIs that offer the perspective to make sense of raw data. Other reliable tools include SolarWinds NetFlow Traffic Analyzer and Colasoft Capsa.
Related post: The Best Packet Capture Tools

