
Whether you’re a longstanding advocate for PRTG’s fresh-faced approach to network monitoring or not, it is undeniable that Paessler PRTG Network Monitor has produced one of the most comprehensive monitoring experiences to date. There are few tools that provide the blend of visibility, ease of use, and scalability that this program does. In this PRTG Network Monitor review, we’re going to look at what makes this product stand out from the crowd.
PRTG Network Monitor mixes autodiscovery, network monitoring, NetFlow analysis, cloud monitoring, VMware monitoring, and database monitoring into one package. It’s not a stretch to suggest that PRTG Network Monitor offers almost every monitoring environment you could possibly desire. In this article, we’re going to look at what PRTG Network Monitor has to offer.
| Feature | Description |
|---|---|
| Autodiscovery | Autodiscovery by IP range |
| Network Monitoring | Uses SNMP, WMI, and NetFlow |
| NetFlow Analysis | NetFlow, sFlow, jFlow, and IPFIX |
| Alerts | Email, SMS, Push notifications via Windows, Android and IOS App, and custom notification scripts |
| Reports | Schedulable reports available in HTML, PDF, CSV, and XML |
| Cloud Monitoring | Amazon CloudWatch Monitoring, Mail Server Monitoring, Microsoft OneDrive Monitoring, Dropbox Monitoring, Google Analytics Monitoring, and Google Drive Monitoring |
| VMWare Monitoring | VMware Virtual Machine Sensor, VMWare Host Hardware Sensor, VMWare Host Hardware Status Sensor, VMWare Datastore Sensor, and VMWare Host Performance Sensor |
| Pricing | See Pricing table below |
If you would like to follow along with the setup and steps below, you can download a fully working 30-day Free trial.
Setup
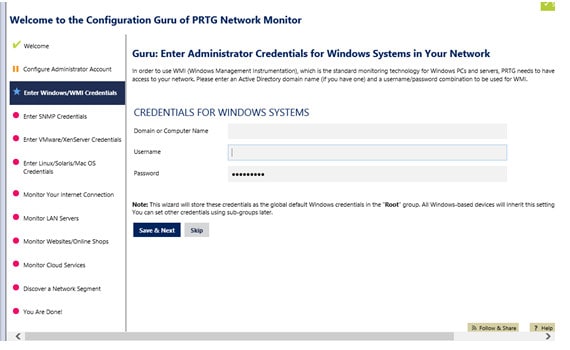
The setup process will be the first interaction you have with PRTG Network Monitor. Thankfully, the setup process doesn’t take too long to complete. PRTG Network Monitor has one core server which is fed by probes situated throughout your network. One of the best elements of the setup is that you don’t have to set up devices manually because there is an autodiscovery feature (this is discussed in more detail in the next section).
Setup-wise all you need is login credentials for each device and SNMP settings. This means that you can be up and running on PRTG Network Monitor relatively promptly and painlessly.
Autodiscovery
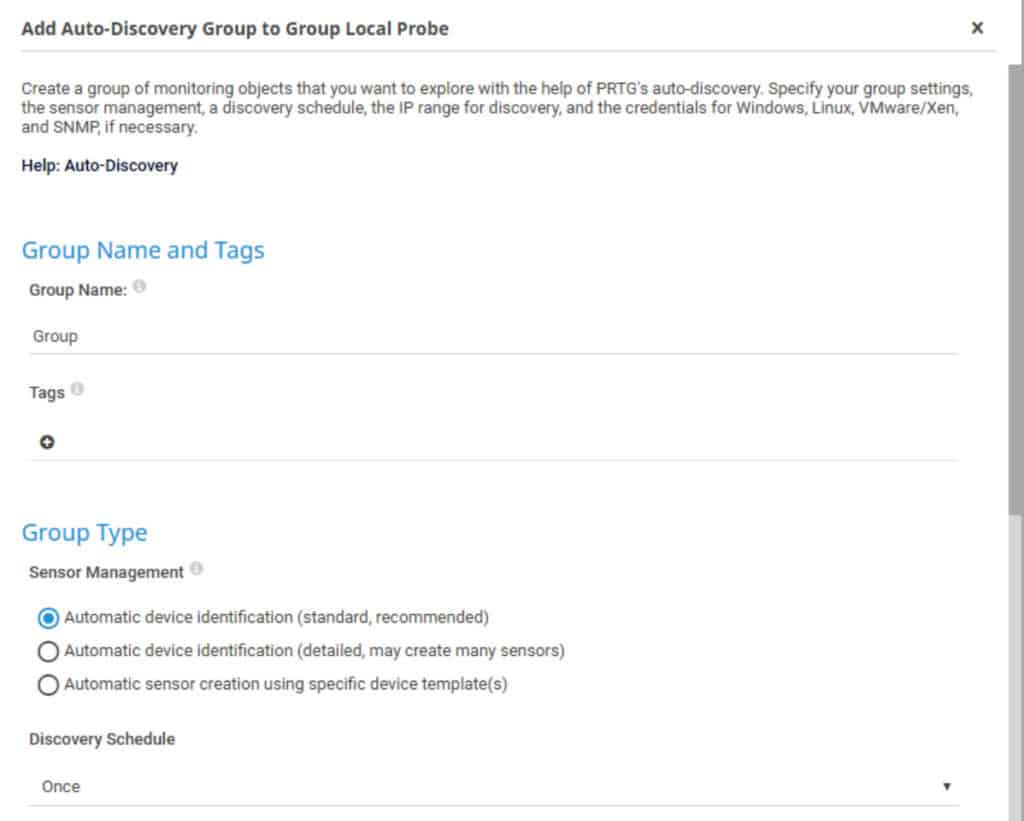
While the setup process is relatively simple, what really seals the deal on fast track deployment is autodiscovery. With autodiscovery, PRTG Network Monitor can scan your network via IP range. When it finds a device it is automatically added to your monitoring environment. The advantage of this is that you don’t have to manually configure devices on your network.
Dashboard
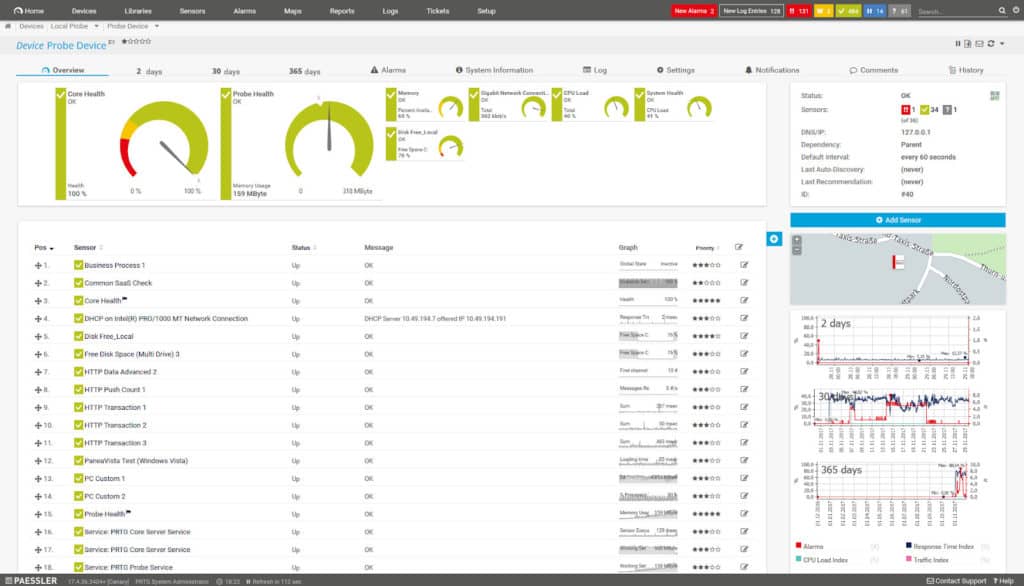
The dashboard is one of, if not the most important part of a network monitoring product. The pristine dashboard is where you’ll conduct 99% of your monitoring activity. Overall PRTG Network Monitor makes the time spent on the dashboard an enjoyable experience. The dashboard shows all your live usage data in real-time.
Key Features:
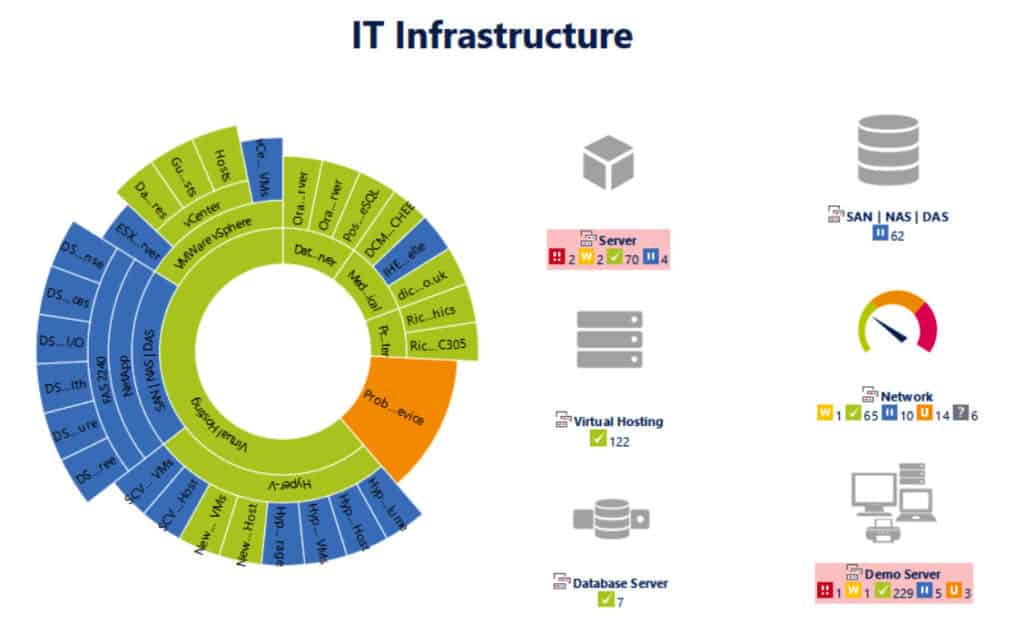
- Unified Monitoring View: Offers a single-pane view of the entire IT infrastructure for simplified visibility and management.
- Automated Network Discovery: Detects and maps devices and sensors across the network automatically.
- Customisable Visual Dashboards: Enables the creation of tailored dashboards and network maps to visualise system status.
- Instant Alerting: Sends immediate notifications via email, SMS, push notifications, and other channels.
- Detailed Reporting: Produces detailed, customisable reports in formats such as HTML, PDF, CSV, and XML.
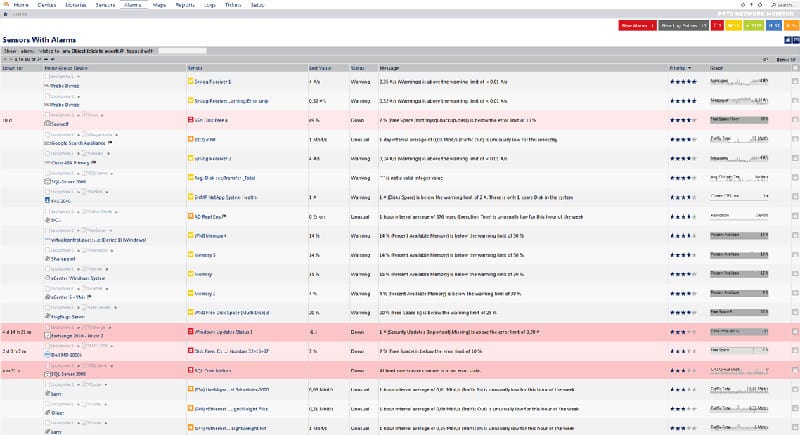
As you can see in the image above, the dashboard combines a mix of displays to view your data. In the top right-hand corner of the screen, you can see new alarms, log entries, critical devices, warning devices, and all up devices. Each of these is color-coded so that you can see them more easily. These colors are also used in the main screen display to denote the health status of each device. Red indicates that a device is in critical condition and needs immediate attention.
One of the most iconic displays offered in PRTG Network Monitor is its Maps view. The first time you use it, the map editor can be a little tricky to use if you don’t know HTML. However, once you get the hang of it you can create maps with multiple layers to view your connected devices. The PRTG Map can be seen in the picture below on the left-hand side:
Network Monitoring (Packet Loss Capabilities)
If you’re in the market for a network monitoring tool it goes without saying that a platform’s live network monitoring experience is paramount to being able to monitor your network effectively. This comes down to having the tools to monitoring your network just as much as the visibility of the program itself.
However, this is an area where PRTG Network Monitor excels. PRTG uses a combination of SNMP, NetFlow, and WMI to poll your infrastructure health and monitor your network bandwidth. These provide baseline capabilities which are invaluable when monitoring your network both generally and for dealing with more specific issues like packet loss.
Packet loss is where data is lost in transit due to a service interruption or fault. PRTG Network Monitor helps you to address packet loss by giving you all the tools you need to troubleshoot the problem. Whether packet loss is occurring as a result of bandwidth limitations or hardware issues, you’ll be able to tell very quickly if there is a problem.
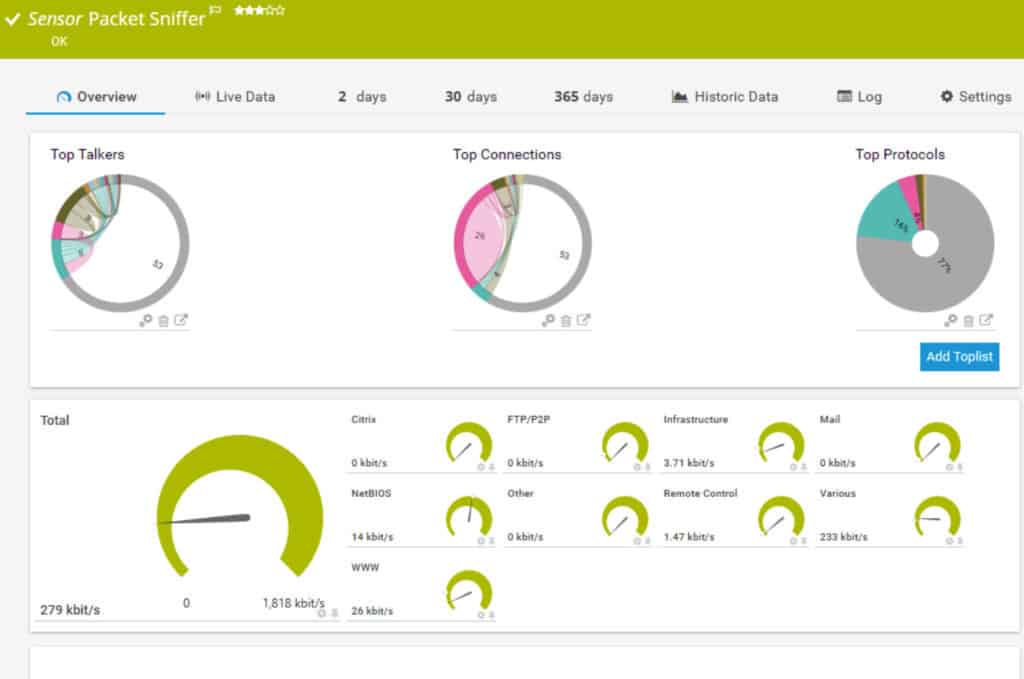
Key sensors like the Packet Sniffer Sensor, Cisco IP SLA Sensor, and QoS One Way Sensor all allow you to view how your network performs. For example, the Packet Sniffer Sensor allows you to view live and historical network data with the help of dials and pie charts. In a matter of seconds, you can see if there are any problems at hand. You can raise pie charts displaying data like Top Talkers, Top Connections, and Top Protocols to cut to the chase and see everything you need to make improvements.
See also:
Ultimate Guide to Packet loss
SNMP explained
NetFlow Analysis
NetFlow Analysis is another feature where PRTG Network Monitor performs well. PRTG Network Monitor can be used to monitor both your network bandwidth and traffic. This allows you to conduct vital quality of service monitoring and to see whether you need to upscale your internet service. In addition to being compatible with NetFlow, sFlow, jFlow, and IPFIX, PRTG Network Monitor also offers users a range of additional NetFlow sensors. These are listed below:
- NetFlow V5 Sensors
- NetFlow V9 Sensors
- IPFIX Sensors
Each of these provides you with a specific monitoring environment so that you can take a microscope to your NetFlow analysis activities. For instance, the NetFlow V5 sensor shows data from devices compatible with NetFlow. With this sensor you can view traffic types from IRC, AIM, FTP/P2P, DHCP, DNS, Ident, ICMP, SNMP, IMAP, POP3, SMTP, NetBios, RDP, SSH, Telnet, VNC, HTTP, HTTPS, UDP, and TCP. As you can see, this is a healthy range of traffic types that you can work with through this sensor alone.
Alerts
Alerts is one of those features that has become a necessity for larger networks. The days of manual monitoring are passing us by, and alerts are becoming one of the most common ways to automate the monitoring process. With PRTG Network Monitor you can opt to receive notifications when problematic or unusual behavior is detected on your network or device.
PRTG Network Monitor not only has the basics in the form of email and SMS notifications but also allows you to receive push notifications as well. So if you download the PRTG app for a Windows, iOS, or Android phone then you can have notifications sent straight to your phone. These apps are available for free so you don’t have to pay any extra to use them.
It is worth mentioning that PRTG Network Monitor’s alerts system also uses an API whereby you can write custom notification scripts. This allows you to decide what information you see when you first respond to a new network issue. This is invaluable for allowing you to respond to performance issues with the right information on hand to help you.
Reports
There are many occasions when monitoring an active network when you’ll want to slow things down to look for more specific trends. Generating reports is the perfect way to do this. With a report, you can generate a document that allows you (and other members of your team) to monitor your network more closely. On PRTG Network Monitor you can generate historic reports over a time period of your choosing. You can choose between monitoring a day, month, or an entire year (you can also monitor multiple days if required).
Reports are generated in HTML, PDF, CSV, and XML. You can also schedule report generation when you want. Whether you opt for daily or monthly reports you don’t have to manually request a report each time you need one. However, even the manual reporting process is simple as can open the Reports page, open an assistant and add a new report.
Cloud Monitoring
As modern network setups become more complex, cloud monitoring is something that has become much more important to a variety of organizations. PRTG Network Monitor has kept this in mind and provided a number of features designed to aid users attempting to monitor cloud-driven environments. Out of the box, PRTG Network Monitor offers Amazon Cloudwatch Monitoring, Mail Server Monitoring, Microsoft OneDrive Monitoring, Dropbox Monitoring, Google Analytics Monitoring, and Google Drive Monitoring.
When it comes to determining the response time of cloud services, you can use the PRTG Cloud HTTP Sensor. With PRTG Cloud HTTP Sensor you can use a PRTG network cloud to see how fast your service responds. The PRTG cloud can be found in the USA, Europe, and Asia. The widespread geography of the PRTG Cloud HTTP Sensor means that it covers most cloud services around the world.
Alternatively, you can use the Cloud Ping Sensor to monitor the Ping times of your server. These can be found in Tokyo, Ireland, North Virginia, and Oregon. While this doesn’t have as wide a geographical spread as the HTTP sensor, it complements the existing coverage nicely.
Amazon CloudWatch Monitoring
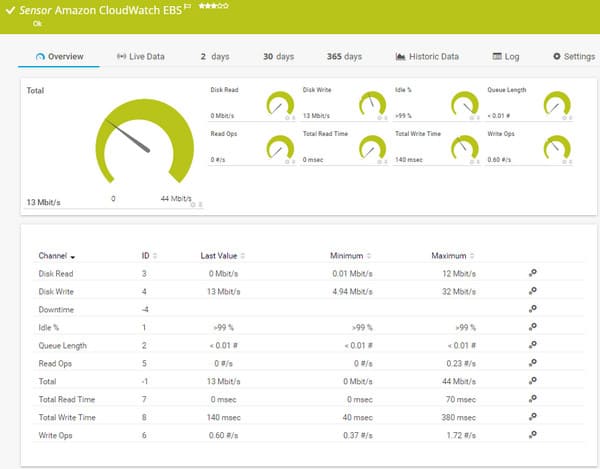
It is also worth taking a deeper look at Amazon CloudWatch Monitoring as PRTG Network Monitor offers a number of CloudWatch sensors that are incredibly useful. In the image above you can see the Amazon CloudWatch EBS Sensor display. We have listed PRTG Network Monitor’sCloudWatch sensors below:
| Amazon Cloudwatch Sensor | Purpose |
|---|---|
| Amazon CloudWatch EBS | Monitors performance of the Amazon Elastic Book Store |
| Amazon CloudWatch EC2 | Monitors performance of the Amazon Elastic Compute Cloud |
| Amazon CloudWatch ElastiCache | Monitors performance of the Amazon ElastiCache cloud service |
| Amazon CloudWatch ELB | Monitors performance of the Amazon Elastic Load Balancing Service |
| Amazon CloudWatch RDS | Monitors the performance of the Amazon Relational Database Service |
| Amazon CloudWatch SNS | Monitors the performance of the Amazon Simple Notification Service |
| Amazon CloudWatch SQS | Monitors the performance of the Amazon Simple Queue Service |
VMWare Monitoring
No less important than cloud services is that of VMware Monitoring. The growth in virtual machines across enterprise networks has been pronounced, and this is a trend for which PRTG has seen fit to provide support. If you’re using a virtual environment you can use PRTG Network Monitor to monitor key metrics like memory usage, CPU, and disk speed. In other words, you can see how a virtual service is performing without having to search through many options.
We’ve provided a table of specific VMWare Monitoring sensors below:
| Sensor | Purpose |
|---|---|
| VMWare Virtual Machine Sensor | Uses Simple Object Access Protocol (SOAP) to monitor a virtual machine |
| VMWare Host Hardware Sensor | Monitors performance of an ESX/ESXi server. |
| VMWare Host Hardware Status Sensor | Monitors performance of your host system. |
| VMWare Datastore Sensor | Monitors hard drive usage and data store status |
| VMWare Host Performance Sensor | Monitors a host server with SOAP |
Database Monitoring
PRTG Network Monitor also has its own database monitoring features that allow you to monitor popular databases like Microsoft SQL, Oracle SQL, MySQL, and Postgre SQL. The database monitoring experience delivered by PRTG Network Monitor has been designed to minimize query and return times. This means that you have a continually up-to-date view of your database.
The alarm system is also very useful as it notifies you in the event that an error occurs or a database has limited disk space or memory. This allows you to take action immediately for a specific problem rather than having to run further diagnostics.
However, what really makes PRTG Network Monitor’s database monitoring great, is its predefined sensors. There are over 200 database monitoring sensors for the most well-known providers on the market. Names such as Microsoft, Oracle, and IBM are all covered with their own sensors on the PRTG Network Monitor. This means that you’re ready to start monitoring a variety of databases straight out of the box without having to run complex configurations.
Security
Although not specifically designed for security, it is worth noting that PRTG Network Monitor has its own cluster failover solution. This means that if the central node of a cluster goes down then the service is taken over by another node. The fancy phrase for this is failover tolerant monitoring. If you’ve purchased an on-premises license of PRTG Network then one cluster failover is included by default.
Another way that PRTG Network Monitor supports network security is via its Firewall Monitoring capabilities. PRTG Network Monitor analyzes your network traffic and sends you notifications if the status of your firewall changes. This means that if your firewall goes down without warning, you’ll be notified immediately so you can take action quickly.
In practice, this helps you to stay online because it provides you with an opportunity to respond quickly if your system has been compromised. Without this, your system would be left defenseless against external threats with no firewall. You can also see other useful data such as most-used connections, most active senders, and most used protocols through NetFlow to see if there’s any unusual activity occurring.
Pros & Cons
Pros:
- Scalable Distributed Monitoring: Supports monitoring across multiple remote sites and distributed environments.
- Flexible Pricing Structure: Offers transparent pricing with subscription options suited to different budgets and organisation sizes.
- Easy-to-Use Interface: Simple to install, configure, and operate, with access via web, desktop, and mobile platforms.
- On-Premises Deployment: Can be installed directly on your own infrastructure for full control over data and configuration.
- Cloud-Based Option: Paessler PRTG also provides a hosted SaaS version for added flexibility.
Cons:
- Narrow Functional Scope: PRTG is focused exclusively on monitoring and does not include broader system management capabilities.
Pricing
The flexible pricing structure of PRTG is one of the reasons why it has become a stand out product. The price structure ranges by sensors and is suitable for both small and large organizations. The price structure is shown below:
| Sensors | Price |
|---|---|
| 100 | Free |
| 500 | $1,600 (£1,253) |
| 1000 | $2,850 (£2,232) |
| 2500 | $5,950 (£4,661) |
| 5000 | $10,500 (£8,226) |
| Unlimited | $14,500 (£11,360) |
As you can see, there is a freeware version that acts as a convenient stepping-stone product for smaller companies. It offers a chance to try out the program without making the financial commitment to a larger purchase. The first paid version also offers a competitive price point of $1600 (£1,253) which is significantly lower than many other top-of-the-range network monitoring products.
At the other end of the scale, even the largest organizations are supported by the XL1 edition of PRTG Network Monitor which offers unlimited sensors for $14500 (£11,360). While most organizations won’t need this many it is good that there is no cap on monitoring ability.
PRTG Network Monitor Review Verdict: Believe the Hype
PRTG Network Monitor is a product that carries a lot of name recognition and fully lives up to the hype that surrounds it. It offers one of the most cost-effective, scalable, and versatile network monitoring systems available on the market. From the simple setup process and autodiscovery to scheduling reports, PRTG Network Monitor offers a monitoring experience that even newbies can get the most of.
Viewing your network usage data through the dashboard is very easy to do and the user interface is PRTG Network Monitor’s most compelling feature. Whether you’re monitoring your network bandwidth, cloud services, or VMware technology the process is much the same. The result is a network monitoring experience that provides just as strong an experience in distributed computing environments as it does on traditional networking environments.
Whether you are a SME looking for your first network monitoring tool or a multinational looking for a tool that enshrines scalability, PRTG Network Monitor is the product for you. You’ll be hard-pressed to find a solution that provides the diverse functionality of this product for a better price. If you’d like to try out Paessler’s PRTG Network Monitor we recommend you download the free trial before making a purchase.
