

SQL performance tuning is a marathon and not a sprint. Staving off performance degradation comes down to consistent long term tuning. The moment performance starts lagging behind your users are going to notice.
Performance tuning helps you to avoid the tragedy of dissatisfied customers and deliver a better user experience. In this article, we’re going to look at what SQL performance tuning is, and some areas you should be aware of when trying to improve your server’s performance including:
- Using an SQL monitoring tool to monitor performance
- Improving indexes
- SQL Server deadlocks
- Reducing query runtime
What is SQL Performance Tuning?
SQL performance tuning is the process of improving the performance of SQL statements. You want to make sure that SQL statements run as fast as possible. Fast and efficient statements take up fewer hardware resources and perform better. In contrast, an unoptimized inefficient statement will take longer to complete and take up more computing power.
Inefficient use of computing power means that the database will take longer to respond to user requests. In practice, that means that whenever a user interacts with the interface the response time will be higher as the database tries to find the necessary information. Network administrators and developers regularly use performance tuning to improve database performance and maintain a premium user experience.
What Causes Poor SQL Server Performance?
There are many reasons why a SQL server may be running slow. Factors from slow queries to performance bottlenecks, virtualized resource contention, and hardware limitations all contribute to poor performance. However, finding the root cause of a slow server is complex because of the large list of potential culprits.
Most of the time, poor performance is related to badly written queries and indexing making inefficient use of resources rather than hardware limitations. Unfortunately, it can be difficult to work out what’s causing the problem without a significant investment of time and effort.
To speed up the diagnostic process of discovering SQL’s performance issues it is advisable to use a performance monitoring tool. A database monitor will enable you to look deeper into the cause of poor performance and deliver a better end-user experience for your customers.
Use an SQL Performance Monitor to Monitor Performance and Identify SQL bottlenecks
SolarWinds Database Performance Analyzer
SolarWinds Database Performance Analyzer (DPA) is a robust SQL performance tuning tool that helps database administrators (DBAs) and IT professionals optimize the performance of databases across various environments, including on-premises, cloud, and hybrid setups. Its capabilities are designed to reduce downtime, enhance query performance, and ensure the stability of mission-critical applications.
Key Features:
- Query Performance Analyzer: Helps trace, analyze, and improve queries and indexes.
- Cross-Platform Support: Monitors and optimizes SQL databases across various platforms, including Oracle, SQL Server, PostgreSQL, MySQL, and more.
- Response Time Analysis: Measures the time spent on query execution to identify bottlenecks and prioritize actions based on their impact on end-users.
- Database Anomaly Detection: Uses machine learning to detect unusual behavior patterns and alert you to potential issues.
- Expert Tuning Advisors: Provides expert advice and recommendations for improving database performance.
Why do we recommend it?
SolarWinds Database Performance Analyzer leverages advanced monitoring techniques to provide in-depth visibility into database performance. It identifies bottlenecks by pinpointing queries and operations that consume the most resources, such as CPU, memory, or I/O. The tool uses machine learning anomaly detection that identifies unusual behavior in real-time, enabling proactive troubleshooting.
The tool provides expert tuning recommendations with specific advice on optimizing queries and tables, streamlining the resolution of complex performance issues. Customizable alerts ensure DBAs are promptly notified of critical incidents while minimizing alert fatigue by focusing only on relevant metrics. The package also allows users to track historical performance trends, offering actionable insights for long-term optimization and capacity planning.
Who is it recommended for?
This system has an agentless architecture, which minimizes the performance impact on monitored systems. This lightweight approach means that the tool’s resource usage is low, making it ideal for high-demand environments. The tool supports various database platforms, including SQL Server, MySQL, Oracle, PostgreSQL, and cloud-based systems like AWS RDS and Azure SQL.
Pros:
- Virtualized Database Monitoring: Monitors performance for virtualized databases, including VMware vSphere.
- Comprehensive Dashboards: Offers intuitive, easy-to-use dashboards for real-time and historical performance analysis.
- Historical Trend Analysis: Tracks performance trends over time, helping you understand long-term patterns and plan for capacity and resource allocation.
- Customizable Alerts: Allows you to set up custom alerts based on specific thresholds and conditions to stay informed about performance issues in real time.
- Cloud Database Support: Supports databases running on cloud platforms like Azure, AWS, and Google Cloud.
Cons:
- An on-premises software package: No cloud-based SaaS option.
SolarWinds Database Performance Analyzer is a software package for Windows Server. It is available for a 14-day free trial.
SQL bottlenecks are one of the most pervasive issues you’ll face when managing databases. What makes bottlenecks tricky is that there are various ways that they can be manifested. There are four types of bottlenecks that can affect the performance of a server: memory, disk, CPU, and the network itself.
Managing bottlenecks becomes even more difficult if you have multiple bottlenecks active at the same time. For example, if you have limited disk resources and memory you’re likely to find a higher CPU utilization as well.
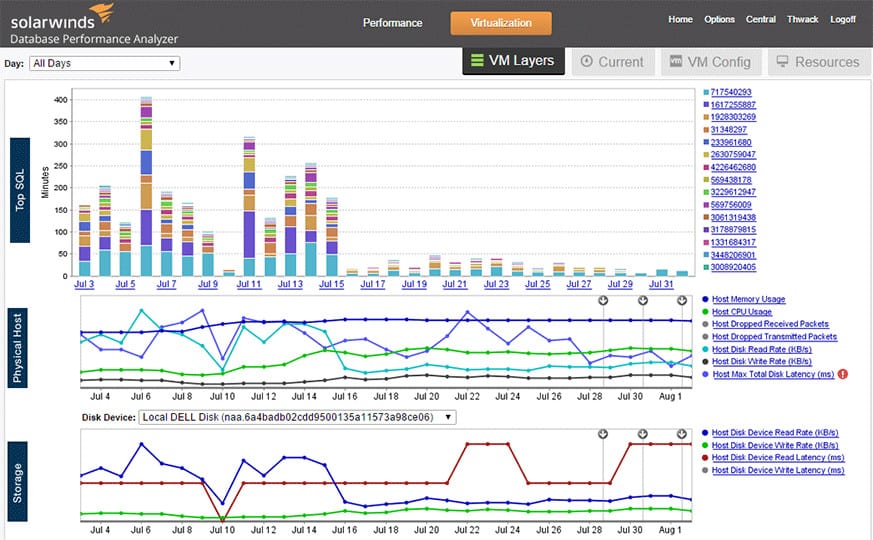
SolarWinds Database Performance Analyzer helps you to identify the root cause of active bottlenecks. The platform’s SQL performance analyzer uses data on wait types, SQL statements, activity, and more to monitor real-time performance. You can also view the wait types/events that are behind the bottlenecks.
For general performance tuning, you also have a variety of guidance to help you tune statements. For example, there is a ‘Worst-performing SQL statements’ view. By having this information on hand you can start to make tangible changes to your performance tuning strategy and improve the experience of your end-users.
Tuning to Reduce Query Runtime
As discussed above, query run time is an important consideration when trying to maintain SQL performance, the longer a query runs the more resources the hardware has to use to process the request. Reducing the query run time will allow you to get more mileage out of your hardware, and support better database performance.
There are three main factors that increase the query run time: tablesize, joins, and aggregations. If a query needs to interact with a table that has too many rows then the software will need to work harder to process that query. Likewise, if your query joins multiple tables together this is going to affect performance. Similarly queries that use aggregations to generate a result also require more resources.
It is important to note that the runtime of a query can also be increased if lots of other users are running queries at the same time. Every query takes up hardware resources. As a consequence, the more queries the database attempts to process, the slower the runtime will be.
If you want to improve performance and cut query run time then reducing the table size is one of the simplest things you can do. Likewise, when querying a time frame keep the window as narrow as possible. For example, if you need to measure database data over a period of time opt for a brief time frame like a 24-hour period so that the hardware doesn’t have to process as much data.
Another thing you can do is upgrade your memory. If you don’t have the computing resources available to manage a large database, tuning won’t be enough to deliver good performance. Upgrading memory helps to make sure you have more resources on hand.
Related post: Best SQL Query Builders
SQL Server Deadlocks
Deadlocks are another performance issue that network administrators and developers have to manage. A deadlock is where two processes are competing for access to a resource. The two processes block each other so neither can access the resource. In other words, a deadlock is a cyclical dependency that is caused by application code.
To eliminate a server deadlock, the administrator needs to terminate one of the processes. SQL Server has a lock manager that automatically searches for deadlocks every five seconds.
When SQL Server detects a deadlock it chooses a transaction to shut down. By shutting down one of the transactions the deadlock is lifted so the other process can access the resource that was originally blocked.
SQL Server chooses which process gets shut down based on a deadlock priority. The deadlock priority can be set by the user with the following command:
SET DEADLOCK_PRIORITY LOW;
There are four priority levels; LOW, NORMAL, HIGH, <numeric>. LOW has a value of -5, NORMAL has a value of 0, and HIGH has a value of 5. The setting allows you to assign a value between -10 or 10.
SQL server terminates the process with the lowest deadlock priority level. So if you entered the LOW command to assign a low priority to a process and the other process had a priority of Normal or HIGH, the LOW priority process would be terminated.
It is important to note that solving deadlocks goes well beyond deadlock priority sections. Deadlocks can be an incredibly complex issue to solve (particularly if you need to go through the application code with the help of a developer!).
Improve Indexes
Indexes are a useful tool at your disposal for increasing query efficiency. An index is a data structure that you can use to pull information from the database faster. To use indexes to boost performance you want to: use lots of indexes in tables, avoid indexes that frequently update, and use non-clustered indexes to reduce the query execution time.
To help along the process of index design you can use SQL Profiler to identify queries with sub-par performance. SQL Profiler will tell you the number of read and write operations it takes to complete a query and how long the query takes to complete. Load up the profiler on a remote computer and find queries that take a long time to complete. These queries will be the ones you want to tweak until the run-time decreases.
Alternatively, you can use the Index Tuning Wizard to recommend indexes for you to use. Tuning Wizard is a software wizard for SQL which provides you with recommendations based on what you’re looking to achieve. You can use the output data you obtained with SQL Profiler to supply Index Tuning Wizard with information to monitor. Monitor the execution time of queries and keep an eye open for inefficient operations.
A Touch of SQL Tuning A Day Keeps Poor Performance Away
User performance expectations are more unforgiving than ever before. It only takes a slight delay to send users running to the hills. Proactively tuning SQL databases is necessary to eliminate latency and deliver the responsive experience that modern users demand.
While monitoring SQL performance is an ongoing process one of the best ways to start is by using a database monitoring platform. Database monitoring software will provide more visibility and point you in the direction of specific issues to improve.
From then onward, there are 101 ways to improve query performance. If you’re new to SQL try not to be disillusioned and focus on making one small improvement at a time. If you start off with the basics like reducing table sizes to build your confidence you can start to take more complicated steps further down the line.
SQL Performance Tuning FAQs
How can we do performance tuning in SQL?
Here are four tips for SQL performance tuning:
- Use an SQL monitoring tool to monitor performance
- Improve indexes
- Prevent resource deadlocks
- Reduce query execution time
How do I make my SQL query run faster?
Try these four steps to make SQL queries run faster:
- Expand server memory
- Partition tables
- Remove outer joins
- Reorganize joins to filter out the most records first
- Ensure that joins hit indexes
- Remove wildcards in the column list
What is database performance tuning?
Database performance tuning involves database object improvement by examining indexes, views, and table normalization. SQL queries should be written in a way that makes optimum use of database structures, such as indexes.

