
Server management and monitoring are essential practices for ensuring the smooth operation, security, and performance of a network infrastructure. As businesses increasingly rely on servers to host applications, websites, and critical data, effective management and monitoring become key to preventing downtime, identifying potential vulnerabilities, and ensuring compliance with performance standards.
Server Management refers to the overall process of configuring, maintaining, and managing a server’s software, hardware, and network resources. This involves tasks like setting up server environments, installing software, ensuring security patches are applied, managing user access and permissions, and ensuring proper backups are in place.
Proper server management also includes optimizing server performance through resource allocation and regular maintenance, such as disk cleanup and hardware upgrades. Additionally, administrators must handle server security by implementing firewalls, intrusion detection systems, and securing data transmission protocols to protect sensitive information.
Server Monitoring, on the other hand, involves continuously tracking the performance, health, and availability of servers. It helps administrators detect potential issues before they become critical problems. Monitoring tools can track key metrics such as CPU usage, memory utilization, disk space, network traffic, and uptime.
These tools provide real-time alerts on performance degradation, hardware failures, or security breaches. By closely monitoring server logs and traffic patterns, system administrators can detect unusual activities, such as unauthorized access attempts, system errors, or malware infections.
Effective server management and monitoring tools are critical for maintaining a secure and high-performing IT environment. Proactive monitoring ensures that potential issues are identified early and addressed before they disrupt operations. Combined with a solid management strategy, these tools help organizations reduce downtime, improve security, and optimize resource utilization, thereby ensuring the smooth and secure operation of their infrastructure.
Here’s our list of the best server management software and monitoring tools:
- NinjaOne EDITOR’S CHOICE – formerly NinjaRMM – an IT asset management system that covers servers and other endpoints plus networks and is aimed at managed service providers. This is a cloud-based service. Get a 14-day free trial.
- Paessler PRTG Network Monitor (FREE TRIAL) This is a unified network, server, and application tool that monitors the CPU capacity, memory usage, disk status and performance, fan status, and power supply health of your servers. Download a 30-day free trial.
- Atera (FREE TRIAL) A cloud-based platform for managed service providers that includes network, server, and application management features. Get access to the free trial.
- ManageEngine OpManager (FREE TRIAL) A monitoring service for networks and servers that includes performance thresholds for all key server resource metrics. Available for Windows Server and Linux. Start 30-day free trial.
- Site24x7 Server Monitoring (FREE TRIAL) Cloud-based system that can monitor a wide range of servers including Windows and Linux based servers and more, VMware and Docker and more environments along with dozens of plugins.
- ManageEngine Applications Manager (FREE TRIAL) This application’s monitoring software also covers server health and gives live statuses on CPU utilization, disk performance and capacity, memory usage, and I/O performance.
- Checkmk A monitor for networks, servers, and applications whether they are on site or in the Cloud. Available in free and paid versions. Installs on Linux.
- Nagios XI A network monitoring system that also covers applications and servers. You can opt for a free version, called Nagios Core.
- SolarWinds Server & Application Monitor A server monitor that covers Dell PowerEdge servers, HP ProLiant servers, IBM eServer xSeries servers, Dell PowerEdge Blade racks, HP BladeSystem enclosures, Microsoft Windows Server, and VMware vSphere hypervisors.
- Icinga This tool is an adaptation of Nagios Core and is free to use.
- N-able N-sight A remote monitoring and management tool that includes the ability to monitor and maintain servers.
- Zabbix A free system monitor that tracks CPU operations, memory utilization, I/O error rates, disk space, fan status, temperature, and power supply performance on your servers.
- OP5 A server monitor that enables capacity planning and trend analysis.
- Motadata A network, server, and application monitoring tool that tracks disk volumes and spare capacity, CPU usage, and memory utilization.
Logging into each server in turn and manually checking performance is very time-consuming. This is why server management software and monitoring tools have become so important. Remote server administration tools will enable you to manage servers on several sites and improve your efficiency.
Types of servers
The term “server” is a blanket term that covers a wide range of operations. You could have a network-attached storage/file server, a web server, an application server, and an email server in your network. The key performance management metrics that you need to keep control of in each of these cases are different.
If you factor in cloud services, your web, mail, application, and storage servers might all be offsite and in the ownership of another company. So, keeping track of all of the servers that you will end up with when they are in several different locations can be a nightmare.
Related post: File Activity Monitoring
Server monitoring
Getting a unified interface in order to monitor all of your servers from one location should be a priority. You have two main elements to watch on a server: the hardware and the software. You need a server monitoring tool that can give you live data on hardware performance, such as disk space, CPU and memory utilization, but you also need to see which processes are operating on the server and how many resources each process instance consumes.
Although at least one member of the team will have the server monitor open all the time, you can’t really expect to dedicate human resources to have one person sitting looking at the server monitor dashboard around the clock. You need a server monitoring tool that combines routine collection of live data, with status assessment to provide alerts. Automated alerts will remove the need to chain someone to a desk. A system that includes the notification of alerts via SMS or email will make your job a whole lot easier.
Keep on top of hardware utilization to head off performance issues. So, getting a view on real-time process volumes will give you the ability to predict and adjust your capacity requirements.
Server management
Capacity planning takes you into server management issues. To better serve the company, its shareholders, and its customers, your server capacity should have some spare room to account for surges in demand, without being over-provisioned, which would cause unnecessary expense.
It is difficult to consider server requirements without also considering other equipment, such as your physical or virtual network, power supply, housing equipment, and staff availability. All the different variables that make your business unique mean that there is no single server management solution and monitoring package that is the best for every company out there.
Hardware availability and location are important factors for a systems manager to keep an eye on. Software license expiration, patch management, and the prevention of unauthorized software installations are other server administration tasks that fall into the management role.
Server administration roles
The server management functions of a system administrator’s duties fall into the remit of senior staff. Many server monitoring and maintenance checks can be allocated to junior staff, or completely automated.
So, depending on the size of your company and the size of your systems administration team, the ability to define user roles and limit access to system data will vary in importance. If you are a small business with very few servers and only one person in charge of managing them, you may only need one user role and one user account for your server monitoring tool. If you have a large team and need to allocate specialist tasks to each employee, then access management functions become a priority. Full management of your servers requires a range of server administration tools. If you need to engage in remote server administration, you will need to expand your management tools shopping list even further.
Server tool selection
Look for the following factors when choosing server management software and monitoring tools:
- Multi-vendor interoperability Although you may be happy with your current hardware provider, it is probably a mistake to tie yourself into a monitoring system that is dependent on one manufacturer. So even if you already have all your equipment from one brand, create flexibility for the future to give yourself options.
- Information to match your requirements Try to fit the server management tool to your current server monitoring requirements. Although there are some very comprehensive server management packages out there, you shouldn’t be tempted to buy utilities that you are never going to use. If you have just a small system that you manage by yourself and buy a monitoring package that is tailored towards large team-managed systems, you may have to visit so many different screens to get so little information that you need that you end up abandoning the software.
- Scalability If you operate a small business, look for a cut-down version of a big system manager package. This will enable you to upgrade the server monitoring tool as your company expands. If you buy a package from a company that only caters to small companies, you will have to switch providers at some point and learn how to do your job with a whole new monitoring tool.
- Process automation A tool that just shows you what your server is doing is not good enough. You need your server monitoring system to take care of routine server administration tasks automatically. In this instance, the human intervention of these tasks is reduced to checking the logs. Such a job creates a great training opportunity for an intern and frees up your time for more important tasks.
- Roles definition Even if you are a sole system administrator, the ability to create roles to grant partial access to the dashboard of your server monitoring system can be very useful. Creating roles means you can grant report access to management staff and let them answer their own questions. Someday, you might take on an assistant, and you will need that junior help to get access to some part of the system, without getting at the controls of your management tool.
- Customizable functions and reports No matter how well-organized a server management tool is, you will always find that you wish you could move a column on a report, or switch out part of the data for another piece of information. Similarly, the ability to customize the dashboard to get your most important metrics in a prominent position is a time-saving necessity.
- Overheads Server management tools vendors are usually very open about the size of the company that their software is suitable for. Some vendors try to cater to everyone, but, ultimately, their software was written to work best for a specific size of the enterprise. You don’t want your monitoring system to slow down the server or generate too much network traffic. The only way you will really know whether a package is suitable for your business is to try it out. Fortunately, many vendors offer trial periods.
The best Server Management and Monitoring Tools
With the above criteria in mind, we have put together a list of the ten best server management and monitoring tools on the market today.
Our methodology for selecting server management and monitoring tools
We reviewed the market for server management and monitoring software and analyzed the options based on the following criteria:
- A system that focuses on server monitoring and has extra features for system management
- Automated server cleanup processes to free up memory and disk space
- A live monitor to track the availability and potential demand for server resources
- The ability to monitor applications running on the server
- System alerts to warn of potential resource exhaustion
- A free trial for a no-risk assessment period or a tool that is free to use
- An extensive package of useful tools at a good price or a free monitoring system that is worth installing
The list includes systems that are suitable for small businesses and others that are better for large corporations. You will read about on-premises software and also cloud solutions.
1. NinjaOne (FREE TRIAL)

NinjaOne – formerly NinjaRMM – is a package of system monitoring and management tools that are suitable for use by the technicians of a managed service provider (MSP). This service is also a good option for the IT operations departments of large multi-site businesses. Its purpose is to perform time-saving automated monitoring of remote sites and it also includes services to automate server management. G2, a trusted name in software reviews, has consecutively identified NinjaOne as a front-runner in its segment.
Key Features:
- Designed for Managed Service Providers: Can also be used by IT departments
- Includes Automated Patching Routines: Also maintenance script
- Alerts for System Problems: Automates network and endpoint monitoring
Why do we recommend it?
NinjaOne is a SaaS platform that provides remote monitoring management for endpoints (Windows, macOS, and Linux), networks, and applications. It can monitor cloud platforms and virtualizations. This platform includes a patch manager, automated monitoring, and remote access utilities. NinjaOne provides security monitoring and management including antivirus software and a backup and recovery service.
Businesses that run teams of technicians get the most out of the NinjaOne system because it also includes team management tools. Wherever possible, the system offers automated processes but manual actions are all recorded so that every second can be billed for to the right client.
The monitoring service in the NinjaOne platform includes performance and resource usage thresholds. These are set at levels that technicians have time to intervene and head off disaster. When a threshold is crossed, the technician team gets notified by an alert. Therefore, managers know that if no alert arrives, that client’s system servers are running OK.
The management features in NinjaOne start with a system discovery service. This is continuous, so any new equipment that is added by the client gets noticed. Each device is identified by make, model, and age. Enrolled servers are scanned for the creation of a software inventory. This includes version numbers.
The NinjaOne’s endpoint management features include an automated patch manager. This looks through the software inventories on the site and checks whether new versions of software packages and operating systems are available in the form of updates and patches. If patches are available, the system copies over the installers and queues up the patch rollout for the next available maintenance window. The patching process can be carried out unattended, which is another time-saver that cuts staffing costs for the MSP.
NinjaOne is able to supervise endpoints running Windows, macOS, and Linux. However, it is able to monitor network devices, such as printers, switches, routers, and firewalls. The service will also include the management of cloud resources. Cloud monitoring extends to Web servers and the performance of websites.

Who is it recommended for?
NinjaOne is suitable for MSPs and IT departments. The package includes a Help Desk ticketing system. NinjaOne doesn’t publish its prices or plans. So, it is difficult to work out the suitability of this package for small businesses. However, it is a great option for mid-sized and large organizations.
Pros:
- Full Stack Observability: Monitors networks, endpoints, and applications
- Multi-Tenant Accounts: Create sub-accounts for data about client sites
- A Remote Access Utility with Remote Control: Allows technicians to troubleshoot
Cons:
- No Price List: Request a quote
NinjaOne doesn’t publish a price list. You need to contact the company’s Sales Department to request a quote. The NinjaRMM service is a SaaS system, so it includes processing power and storage space for patch installers and log files. Its cloud base makes it possible to bind together a scattered team, so your technicians don’t all have to be sitting in the same room. The dashboard is accessed through any standard browser from anywhere. The service is available on a 14-day free trial.
EDITOR'S CHOICE
NinjaOne is our top pick for a server management and monitoring tool because this package includes a high degree of automation of all aspects of system management, saving time and money for IT support teams. The package is available in a multi-tenant configuration that is suitable for use by managed service providers when running the IT systems of clients. The server monitoring package includes a series of performance thresholds that will raise an alert if a resource runs short or if response times become unacceptable. Server maintenance services include an automated patch manager. This will scan all endpoints and identify an inventory of software. Regular checks with the providers of registered software result in the download of patch installers. These are scheduled for rollout according to a maintenance schedule in the console that an administrator needs to set up. The patch manager logs all of its activities so technicians can let the patcher run unattended and then check on completion statuses later. The NinjaOne package is delivered from the cloud and includes a ticketing system.
Download: Get a 14-day free trial
Official Site: https://www.ninjaone.com/freetrialform
OS: Cloud based
2. Paessler PRTG Network Monitor (FREE TRIAL)
Paessler PRTG Network Monitor is a very comprehensive infrastructure monitoring system that even comes in a free version. The freeware option has a limit of 100 sensors, but otherwise contains all of the options presented by the paid system. This is one that small businesses have to be very careful about because the package includes so many features that you could end up spending all day playing around with it and not actually get any work done. So, choosing this option requires a lot of planning and discipline if you are just a small enterprise with very few facilities to monitor.
Key Features:
- Full Stack Observability: Monitors servers, networks, and applications
- Tracks Server Resource Availability: Memory, CPU, interfaces, and disk space
- Alerts on Server Problems: Resource shortages and response dips
- Customizable Package: Choose which units to activate
Why do we recommend it?
Paessler PRTG Network Monitor provides server and application monitoring as well as supervision for networks. The core function of this package provides device discovery that creates an asset inventory. With that, you can switch on sensors that monitor server resources and raise alerts when they are running short.
The package includes network monitoring features and you could easily cover all of the infrastructures of your enterprise with PRTG. Really this is a package suited for very large corporations, but Paessler also produces price points that will tempt middle-sized companies.
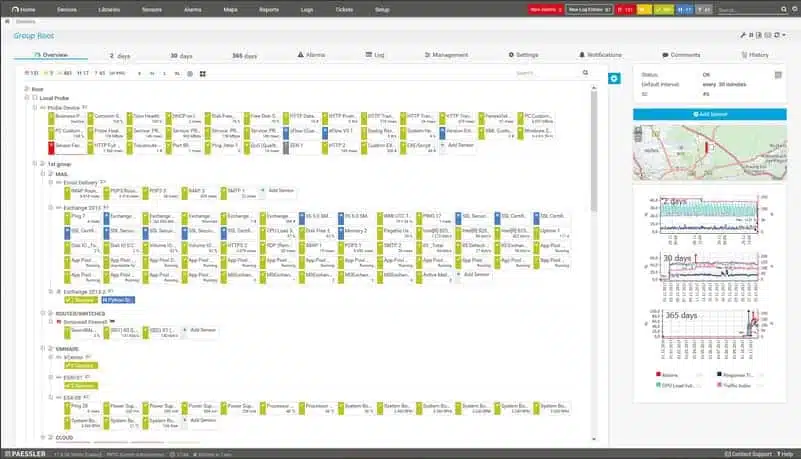
The Dashboard of PRTG is very attractive and includes dials, line graphs, and charts to make status checks a speedy task.
Hardware component monitoring covers CPU capacity, memory usage, disk status and performance, fan status, and power supply health. PRTG will become an essential component of your server administration tools.
PRTG interacts with:
- HPE ProLiant range
- Dell PowerEdge
- Cisco UCS
- IBM System X
The server application monitor has specialized procedures for web servers, mail servers (including Exchange servers), database servers, and virtual servers. The PRTG system automatically discovers your entire infrastructure including servers, network, network equipment, terminal devices, cloud services, and virtual environments. This comprehensive approach enables the system to flow through the consequences of statuses in one part of your infrastructure and warn on the impact any changes will have on your server performance as well as examining the server’s health in real-time.

PRTG includes a Syslog receiver, which will gather Syslog messages and act as a Syslog server.
The virtual environments that PRTG can monitor include:
- Hyper-V
- XEN
- Parallels Virtuozzo Containers
- Amazon EC2
The Paessler pricing model means you pay once for the software and keep the right to use it forever, however, you only get maintenance and support included for one year with your purchase. After that, you will need to pay for an annual maintenance contract in order to continue to qualify for patches and software upgrades.
The free version of PRTG allows you to monitor 100 conditions, which the company refers to as sensors. The cheapest of the paid packages cost $1,600 and gives you the right to monitor 500 sensors. The top-of-the-range package would be suitable for very large businesses and costs $60,000.
Who is it recommended for?
PRTG is a good solution for businesses of any size. If you only activate 100 of the sensors in the package, you never have to pay for the system. Larger businesses can monitor servers and the applications that run on them with this software that runs on Windows Server or can be accessed as a SaaS platform.
Pros:
- Multiple Protocols: Uses a combination of WMI, SNMP, and log collection
- Autodiscovery: Identifies all endpoints on the network and scans them for their attributes
- Alert Forwarding: SMS, email, and third-party integration
- Free Option: No charge to use 100 sensors
Cons:
- No Option for Hosting on Linux: Available as a software package for Windows Server or as a SaaS platform
You can have a 30-day free trial of the full system with unlimited sensors. When it comes time to buy, you select which conditions you want to monitor across all infrastructure, including the network. If you are interested in just using the PRTG system to monitor your servers and applications, you would just group your sensor allowance around server-related factors.
3. Atera (FREE TRIAL)
Atera is a system that is marketed for managed service providers (MSPs). The system is available online, so the MSP does not need to install any software on its premises or run its own supporting infrastructure. Thanks to Atera, all an MSP needs to start serving its clients is a laptop with a web browser and an internet connection. For this reason, Atera is very appealing to small MSPs and independent freelance support technicians.
Key features:
- MSP Focused: Designed for managed service providers
- One Screen: Monitors multiple sites through one console
- Handy alerts: Uses an alert mechanism to highlight server problems
- Not just for servers: Also monitors networks and applications
Why do we recommend it?
The main point of the Atera system is to enable remote monitoring and management of networks, servers, and applications. Although the MSP doesn’t need to install any software on its site, the client’s site does need agents installed on its monitored equipment.
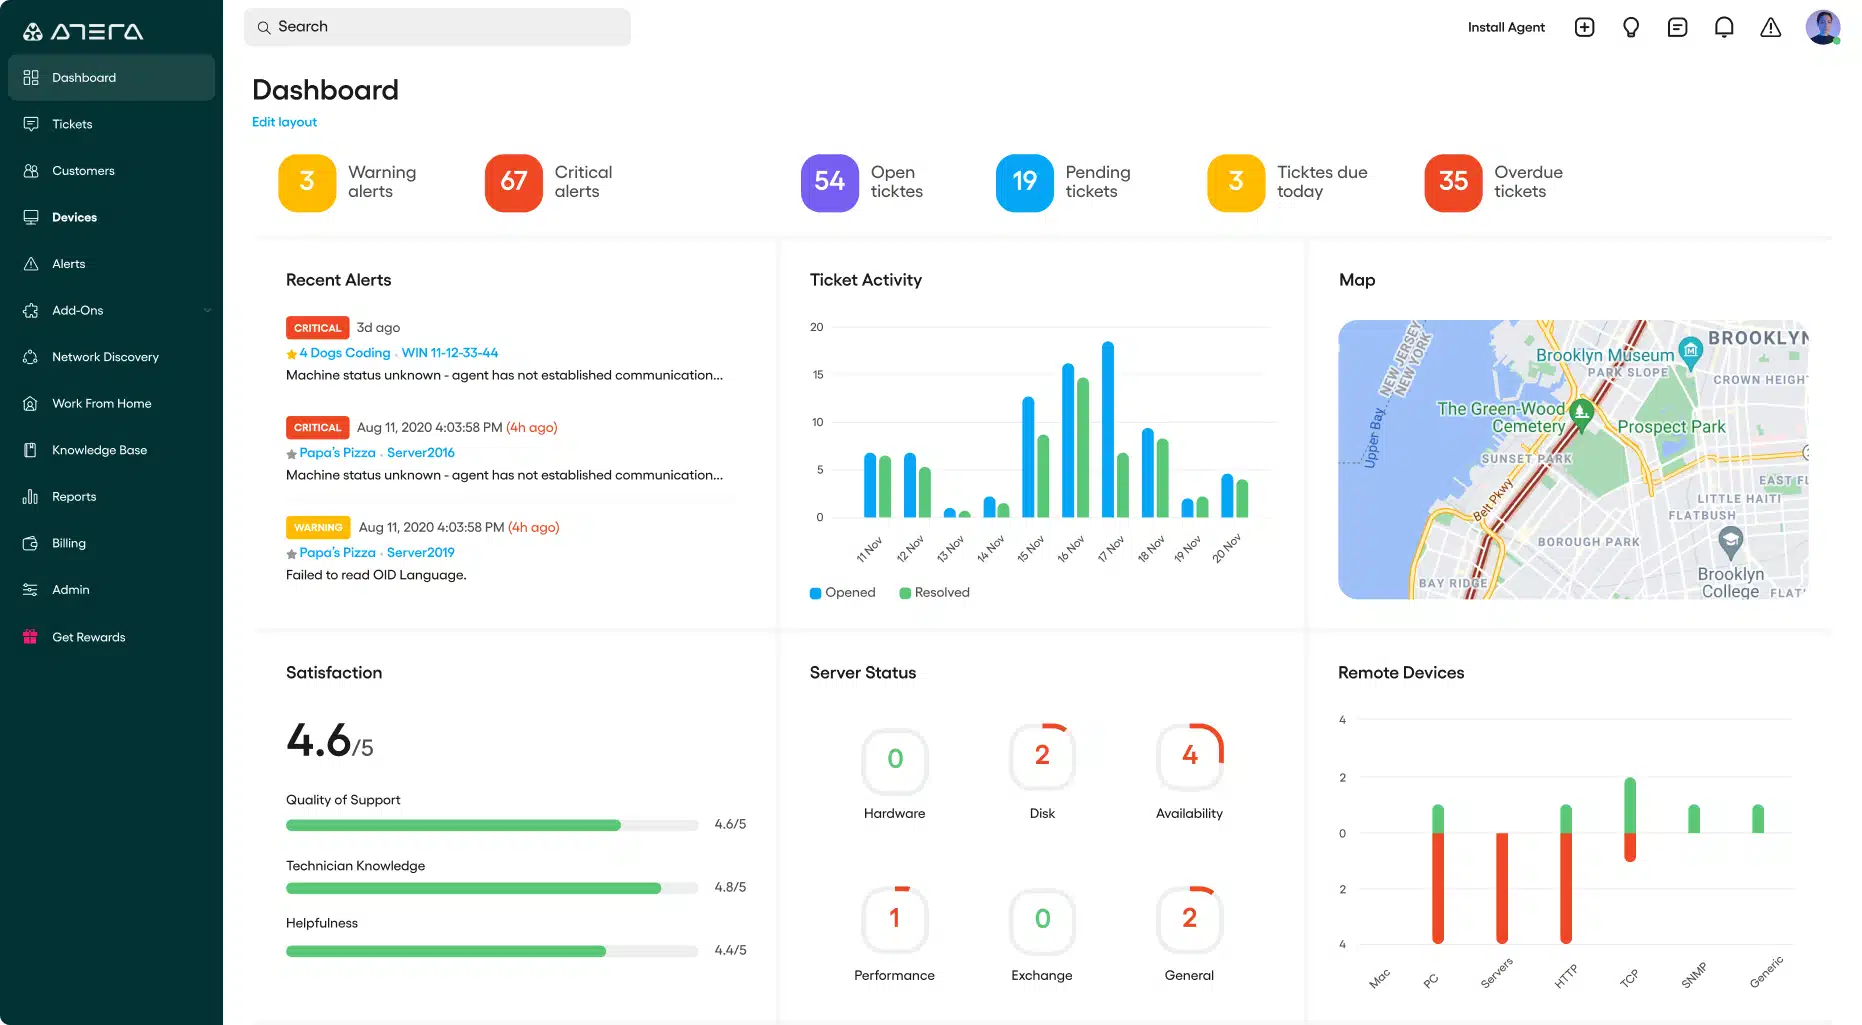
The server monitoring functions of Atera include CPU, disk, and memory capacity and utilization supervision. The service is also able to perform administration functions. It can list all software installed on a server and enable license management. It can also clean up disks, defragmenting them, and removing temporary files to free up space.
The Atera system includes a patch manager that will keep operating systems and key applications up to date. The patch manager can be set to run automatically once it is notified of the availability of a new patch. It can roll out those changes over several servers for a client organization.
The full set of tools that Atera provides to MSPs is called a remote monitoring and management (RMM) system. The RMM bundle is complimented by another group of functions, which are collectively known as professional services automation tools, or “PSA.” The PSA system includes all of the features that an MSP needs to carry out its business. These utilities include contract management, client management, and team management.

Who is it recommended for?
The package is designed in two versions that cater to IT departments and managed service providers. Both include remote access tools for manual technician endpoint maintenance tasks. The system is priced per technician with no minimum user count, so it is suitable for a single independent freelance technician, small teams, or large tech support operations.
Pros:
- Lightweight: Cloud-based tool
- Built with MSPs in mind: Includes RMM and PSA tools built-in
- Dashboard access from any browser: Makes Atera extremely flexible
- Scalable: Can scale and support multiple databases in a multi-tenant environment
Cons:
- MSP focused: smaller organizations may not use multi-tenant features
Atera’s customers don’t pay for the software bundle upfront. Instead, the platform is charged for on a monthly subscription per technician. There is also a yearly payment plan available. The subscription fee includes cloud processing and storage space. The service can be tested on a free trial.
4. ManageEngine OpManager (FREE TRIAL)

ManageEngine OpManager specializes in monitoring networks and servers. It can supervise the performance of virtual systems as well as physical resources. Although ManageEngine produces a separate monitor for applications, there is some application monitoring capability built into OpManager – notably for Exchange, SQL Server, and Active Directory.
Key Features:
- Monitors Networks and Servers: Uses SNMP
- Alerts for System Problems: Can be forwarded by email, SMS, chat app, or Service Desk ticket
- Autodiscovery: Logs all devices connected to the network and creates a map
Why do we recommend it?
ManageEngine OpManager monitors networks and servers. It can also monitor virtualizations, including VMware, Hyper-V, Citrix Xen, and Nutanix. There is the monitoring capability to cover Web and email servers as well. OpManager monitors servers running Windows or Linux and cloud platforms are also covered. This package also provides specific views of storage servers.
The server monitoring section of OpManager covers all aspects of physical server performance. It examines the activities of the operating system as well as the services needed to support all of the applications that are hosted by the server.
The key resources of each server, such as CPU, memory, and disk space are all tracked by the OpManager system. It registers the full capacity of each resource and then watches the activity on the server to get live feedback on the utilization of each of those resources.
The combination of network and server monitoring in the OpManager package adds extra capabilities to the system monitoring service with respect to network interface performance and the ability to connect to remote servers. The uptime of off-site servers and response times of the services on those hosts back to the monitoring base are other useful features of the OpManager bundle.
Not all infrastructure is physical and the OpManager service can also monitor virtual resources. The virtualization systems that OpManager can interact with include:
- Microsoft Hyper-V
- VMware ESX/ESXi
- Citrix XenServer
- Citrix XenApp
- Nutanix
The system is able to search a physical server and identify all of the virtual servers hosted by it. Once you have entered the access credentials for these services into the settings of the monitor, OpManager will then log all of the virtual infrastructure extending from each virtual host and then start tracking its performance.

The dashboard for the OpManager service offers system performance overviews for all servers enrolled in monitoring. There is also a system overview for all virtual resources. In both cases, the user is able to drill down from that summary through to live performance screens for each server.
Each metric tracked by the monitor is linked to a performance threshold. If activity slows down below an acceptable level or if a resource runs short, the threshold will trigger an alert. The alerts of OpManager can be set up to forward as notifications to key staff by email or SMS. The levels of the thresholds are set in order to buy time, enabling technicians to make adjustments to operations so that noticeable service impairment is avoided.
Who is it recommended for?
This package includes an alerting mechanism and it is particularly useful for large businesses where infrastructure is too complicated to track manually. A Free edition will monitor three devices. The cheapest package includes full server monitoring systems at a price that is accessible to small businesses. Adding ManageEngine Applications Manager would complete the set and provide full stack observability.
Pros:
- Server Resource Monitoring: CPU, memory, interfaces, and disk space
- Monitors Virtual Systems: Hyper-V, VMware, Citrix, Xen, and Nutanix HC
- A Range of Editions: Includes a version for managed service providers
Cons:
- No SaaS Option: However, it can be installed on a cloud account
ManageEngine OpManager is a software package that you need to host on-site. It is available for Windows Server and Linux. However, the server monitoring functions of the system are not limited to just supervising its host. It can monitor other servers across a network and even across the internet – the operating system of monitored servers is not tied to the OS of the software’s host. You can get OpManager on a 30-day free trial.
5. Site24x7 Server Monitoring (FREE TRIAL)
Site24x7 is a product of the Zoho Group, which also owns ManageEngine. So you will see a lot of similarities between the Site24x7 Server Monitoring screens and the server monitoring section of the ManageEngine Applications Manager.
Key Features:
- SaaS Platform: Hosted in the cloud
- Full Stack Observability: Network, server, and application monitoring
- Predictive Alerts: Spots emerging problems and raises alerts
Why do we recommend it?
Site24x7 Server Monitoring is part of a SaaS platform of monitoring tools. The Server Monitoring module watches Windows and Linux servers. It can also monitor Hyper-V, VMware, Docker, and Kubernetes structures. The AWS and Azure cloud platforms can also be monitored with this package and also Microsoft systems, including Active Directory, and Microsoft 365.
A big difference that you will notice about Site24x7 is that it is charged for on a monthly subscription basis rather than as a one-time fee. This is particularly advantageous for startups and growing companies because you don’t need to pay any upfront software costs.
Site24x7 is geared toward the management of servers which basically requires the monitoring of all infrastructure both onsite and off. So, the package includes network, server, and application monitoring modules.

The standard monitoring tasks of Site24x7 cover more than 30 statuses, including CPU performance management, memory capacity, disk usage, and potential, network interface activity rates, and software performance. The tool keeps track of operating system resources, such as port, NFS, file space, and directory creation.
Site24x7 can monitor hosts with the following operating systems:
- Windows
- Windows Server
- Linux
- FreeBSD
- OS X
It can also operate with the following virtual environments and cloud servers:
- Microsoft Hyper-V
- VMware Virtualization
- Docker Containers
- Microsoft Azure
- Amazon Web Services (AWS)
The console for the monitor is browser-based and hosted remotely. It gives you access to important files and reports on your own system. These include Syslog and Event Log messages. It also interacts with your Active directory implementations. The tool will help you manage these important system records, which assists in usage tracking and intrusion detection.
As the monitor is based outside of your network, you don’t need to be tied to your business premises. You can access the console from anywhere – there is even an app for access from mobile devices. You can start or stop the server from the app and also get status alerts forwarded to you as emails or text messages. Those alerts are also visible in the console.
Use the application to perform problem resolution with automated tasks, such as data gathering, system shutdowns, or authorization revocation. Site24x7 includes an analysis function, which helps you work out what happened when things went wrong.
You can schedule admin tasks to be performed on schedule out of office hours and also get status and security reports to run automatically.
Who is it recommended for?
The plans of Site24x7 offer monitoring tools for all elements of an IT system. The system is easy to use, which makes it a good option for small businesses. It is also a good choice for large, multi-site organizations. There is also a multi-tenant version of the platform for use by managed service providers.
Pros:
- Offers a Host of Out-of-Box Monitoring Options: A library of integrations
- Maps Dependencies: Detects links between applications and server resources
- Offers Root Cause Analysis: Enhanced by AI to fix technical issues faster
Cons:
- Base Packages are Sized and Priced for Small Businesses: Large companies pay much more than the headline price
Overall, the Site24x7 Server Monitoring tool is a great tool and it takes ManageEngine’s excellent reputation for infrastructure management tools out to the Cloud. You can get a 30-day free trial of the system. If you don’t want to buy after that period, there is a restricted free version, which is limited to monitoring up to five URLs or servers.
6. ManageEngine Applications Manager (FREE TRIAL)
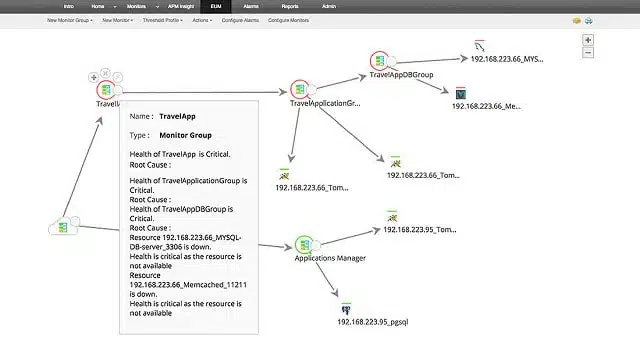
ManageEngine is another of the leading infrastructure monitor providers and its Applications Manager is well worth checking out for server monitoring. The company also produces the highly rated OpManager network performance monitor, which will integrate well with the Applications Manager to give you a full facilities monitoring suite.
Key Features:
- Scans Each Server: Discovers resource capacities and a list of installed software
- Creates an Application Dependency Map: Identifies links between different applications and also services
- Tracks Server Resource Capacity Utilization: Looks out for possible resource shortages
Why do we recommend it?
Pair ManageEngine Applications Manager with OpManager (see above) for full-stack monitoring. The Application Manager can also be used as a standalone tool. This package scans all servers and creates an application dependency map, which informs predictive server resource capacity alerts.
Line graphs provide the main graphical medium for displays. The attribute of your servers that get monitored live by this system includes CPU utilization, disk performance and capacity, memory usage and I/O performance. Hardware factors shown in the monitor include power, fan, and temperature sensor readings.

The Applications Manager is capable of interacting with the following server types:
- Windows
- Windows Clusters
- Linux
- Solaris
- IBM AS400
- AIX
- HP-Unix/Tru64 Unix
The mapping of your server environments is performed automatically and can extend to virtual environments and cloud services. The virtual systems that Applications Manager can interact with include:
- Microsoft Hyper-V
- VMware ESX/ESXi
- VMware Horizon View
- Citrix XenServer
- Citrix XenApp
- Docker
Out on the cloud, you can get your off-premises services included in the monitoring system if they are provided by the following systems:
- Microsoft Azure
- Microsoft Office 365
- Amazon EC2
- Amazon RDS
- OpenStack operators
The critical applications that can be monitored on your servers include SQL Server, an ERP system, such as SAP, Oracle EBS, Microsoft Dynamics AX and CRM, and Siebel CRM. Mobile apps for iOS and Android, plus mobile web apps are also covered by applications monitor, as well as the regular services that your web and applications servers both use and deliver.
The application management module of this package has some very interesting features to help you plan your capacity and test new apps. You can automate testing with workflows that can interact with recorded events from your server’s performance history. This means that you can get an idea of how a new application will impact your resources before you put it live. This gives the ManageEngine Application Manager the status of a server administration tool.
Performance monitors check on the availability of Active Directory services including those operating on your Exchange server. The speed of access to Active Directory and LDAP functions is also constantly monitored. The tool also includes the monitoring of Syslog messages and event logs on Windows systems.
The monitor is self-installing and doesn’t require you to access each server individually to perform setup. You get pre-written task templates and reports with this system and you can also produce your own automation scripts and custom reports.
Who is it recommended for?
Applications Manager is offered in two editions, with the first suitable for SMBs and the upper edition designed for large, multi-site organizations. This is a software package that will install on Windows Server or Linux. It can also be run on the AWS and Azure cloud platforms. OpManager is available for the same platforms, so it is possible to combine these two packages, whichever hosting location you choose.
Pros:
- Calculates Impending Resource Shortages: Raises alerts for likely performance issues
- Log Monitoring: Provides supplementary event data
- Automatically Detects Databases and Other Specialized Applications: Implements continuous performance monitoring
Cons:
- Not a SaaS Package: However, it can be installed on an AWS or an Azure account
You can install the monitoring console on Windows and Linux operating systems. The entry price of ManageEngine’s Applications Manager is $945, which makes it one of the cheapest of the “bells and whistles” paid server monitors. You can get a 30-day free trial of Applications Manager and it downloads directly from the ManageEngine website.
7. Checkmk

Checkmk is a system monitoring package that can supervise the performance of networks, servers, and applications. This is on-premises software, but it isn’t bound to monitoring the server that hosts it. This tool can monitor Linux and Windows servers and it can monitor remote servers and cloud-based virtual servers. Each installation can monitor thousands of servers all over the world.
Key Features:
- Full Stack Observability: Monitors networks and applications as well as servers
- Monitors Cloud Servers: Available in the two higher plans
- Runs On-Site or on Cloud Accounts: Installs on Linux
Why do we recommend it?
Checkmk is an on-premises monitoring package that covers networks, servers, and applications. It runs on Linux but can monitor endpoints running Windows, macOS, Linux, and Unix across the network. The server monitoring system tracks all of the usual metrics, such as CPU, memory, and disk utilization. It automatically raises an alert if a resource is running short.
The software installs on Linux. As well as monitoring its host, it will monitor other servers across a network. It is able to monitor devices running Windows Server, macOS, and BDS as well as Linux. Extending out across the internet, this system will monitor servers on remote sites. It can also monitor Cloud servers and services. Not only is the Checkmk server monitor suitable for monitoring your processing servers, but it is also equipped to monitor file systems and storage hardware.
Checkmk is able to monitor hardware from the following list of suppliers:
- IBM
- HP
- Cisco Systems
- Dell
- Supermicro
- Fujitsu
The dashboard for the system shows a range of graphical data interpretations that give live time-series feeds on performance metrics. The system configures itself, adjusting the metrics that it reports on according to the type of device that it is examining. It also explores the network to discover attached devices. It usually takes about 15 minutes for the tool to set itself to monitor all of the servers, endpoints, network devices, and applications running on a typical corporate network.

The server monitoring system in Checkmk covers all of the regular attributes that need to be tracked in order to get effective server performance management. These are CPU, memory, disk, and network interface capacity and utilization.
As well as monitoring physical servers, the Checkmk system monitors software-based servers, such as Web servers, mail servers, database servers, file servers, and application servers for Web services. Remember, this is an application monitor as well as a server monitor.
As it also tracks network activity, the combination of capabilities in Checkmk id ideal for monitoring virtualizations. The Checkmk system is able to monitor VMWare ESXi and Hyper-V servers together with their VMs and virtual switches.
Checkmk has two versions. One of those is called the Raw edition. This is an open-source system and is completely free to use. Despite being an open-source system – it’s a fork of Nagios Core – it has many high-quality features, including network and service discovery.
The Enterprise edition is based on a proprietary kernel, called Checkmk Microcore, so no Nagios in this one. The Enterprise edition is offered in three plans and, amazingly, one of them is Free. This version is limited to monitoring 25 hosts. The Free version has exactly the same features as the Standard version, but it doesn’t get professional support included.
The top version is called Managed Services and it is aimed at managed service providers (MSPs). So, the Standard version has everything that a corporate IT department could possibly need and the Free version has all of that but with capacity limits.
Who is it recommended for?
There are two editions of Checkmk: Raw and Enterprise. Checkmk Raw is an open-source system and is permanently free to use. This is appealing to businesses of all sizes but there is no professional support package Enterprise has a Free edition for small businesses that is limited to monitoring 25 nodes.
Pros:
- System Discovery: Populates a hardware inventory
- Continuous Status Scanning: Uses SNMP
- Free Version Available: Called Checkmk Raw
Cons:
- The Cloud-Hosted Option is Not a SaaS Plan: Install it on a virtual server
There is a Trial Edition for the Enterprise Edition: For 30 days you can use all features with unlimited hosts, after that your the trial edition will turn into the Free Edition that is limited to up to 25 hosts.
8. Nagios XI
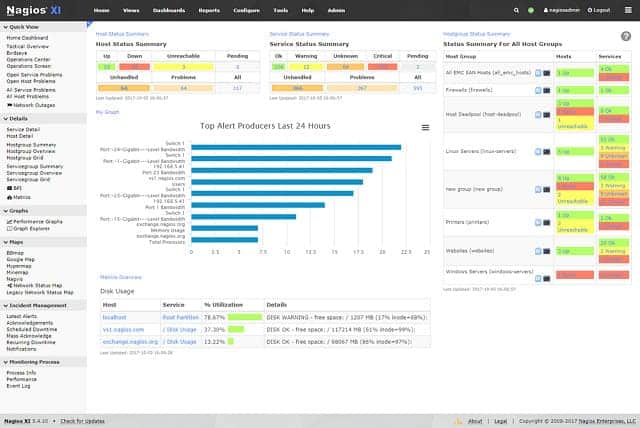
Nagios XI is a very comprehensive infrastructure monitoring system that covers networks as well as servers. The Nagios system is based on an open-source project called Nagios Core. Open-source software is available to download as code. The idea behind this concept is that it prevents companies from hiding security breaches in compiled programs. It also means that developers around the world can create additional features. The Nagios Exchange is a forum where you can pick up plug-ins to enhance the basic Nagios system.
Key Features:
- Full-Stack Observability: Networks, servers, and applications
- Server Resource Monitoring: CPU, memory, interfaces, and disk space
- Expandable: Free plug-ins from the Nagios Exchange
Why do we recommend it?
Nagios XI is a network, server, and application monitor that watches over virtualizations and cloud platforms as well as on-premises physical servers running Windows Server, Unix, and Linux. It will also monitor Macs. This is a well-known package thanks to its open source counterpart, which is free to use.
The Exchange is a good place to pick up tips and opinions from other server managers. You can gather opinions on alternative free systems, such as Microsoft’s RSAT, get tips on remote server administration tools, and other useful software — you don’t have to just talk about Nagios.
The Nagios Core interface is very basic, and Nagios XI was created for those who want more functionality. The Nagios XI dashboard is customizable and you can create different views on data and access levels to controls that will enable you to delegate work to junior staff safely and give reporting access to management and customers.
The system set up procedure is made simpler by a configuration wizard, which will do most of the work for you. When you buy the Nagios software, you get support for the first year. Although your purchase gives you the right to use Nagios XI forever, you will need to pay extra for an annual support contract once the initial free year of support expires. Nagios Core implementers and the users of the free Nagios XI have to rely on community forums for assistance.
The graphics in the Dashboard make key metrics and statuses easy to recognize and include predictive and data analysis tools for capacity planning. Failure statuses generate alerts in the Dashboard. Notifications of alert conditions can be sent out to key staff as SMS messages or emails.

Who is it recommended for?
Nagios is suitable for mid-sized and large businesses because it is a very large system that takes a lot of administration. The tool can be extended by free plug-ins to monitor specific technologies and products. Nagios Core might appeal to small businesses except that it doesn’t have its own front end.
Pros:
- Well-Established Monitoring System: Has a large user community
- Runs on Linux: Can also run on a VM or Docker
- Free Version Available: Called Nagios Core
Cons:
- Network Traffic Monitoring and Log Management Not Included: There are two separate paid packages
There are three price points for Nagios XI and the cheapest of these is free. The free version is limited to monitoring seven network nodes, but you can set which points on your network you wish to monitor and use up that allowance with your servers. It would be more advantageous to combine server monitoring with network monitoring to ensure that the entire environment is covered by the same monitoring tool. The lowest level of paid Nagios XI gives you the right to monitor 100 nodes, which is quite a step up from just seven.
9. SolarWinds Server and Application Monitor
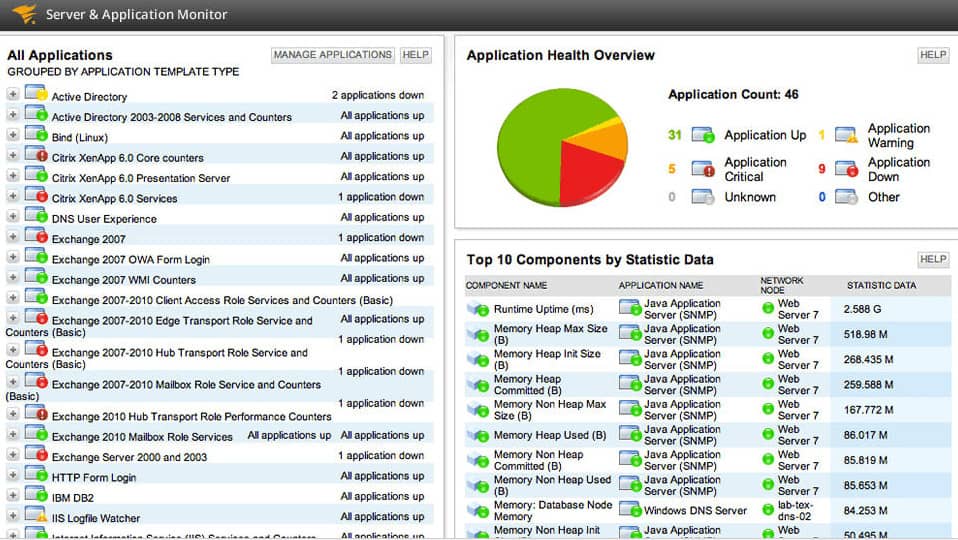
SolarWinds is a leading producer of IT infrastructure monitoring software. The Server and Application Monitor (SAM) can be linked together with the company’s Network Performance Monitor to create a truly comprehensive monitoring system for your business. However, this is a solution that is better suited to large corporations.
This software can interact with:
- Dell PowerEdge servers
- HP ProLiant servers
- IBM eServer xSeries servers
- Dell PowerEdge Blade racks
- HP BladeSystem enclosures
- Microsoft Windows Server
- VMware vSphere hypervisor
You can centralize all of your server admin from several sites and also integrate cloud server performance management. The SolarWinds SAM system can monitor AWS and Azure services and will cover storage, databases, and more than 1,200 applications as well as the health of your server hardware.
Key Features:
- Monitors Server Resource Utilization: Live capacity tracking
- Tracks Application Usage of Services: Discovers all applications for monitoring
- Runs On-Premises: Installs on Windows Server
Why do we recommend it?
The SolarWinds Server and Application Monitor can track applications across servers and it draws up an application dependency map that extends down to server resources. Knowing what demands each application places on servers, the monitor can predict potential shortages and raise an alert. Usage thresholds placed on each resource also trigger alerts when exceeded.
The server hardware metrics that get monitored by the SolarWinds system include CPU usage, hard drive, array, power supply, and fan status. The application performance overview is color-coded with green signifying normal conditions and critical statuses highlighted in red. This representation makes the monitoring of performance very easy to perform.
The monitoring software has an auto-discovery feature, which will identify your hardware and applications without any intervention from you. This feature is also a key attribute of the company’s network monitoring system. The dashboard includes a series of pre-written task templates that will help you automate your regular monitoring and preventative maintenance tasks. There are also pre-written reports and alerts built into the monitoring software.
The Appstack utility helps you track down infrastructure utilization on an app-by-app basis. This will help you identify where surges in demand come from and help you plan your capacity better. That interdependency between software access and its supporting hardware also extends to network activity. For example, if you suddenly encounter problems with SQL Server, you need to pull in all of your server administration tools in order to fully troubleshoot the cause of that problem.
You can customize the Dashboard, creating different views for different roles, which will enable you to delegate responsibility to junior team members. You can also customize reports and create your own automation routines and custom alerts. These functions make the SolarWinds SAM a really important server administration tool.

Who is it recommended for?
This package tracks cloud platforms as well as on-premises servers, so it is a good choice for system administrators that run hybrid networks. On-premises servers can be running Windows or Linux. This system is probably too extensive for use by small businesses but it is a good fit for mid-sized and large enterprises.
Pros:
- Designed with Large and Enterprise Networks in Mind: Small business won’t need all these features
- Supports Auto-Discovery: Creates an application dependency map
- Predictive Alerts: Calculator imminent resource needs against availability
Cons:
- No SaaS Version: Only available for installation on Windows Server
Apart from the Network Performance Monitor, you can integrate this module with a network traffic analyzer, a network configuration manager, a storage monitor, and a virtualization monitor. The standard Server and Application Monitor includes virtualization manager functions to monitor Hyper-V and VMware ESX systems.
10. Icinga
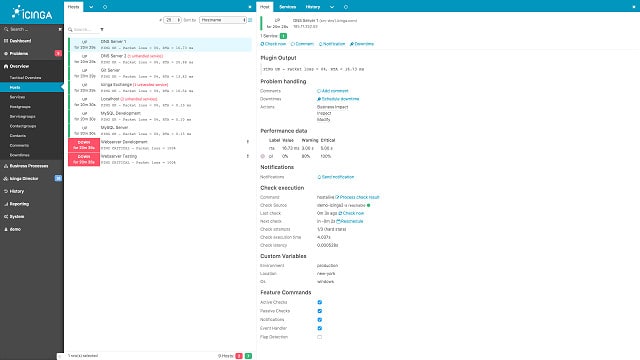
Icinga was originally created as a variation on the open-source Nagios Core code. The Icinga project is also open-source, which means that you can use it for free. There are three different interfaces available with Icinga. Incinga Core can be used with the Icinga Classic Dashboard or the Icinga Web interface. A more sophisticated version of the system is called Icinga 2 and that has its own Dashboard layout, called Icinga Web 2.
Key Features:
- Free to Use: There isn’t a paid version
- Based on Nagios: Accepts Nagios plug-ins
- On-Premises Software: Runs on Linux or Windows
Why do we recommend it?
Icinga is a fork of Nagios core and it has a decent front end. So, if you want a system monitor for networks, servers, and applications that is free to use, this is a good choice. The tool is comprehensive and offers server monitoring for Windows and Linux, VMware virtualization monitoring, and cloud platform monitoring.
The basic Icinga 2 download gives you the monitoring engine that will cover your network and your servers. You can choose to visualize that data with your favorite apps or download the Incinga 2 Web front end.
The Dashboard is fully customizable, enabling you to rearrange the standard widgets that come with the Incinga Web 2 download and also add in other plug-ins developed by the Incinga community. You can create different user types and assign limited Dashboard views to them, including reporting-only access for customers and management.

History logs help you compile data for analysis and capacity planning. The system comes with a command-line interface, which enables you to write your own scripts to manipulate and transfer data for analysis.
Alerts are central to the system and keep you abreast of critical conditions. You can nominate different users to be notified in specific error conditions and those notifications are available via SMS, mobile messaging, or email, so you don’t have to be at your desk to get system status alerts.
Who is it recommended for?
Small businesses with tight budgets will like this free system monitoring package and large companies use the tool as well – Adobe, T-Mobile, and Siemens are all on the Icinga client list. Enterprises that require professional support for their software can get that for a subscription.
Pros:
- Monitors Hybrid Systems: Track on-premises servers and cloud platforms
- Log Management: Part of the core package
- Monitors Multiple Operating Systems: Linux, Unix, and Windows
Cons:
- No SaaS Option: Only available for on-premises hosting
Icinga 2 is completely free of charge. However, it is better suited to companies that have a system programmer to hand or small businesses that have a scripting enthusiast running the network and administering the servers. This system is great for those who want to create a customized server and network monitoring system. If coding is not your forte, you will struggle to get the best out of Icinga.
11. N-able N-sight

N-able N-sight is a cloud-based remote monitoring and management software package. The system is hosted so you don’t need to have your own server to run this system management bundle. The service is able to monitor any network anywhere as long as that network is connected to the internet. This means that one central IT department can manage the IT facilities on many sites.
Key Features:
- SaaS System: Designed for managed service providers
- Monitors Systems on Multiple Sites: Maximizes the productivity of technicians
- Full Stack Observability: Includes automated server management routines
Why do we recommend it?
The N-able N-sight SaaS platform includes a ticketing system for user contact, team management, and individual technician task management. Technician tools include automated monitoring systems, for networks, servers, and applications. The system also provides remote access tools and automated maintenance utilities, including a patch manager.
The RMM system covers networks, endpoints, and mobile devices as well as servers. The system can keep track of the performance metrics of both Windows and Linux servers. However, the patch management facility within the tool is only geared to patching Windows systems.
The remote monitoring and management software is also able to run health checks on virtualizations running on a monitored server, comparing VMs to underlying servers, and looking at the physical capabilities and utilization of the host’s resources.
The service dashboard is hosted in the cloud and IT professionals access it through any standard browser or with a N-able N-sight app for mobile devices. The monitoring summary screen contains many panels that show overviews of endpoints, network devices, and servers. Each of these panels is a link through to detail screen. The layout of the dashboard makes problem recognition very easy, thanks to brightly-colored charts and graphs. The drill-down capabilities also give the user a clear path of investigation.
The N-able N-sight system works on a system of alerts. So, technicians can get on with other tasks, assuming that the server is working properly unless otherwise notified. When issues arise, N-able N-sight raises an alert. This shows up in red as a status on the dashboard and it can also be sent on to key technical staff through emails or SMS messages. The alerting system of N-able N-sight is very flexible and system managers can create their own alert thresholds, even with combined conditions.
Another useful tool for server managers is the Automation Manager. This has a drag-and-drop interface that enables the systems administrator to specify workflows that will kick in automatically when an alert is raised. Other options are to schedule routine maintenance tasks so that they will launch outside of office hours without the need to make technicians stay behind in the evening.

N-able N-sight is charged for by subscription and there are no set up fees. This charging structure is great for startups because there is no need to invest in servers or software upfront. For a small monthly fee, each IT department gets access to the full range of remote monitoring and management tools no matter how small the enterprise is.
Who is it recommended for?
This system is designed for MSPs. The minimum license subscription provides monitoring for 100 nodes, one technician, and three team managers – which is suitable for a small MSP. expansion packs provide the capacity for very large MSPs as well. This package would also be suitable for use by IT departments.
Pros:
- Supports 100 Nodes per License: The package also includes remote access, ticketing, and billing systems
- Automatic Asset Discovery: Creates an inventory that documents all endpoints
- Automated Remote Server Management Tools: Includes a patch manager
Cons:
- Suitable for Support Teams: Better value for large organizations than small businesses
You can get a 30-day free trial to take a look at N-able N-sight without obligations.
12. Zabbix
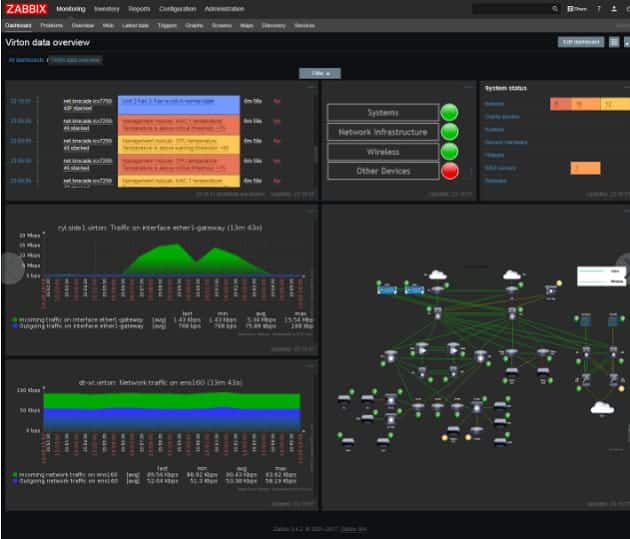
Zabbix is a free-to-use open-source package. The monitor functions of the system include network and application status checks as well as server monitoring. The monitor can operate on IBM, Linux, Lenovo, Dell, and Solaris systems.
Zabbix effectively monitors key elements of a server’s performance, including CPU operations, memory utilization, I/O error rates, disk space, fan status, temperature, and power supply performance, ensuring comprehensive oversight of server health.
Key Features:
- Free Tool: Professional support is a paid extra
- Full Stack Observability: Networks, servers, and applications
- Customizable Screens: Functionality can be expanded by templates
Why do we recommend it?
Zabbix is a free package that provides network, server, and application monitoring. The system is customizable and covers all of the standard server resources, such as CPU, memory, and disk. You can set up alerts to get notifications by email if problems arise. The system connects to specific products with templates.
Other relevant environment statuses examined by Zabbix include:
- Network bandwidth usage
- Network availability
- Packet loss rate
- TCP connection rate
- Routers throughput
- Warning conditions
The monitor also keeps track of software, operating system, and firmware statuses for the server and all other devices connected to the network. This includes configuration control and checks for unauthorized installs or version changes.
Operations are conducted through procedural outlines, called templates. You can use templates that are pre-written by the Zabbix team, pick up the templates created by other implementers of Zabbix in the user community, or create your own custom templates. 
You can also create custom alerts and adjust the severity rating of existing warnings to blend the right levels of critical statuses for your server and network. The alerts generated by the system can be sent to you by SMS, messenger app, or email.
The system enables you to set up different users for the dashboard with varying permissions and alerts can be directed to specific users. It is also possible to create automation scripts and set up workflows to assign tasks and alert responses.
You can monitor across sites from one central location safely because all Zabbix messages are encrypted for protection. The package also includes a remote access facility to enable you to contact network devices on other sites directly from your central command center. So, this is a good remote server administration tool.
Who is it recommended for?
Although Zabbix is free to use, it is a competent tool and has some big businesses on its user list. It takes some time to set up, which might put off owner-managers – it is perhaps too much for very small businesses. This software runs on Linux, Docker, and cloud platforms.
Pros:
- System Discovery: Creates an inventory and network map
- Server Resource Monitoring: Alerts for capacity shortages
- On-Premises or Cloud: Runs on Linux, Docker, Hyper-V, VMware, AWS, GCP, Azure, OpenShift, or DigitalOcean
Cons:
- No SaaS Option: The cloud installation has to run on your own account
This system might take too much time for a sole systems administrator that is monitoring a small network to set up. The extensive messaging and encryption procedures can make the system slow to respond where there are more than 1,000 nodes to watch, so this system is best suited to monitoring the networks of middle-sized companies.
13. OP5
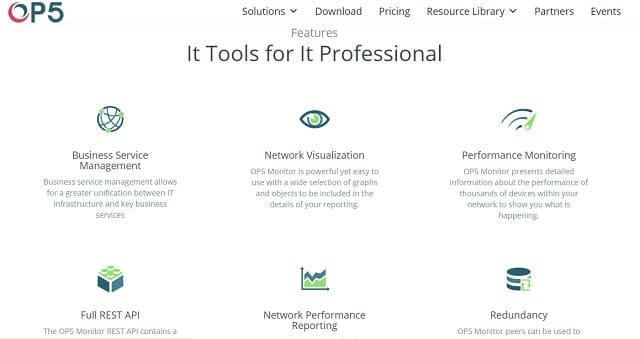
OP5’s server monitoring system enables capacity planning and trend analysis as well as the regular functions that you would expect from a server monitoring package. The company also produces network monitoring software, so you can combine the two packages to get complete infrastructure control.
Key Features:
- Live Performance Tracking: Monitors on-premises and cloud assets
- Capacity Planning: Provides metrics on historical demand for trend analysis
- Alerts for Performance Problems: Resource shortages and system errors
Why do we recommend it?
ITRS OP5 is a full-stack monitoring package and while it stresses its network monitoring capabilities, it also monitors server activity. The tool uses an autodiscovery service to set itself up and it is very easy to manage servers with this system thanks to its resource shortage and performance dip alerts.
The company states that its software is able to monitor all brands of server hardware and any operating system. You can keep track of physical attributes such as CPU usage, memory activity, disk space, I/O performance, power supply status, and fan availability.
Virtual networks and cloud services can be monitored by this system and multi-site implementations do not present a problem.
Apart from the display of live performance data, the server monitor includes alerts to warn of critical and unexpected failure conditions.
Analysis features include the typical response times for standard user activities on your server. You can examine the performance of applications and services and identify which resources in your IT system cause bottlenecks under a range of usage scenarios. A very nice feature is an intelligent load balancer that is able to adapt to varying demand and allocate requests to underutilized servers in your cluster. OP5 is a server administration tool as well as an infrastructure monitor.
This server and network monitoring system is suitable for middle-sized companies and large corporations. The user interface of the monitor features graphical visualizations and access to data can be partitioned according to nominated user account access rights. This makes the OP5 system a great choice for a team of system administrators.

Who is it recommended for?
This package is an on-premises system that is only available for Linux. It can monitor multi-site operations and it offers free extensions to connect to specific software packages, such as ServiceNow and Slack. This system is suitable for mid-sized businesses that run Service Desk teams.
Pros:
- Network Monitoring: An additional module
- SLA Goal Tracking: Also availability reports
- Compatible with Nagios Plug-Ins: Functional extension for free
Cons:
- Only Available for Linux: Won’t run on Windows
Although the platform behind OP5 is open source, there isn’t a free version of this monitoring system. The company isn’t open about its prices. It will give you a tailored quote once you enquire. The pricing structure is based on the number of devices that you want to monitor and negotiations that take place after you send in for a quote. You can access the software for a 30-day free trial to make sure it does everything you need from a server monitor before you have to pay.
14. Motadata Server Monitoring Tool
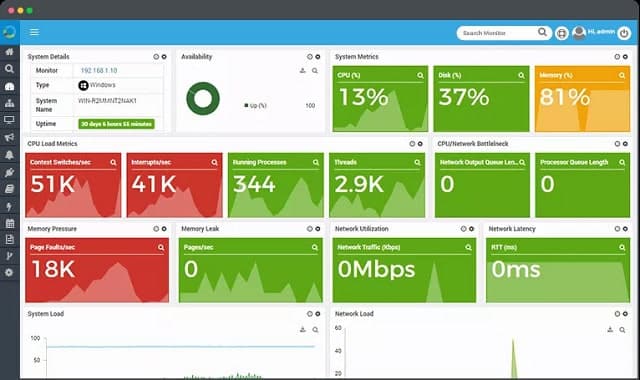
Motadata from Mindarray Systems is a unified infrastructure management and monitoring tool. Motadata Infrastructure Intelligence Platform (IIP) includes network, server, and application monitoring with specialized modules that track the performance of databases, cloud services, and web platforms.
Key Features:
- Resource Monitoring: For on-premises and cloud servers
- Full-Stack Observability: Alos monitors networks and applications
- Bottleneck Detection: Uses AI to predict upcoming service requirements
Why do we recommend it?
The Motadata Server Monitoring Tool is part of an AI-based system support package that is available as a Service Desk system. As well as physical Windows and Linux servers, this tool monitors cloud platforms and virtualizations. The system is able to support the centralized monitoring of multiple sites.
If the server you want to monitor supports an online business, you would be particularly interested in the URL and database monitoring activities of this suite. It will check on the availability of your web pages and also assess the delivery performance of your entire infrastructure to ensure that visitors to your website have an acceptable user experience.
The specific server metrics that are observed by Motadata’s server monitoring module cover the regular physical characteristics of your servers including disk volumes and spare capacity, CPU usage, and memory utilization. The monitor also covers bandwidth capacity on your servers’ interfaces. The monitor integrates a log analyzer to catch events that may damage the capacity of your servers.
Server performance metrics interact with data sourced from the network and application performance modules to give you a stack view of your infrastructure, enabling you to spot the cause of performance server issues. These can be actually server-related, or due to the underlying services and networks. The combination of data from monitoring modules also helps you watch capacity limits and plan for expansion of the right level of your hardware inventory to prevent performance limits impacting on the quality of your service delivery.
Motadata is capable of monitoring both Windows and Linux servers and it is able to integrate remote servers into centralized WAN monitoring. All level of infrastructure monitoring is also available for cloud services, so if you contract in Software as a Service (SaaS), or just cloud storage, you can cover those remote resources with a centralized monitor. If you blend on-premises and cloud facilities, all of those resources can be managed by the unified monitoring system.
The management functions of Motadata include automatic problem resolution through scripting and built-in actions. The coverage of networks and applications as well as servers means that Motadata IIP is an ideal solution for monitoring virtualizations. The monitor will track the following environments:
- VMWare
- Microsoft Hyper-V
- Citrix Xen
The dashboard is attractive and crowded, squeezing in a lot of information through headline blocks, graphs, and charts. The server monitor has specialized sections for specific server types – email, database, application, and VM support servers.

Who is it recommended for?
This tool sets itself up, thanks to an autodiscovery system. It creates hardware and software inventories and provides an IT asset management system. This tool is suitable for use by central IT support departments for multiple sites that operate the Service Desk model.
Pros:
- Response Time Logging: Looks for drops in performance
- Security Scanning: Tracks failed login attempts
- Log Analytics: Log collection, analysis, and storage
Cons:
- No Price List: You have to contact the Sales Department for a price
Motadata installs on Linux and the front-end is browser-based, so it requires a Gnome environment. You can get a 30-day free trial in order to assess the software.
Choosing Server Monitoring Software
Server monitoring is an essential task. However, you don’t necessarily need to spend a lot of money to get some really good metrics. Combining server monitoring with application and network monitoring gives you a lot more control over your service than server monitoring alone can deliver.
The basics of server monitoring just gives you the status of various hardware components, such as disk space and CPU utilization. Although you need to keep on top of these factors, they don’t necessarily illuminate the user experience that your customers are getting from your system. If you just focus your monitoring on your server’s status, you overlook complicating factors such as the network performance, or the availability of cloud services that contribute to your presentation.
Performance monitoring is a very broad topic and you can get a better idea of all of the tasks involved in keeping your infrastructure in good shape by looking into complete systems that take care of your entire IT system.
No matter how much reading you do on your quest to find the right server monitor, you won’t really get a proper feel from any system until you try it out. Fortunately, a lot of the systems on our list offer free versions for you to take a look at. Those that only offer paid solutions give you a free trial. These trial offers are essential if you are going to truly assess each candidate for your server monitoring needs.
Although it may seem like a waste of time to try one system, tear it down, and then install a different monitor, it is better to go through the process of trying out a couple of options just to make sure you choose the right one.
Server Management & Monitoring Software FAQs
What is distributed server monitoring?
Distributed server monitoring is the standard form of monitoring system because it implements the monitoring from several locations. Distributed monitoring is the opposite of centralized monitoring where many servers are monitored from one controlling device. In a distributed system, the monitoring software is installed in several locations, so having monitoring software installed on each server is a distributed system.
What tool is best for passively monitoring sever load?
The concept of passive monitoring involves observing activity from outside of the monitored system. In the case of server monitoring, passive monitoring of server load would be performed by a load balancer.
How do I monitor proxy server traffic?
Most proxy services have a dashboard and traffic volumes will be shown as a metric in that system. If you own the proxy server, regular server monitoring software will provide traffic throughput measurements.
Further reading
Comparitech Networking Guides
- Top LAN monitoring tools
- The definitive guide to DHCP
- The definitive guide to SNMP
- The best free NetFlow analyzers and collectors for Windows
- Best free bandwidth monitoring software and tools to analyze network traffic usage
- Best free network vulnerability scanners and how to use them
- Best packet sniffers and network analyzers
- How to build your own cloud storage server at a fraction of the cost


Very good list & thanks for that. Which one of these do you recommend for server management (patching & software deployment) and monitoring? That is, a product that does both of these.
Hi, Jim,
Let’s invite the other readers to vote for their top server management and patching tool.
Cheers,
Stephen
You can add Motadata server monitoring software https://www.motadata.com/product/network-management-and-monitoring/server-monitoring/ in this list
Hi, Ayushi,
Thanks for the tip. I looked into Motadata and I added it to the list, thanks to your suggestion.
Keep in touch,
Stephen
What about Prometheus??
Thanks for the tip, Adam. I will look into it.