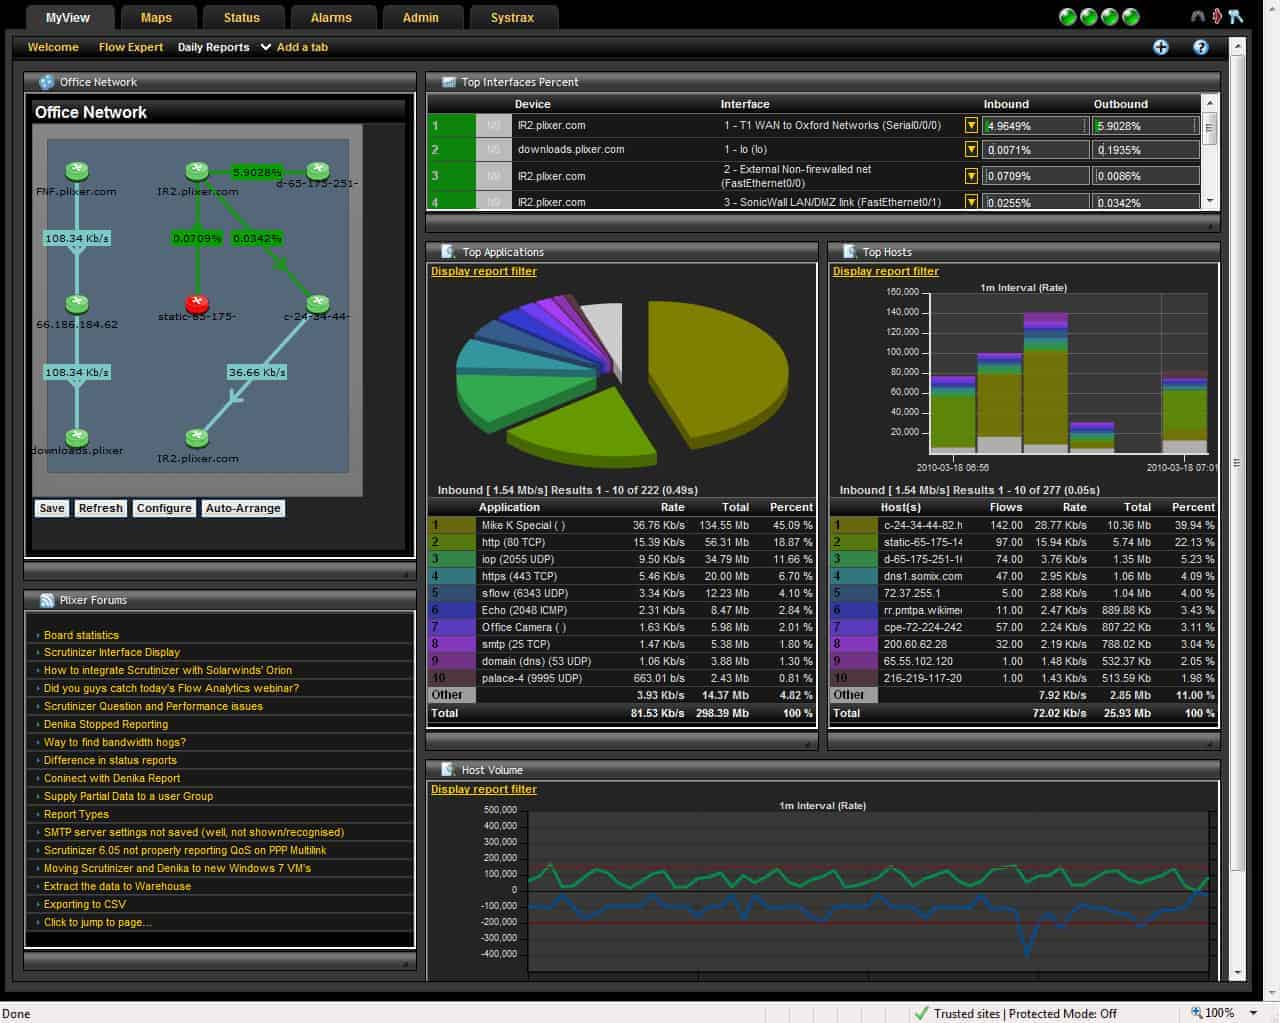
Network traffic analysis involves examining packets passing along a network. Historically, this strategy was intended to investigate the sources of all traffic and volumes of throughput for the sake of capacity analysis.
More recently, network traffic analysis has expanded to include deep packet inspection used by firewalls and traffic anomaly analysis used by intrusion detection systems.
Here is our list of the best network traffic analysis tools:
- ManageEngine NetFlow Analyzer EDITOR’S CHOICE This package uses flow protocols, including NetFlow, IPFIX, sFlow, and J-Flow, to extract traffic data from switches and routers. Available for Windows Server, Linux, and AWS. Get a 30-day free trial.
- ManageEngine OpManager Plus (FREE TRIAL) An expansion of the standard OpManager network performance monitor that includes traffic analysis. Download a 30-day free trial.
- Site24x7 Network Traffic Monitoring (FREE TRIAL) This cloud-based traffic analysis package uses flow protocols to gather live statistics and also provides connection testing utilities. Start a 30-day free trial.
- Progress WhatsUp Gold (FREE TRIAL) This network monitoring system offers an extra unit in its higher plans for traffic tracking. Runs on Windows Server. Start a 14-day free trial.
- Noction Flow Analyzer This is a package of network monitoring tools that include a capacity planning analyzer that recalls stored traffic data. Runs on Linux.
- SolarWinds NetFlow Traffic Analyzer The leading network traffic analyzer. It works with NetFlow, J-Flow, sFlow, NetStream, and IPFIX for packet capture.
- Elastic Stack A suite of data capture and analysis tools featuring Elasticsearch and Kibana.
- Plixer One A traffic analyzer used for network security that samples traffic from multiple network locations simultaneously.
- Open WIPS-NG A wireless network protection system that includes traffic analysis.
What to look for in a network traffic analysis tool
At the simpler end of the market, you will find packet sniffers that copy passing traffic into files. That information then needs to be processed to gain meaningful insights into traffic patterns. At the other end of the scale, you will find complex systems that sample traffic from several points of the network simultaneously. They can also consolidate that source material to discover unusual user behavior.
Although the network offers live source data, network traffic analysis tools rarely operate in real-time. Packet headers are the main source of information for analysis, but traffic analyzers wait until a series of packets have been captured and stored. So, NTAs can be said to operate at the Application Layer and not the Network Layer.
Analyzing at the Application Layer gives the NTA tool a better overview of network activity. The information available at the Network Layer is insufficient to spot overall traffic patterns and it misses malicious traffic that is intentionally spread across numerous packets or combines actions from different sources.
Network traffic analysis can give rapid feedback, but at its fastest, it is only “nearly live.” Security applications can’t detect threats until they have streams of data to work on. With capacity planning and analysis, there is less urgency – the accuracy of projections is more important than immediacy.
Related post: Network Capacity Planning Tools
The best Network Traffic Analysis tools
The NTA utility that will interest you the most depends on the reason you need to analyze your network.
Our methodology for selecting NTA tools for this list
We reviewed the market for network traffic analysis software and assessed the options based on the following criteria:
- A monitor that is able to use traffic flow protocols, such as NetFlow, J-Flow, and sFlow to communicate with switches and routers
- Options for packet capture or packet sampling
- A protocol analyzer to segment traffic statistics by application
- The ability to identify traffic volumes per link and end-to-end on a given path
- Live traffic data displayed in graphical format
- A free trial for a no-cost assessment period or a completely free tool
- Free tools that are worth installing or paid tools that offer value for money
The descriptions of each tool in the following sections should help you to decide.
1. ManageEngine NetFlow Analyzer (FREE TRIAL)
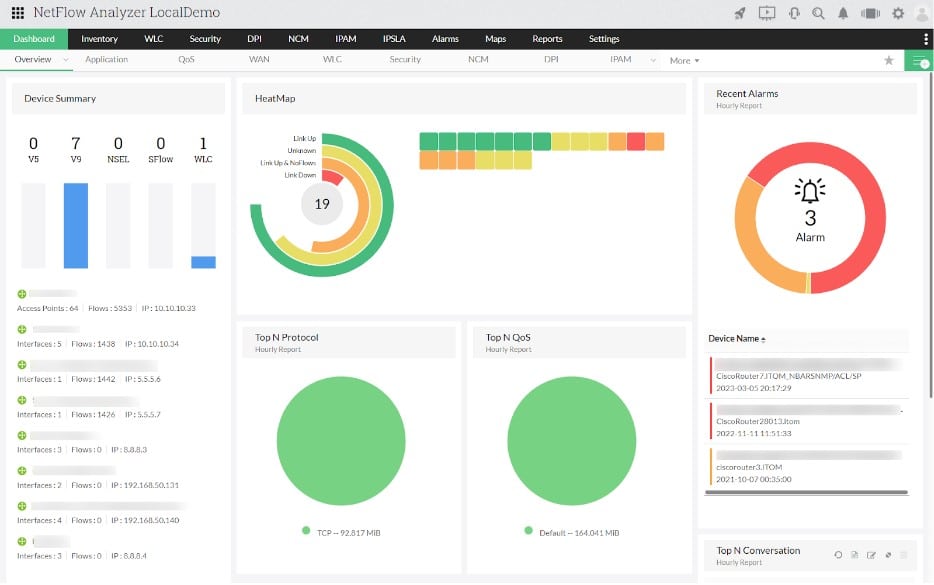
ManageEngine NetFlow Analyzer uses flow protocols to extract traffic data from switches and routers. The package includes a few other techniques for traffic analysis, including packet sniffing and protocol analysis. The service can spot growing traffic problems, identify bottlenecks and overloaded switches, support capacity planning, and implement traffic shaping.
Key Features:
- Implements NetFlow, IPFIX, sFlow, and J-Flow
- Packet sniffing and protocol analysis
- NBAR monitoring
- Traffic shaping
- VoIP monitoring
Why do we recommend it?
ManageEngine NetFlow Analyzer is a solution that can head off traffic congestion problems. Overloaded switches and routers will just drop packets, so packet loss can be avoided by spotting devices that have insufficient capacity for the traffic that is sent to them. Implement traffic shaping measures or buy extra capacity to solve this problem.
Your network will carry different types of traffic and some applications are more urgent than others. For example, VoIP and video streams need to get through as quickly as possible but users won’t notice if email traffic is delayed by a few seconds. Therefore, the protocol analysis unit of the NetFlow Analyzer is going to be your first port of call.
The analyzer will show how much traffic of each protocol is arriving at an overloaded switch. Information on VoIP traffic derived from Quality of Service and Mean Opinion score add to the research that you need to perform.
With full details of urgent traffic volumes, you can prioritize those interactive applications by queuing less urgent traffic. This technique is known as traffic shaping and it can improve your network’s performance without the expense of upgrading hardware.
The NetFlow Analyzer performs live traffic monitoring and will raise an alert if switch interface traffic throughput approaches full capacity. You can also store data for trend analysis. This can lead to solutions such as re-timing scheduled admin tasks and batch jobs to run out of office hours, thus spreading demand over a wider period.
Who is it recommended for?
This package is suitable for any business that runs a LAN. The tool can help you avoid or defer new equipment purchases by squeezing maximum value out of existing physical infrastructure. Thus, the savings you get from using the NetFlow Analyzer will repay its purchase price.
Pros:
- Improves voice call quality
- Enables queuing
- Can identify underutilized equipment that can be moved for better utilization
- Will head off overloading and reduce packet loss
- Can be hosted on an AWS account as well as on your own server
Cons:
- The Free edition is limited to monitoring two interfaces
You can download the software for the NetFlow Analyzer and run it on an on-premises server. The system is available for Windows Server and Linux. The package is also offered as a service on the AWS Marketplace. Whichever host you choose for the package, you will be using it to monitor your own local area network and all plans can include the monitoring of wireless networks. The top plan, called the Enterprise edition will monitor multiple sites through one console. ManageEngine offers the NetFlow Analyzer on a 30-day free trial.
EDITOR'S CHOICE
ManageEngine NetFlow Analyzer is our top pick for a network traffic analysis tool because this tool is a standalone service; it doesn’t rely on extra purchases of companion modules to provide network discovery. You can use a range of techniques to track the performance of your network. These include flow protocols and protocol analysis through packet sniffing. The package also gives you methods to ensure that VoIP services are delivered with a suitable level of sound quality. Use this package to remove jitter, lag, and packet loss by implementing traffic shaping to lessen the pressure on network switches. This system includes alerts for live problem notifications and these can be channeled as tickets through your Service Desk system. You can also store traffic statistics to implement trend analysis and capacity planning.
Download: Get a 30-day FREE Trial
Official Site: https://www.manageengine.com/products/netflow/download.html
OS: Windows Server, Linux, and AWS
2. ManageEngine OpManager Plus (FREE TRIAL)
ManageEngine OpManager Plus includes just about all of the monitoring capabilities that you need to run your IT infrastructure. This includes network device health monitoring and traffic flow analysis utilities.
Key Features:
- Application recognition: NBAR for protocol scoring
- Uses traffic flow protocols: NetFlow, J-Flow, sFlow, NetStream, AppFlow, and IPFIX
- Queuing options: CBQoS
- WiFi observations: Wireless network monitoring
Why do we recommend it?
ManageEngine OpManager Plus is a combination of two ManageEngnie packages: The OpManager system and the NetFlow Analyzer. This bundle competes with the SolarWinds NetFlow Traffic Analyzer and Network Performance Monitor partnership. You get network discovery, assert inventory creation, continuous device monitoring, topology mapping, and traffic analysis.
OpManager Plus starts its service life by scanning the network and creating a topology map and device inventory. That gives you an overview of your network and then you can work on testing the traffic on each link or end to end between two nodes on the network. Whenever you change the layout of the network by moving, adding, or removing equipment, the topology map and inventory will update automatically. The map shows the status of each device and the load on each link.
The traffic flow capture system in the monitor can communicate with network devices through NetFlow, IPFIX, J-Flow, NetStream, sFlow, and AppFlow. Metrics on network traffic are displayed live on the screen. However, the packets captured by the system are stored in files for analysis.
The day-to-day traffic monitoring system allows you to set threshold alerts that warn of possible resource exhaustion. These alerts can be sent to you by email or SMS so you don’t have to attend the monitoring screens constantly.
The analysis screens of the system help you to explore the sources of traffic by application, IP address, or interface – it implements NBAR. The tool includes forecasting assistance so that you can perform capacity planning. The system also includes traffic shaping tools, such as queuing and prioritization with Class-Based QoS to help you squeeze extra value out of your network infrastructure.
OpManager Plus can monitor wireless networks as well as standard LANs. It can cover internet links between sites if you run a WAN and it is also able to integrate links to Cloud servers.
Who is it recommended for?
OpManager Plus is an on-premises package for Windows Server and Linux. You get network, firewall, server, storage, application, and middleware monitoring with this package, so it is a very big bundle. Configuration management, security protection, and IP address management are also included, so there will be very little else to buy in order to get your entire system fully monitored and managed.
Pros:
- A software package: For Windows Server and Linux
- Can run on cloud accounts: AWS and Azure
- WiFi monitoring: Wired and wireless networks
- Offers traffic shaping measures: Queuing and application prioritization
Cons:
- Not a SaaS package: It will install on cloud platforms but doesn’t include the cost of hosting
The software for OpManager Plus can be installed on Windows Server or Linux servers. ManageEngine offers OpManager Plus on a 30-day free trial.
Related post: ManageEngine OpManager – Full Review
3. Site24x7 Network Traffic Monitoring (FREE TRIAL)
Site24x7 Network Traffic Monitoring is a cloud based service that samples data from a network through an agent on the site. This agent gets downloaded as part of the onboarding process. The tool implements live traffic monitoring per link and also stores traffic metrics for historical data analysis and network capacity planning.
Key Features:
- Flow protocols: NetFlow, IPFIX, sFlow, J-Flow, cFlow, AppFlow, and NetStream
- Live traffic monitoring: Automated and constant collection of throughput data
- Connection testing: On-demand path analysis
Why do we recommend it?
Site24x7 Network Traffic Monitoring is part of a cloud platform of tools. While this unit covers bandwidth capacity utilization tracking, another module on the platform implements network device status monitoring. Other units monitor servers and applications to provide full-stack observability. This tool can be used to monitor multiple networks in one account.
The traffic monitoring services in the Site24x7 platform use packet analysis data that is collected by network devices. This data is stored within the device and the Site24x7 agent uses the query language that is built into each switch and router to get a copy of the data. Different manufacturers use different languages, known as flow protocols, within their devices. So, Site24x7 is able to use all of the protocols deployed by the major network device suppliers. 
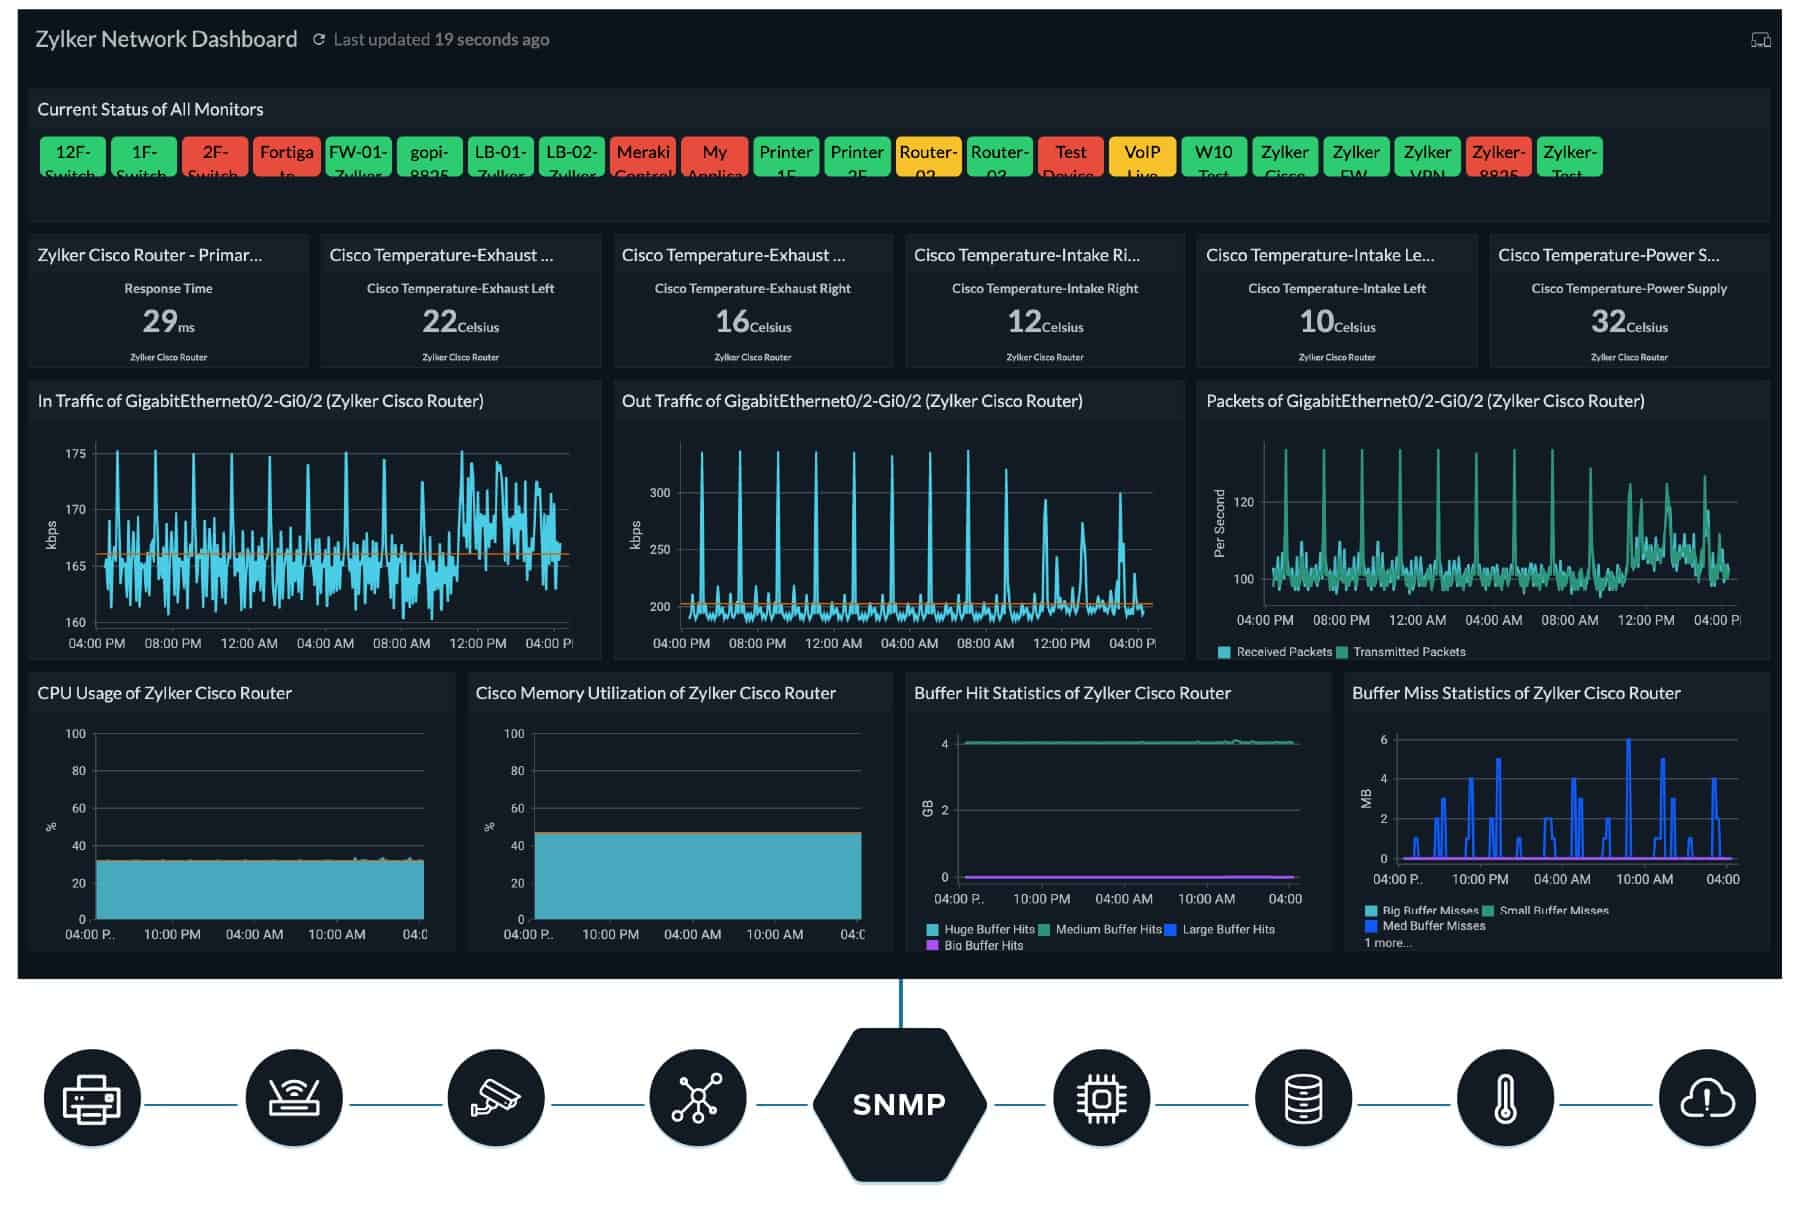
The Site24x7 system is equipped with the ability to communicate through the NetFlow, IPFIX, sFlow, J-Flow, cFlow, AppFlow, and NetStream protocols. It can collect data with different protocols from different devices simultaneously. The information gathered by this process is displayed in the console for the monitoring system in the form of tables and graphs.
The Network Traffic Monitoring service is able to identify traffic patterns per link over time. This is helpful because it will register sudden surges or drops in traffic volumes in each location. The monitors can have performance expectation thresholds placed on them and they will trigger alerts if they are crossed.
The analytical tools in the Site24x7 Network Traffic Monitoring package enable capacity planning and identify bottlenecks where traffic shaping needs to be implemented or where tasks can be shifted out of hours to relieve pressure.
Who is it recommended for?
This package is suitable for use by any company that runs a network. Site24x7 sizes its base plans to suit the smallest companies and then larger organizations pay for extra capacity. Site24x7 bundles all of the monitoring units on its platform together into plans. So buyers get device monitoring, server monitoring, and application monitoring along with the traffic monitoring service.
Pros:
- Alerts for traffic bottlenecks: Sent as notifications by email or SMS
- Capacity planning features: Perform historical analysis
- Full stack observability: Combines with server and application monitoring
Cons:
- Only available as a SaaS platform: No on-premises version
The Site24x7 system is based in the cloud and its console can be accessed from anywhere with any standard Web browser. You can examine the system with a 30-day free trial.
4. Progress WhatsUp Gold (FREE TRIAL)
The Network Traffic Analysis (NTA) module of Progress WhatsUp Gold offers businesses a powerful tool to gain in-depth visibility into their network traffic and bandwidth utilization. By capturing detailed data on network activity, the NTA module allows IT teams to identify patterns, detect anomalies, and optimize the use of network resources.
Key Features:
- Real-Time Traffic Monitoring: Provides live visibility into network traffic, allowing administrators to detect issues as they occur.
- Flow-Based Technologies: Supports NetFlow, sFlow, and J-Flow to collect detailed data on network traffic.
- Bandwidth Utilization Reports: Generates reports showing bandwidth consumption by device, application, or protocol to help optimize network performance.
Why do we recommend it?
WhatsUp Gold’s Network Traffic Analysis (NTA) module is notable for its ability to provide real-time insights into bandwidth usage and network traffic. Its integration with other monitoring features allows IT teams to detect bottlenecks, troubleshoot issues, and optimize performance, making it a valuable tool for automated system monitoring, troubleshooting, and capacity planning..
The NTA relies on the core module of WhatsUp Gold for network discovery. That main package is a network device monitoring service. The Network Traffic Analysis module provides insights into which devices or applications consume the most bandwidth, enabling network administrators to pinpoint potential bottlenecks or areas of inefficiency. This level of granular analysis helps organizations ensure optimal network performance while minimizing the risk of congestion and downtime.
The module uses flow protocols such as NetFlow, sFlow, and J-Flow. These extract traffic data from routers and switches across the network. The range of protocols used by the tool is important because different network device manufacturers ship their products loaded with different query language standards. So, the tool is able to communicate with the devices of many different vendors – you don’t end up with data blindspots.
Collected data is used to generate reports and visualizations, helping IT teams to identify top talkers, bandwidth-heavy applications, and network traffic trends over time.
The module’s real-time and historical analysis features allow for quick identification of performance issues and enable businesses to make data-driven decisions on network capacity planning and optimization.
Who is it recommended for?
This module is recommended for network administrators, IT professionals, and businesses of all sizes that require detailed visibility into their network traffic and bandwidth usage. It is suitable for organizations lthat need to optimize network performance, troubleshoot issues, and prevent bottlenecks in complex network environments.
Pros:
- Top Talkers & Applications: Identifies the devices and applications consuming the most bandwidth, allowing teams to pinpoint potential bottlenecks.
- Historical Traffic Analysis: Provides historical traffic data to detect long-term trends and optimize future capacity planning.
- Customizable Alerts: Configures alerts to notify administrators of unusual traffic patterns or bandwidth spikes, enabling proactive issue resolution.
Cons:
- Not a Standalone Service: You need to buy a full stack observability package to get the Network Traffic Analysis unit.
WhatsUp Gold is a software package for Windows Server. It is available in five editions: Business, Enterprise, Enterprise Plus, and Enterprise Scale. You need to get one of the two top plans – Enterprise Plus or Enterprise Scale – to access the Network Traffic Analysis unit. You can assess the system by accessing a 30-day free trial.
5. Noction Flow Analyzer
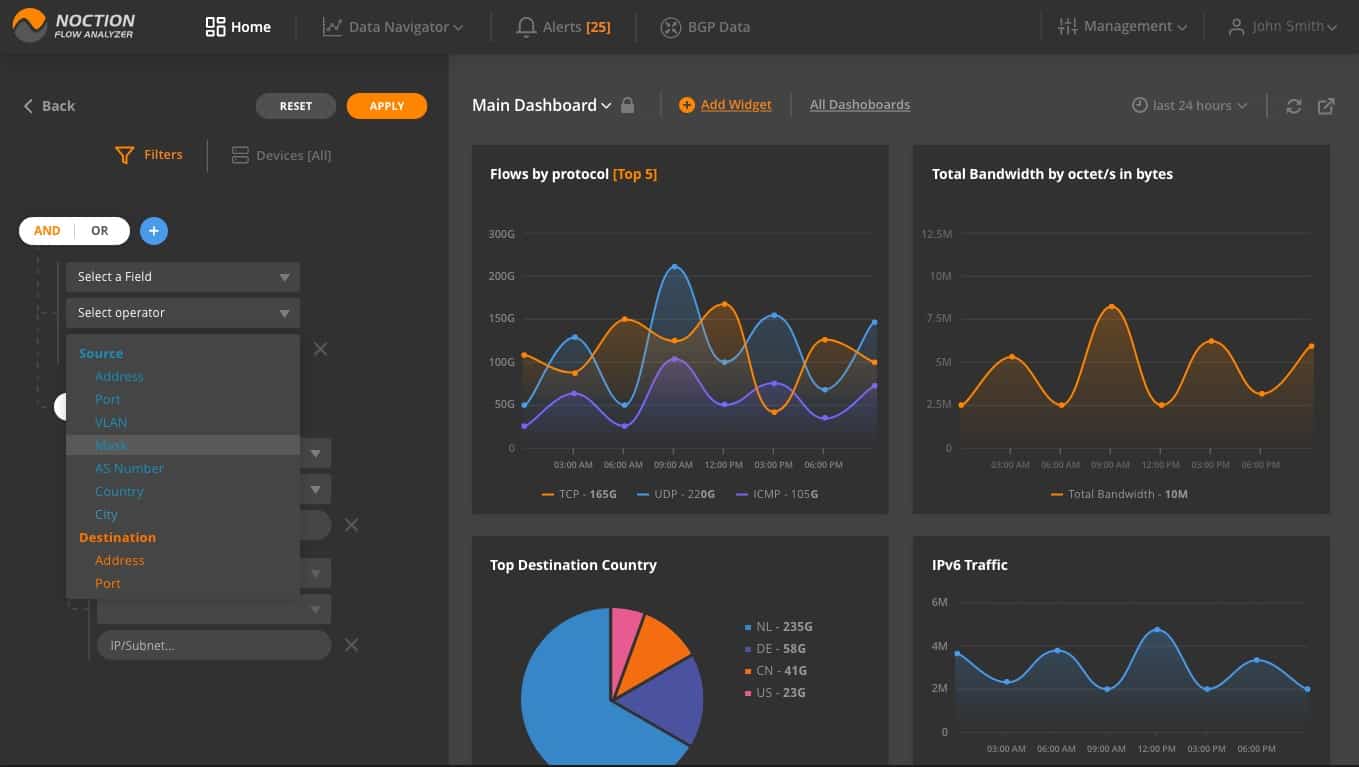
Noction Flow Analyzer is a package of network traffic analysis systems for bandwidth monitoring, capacity planning and BGP data evaluation. The analyzer relies on data collected by the network traffic monitor. While interpreting the collected data and displaying it in the system dashboard, the Noction system also stores it. That data is collected from switches and routers.
Key Features:
- Uses traffic flow protocols: NetFlow, J-Flow, sFlow, NetStream, and IPFIX
- Internet route analysis: A Traceroute-based utility
- Network traffic monitoring: Live activity tracking
Why do we recommend it?
Noction Flow Analyzer is by far the most flexible tool on this list. However, many network managers probably won’t have enough time to play with it, so the automated monitoring systems in our review would seem to be more practical. This tool lets you perform manual analysis and make decisions over how to manage traffic.
The data collector uses the NetFlow, IPFIX, sFlow, NetStream, and J-Flow systems to communicate with network devices. This range of capabilities is necessary because many equipment manufacturers have created their own statistical querying language, which is pre-loaded on their devices. Other manufacturers rely on the industry standards, sFlow and IPFIX. By including the capability to use all of these systems, Noction has made the Flow Analyzer able to monitor multi-vendor sites.
The analyzer will display traffic data related to a requested period. This data can be filtered and sorted to focus on the traffic generated by each protocol. It is also possible to identify the traffic volumes generated by each endpoint and which endpoints receive more traffic than others.
The traffic analyzer enables you to predict future bandwidth requirements for the network and alter its architecture accordingly.
Various alerts can be set up in the Alerts section. Notifications can be sent to technicians via email or Slack. That means the IT Operations staff can assume that the network is operating well unless they are notified.
Who is it recommended for?
This tool is a little pricey and small businesses won’t be interested in all of its features. This is a specialist network traffic analysis package for large networks that are team-managed. The system is also able to analyze the routing tables of your edge routers with the addition of an add-on.
Pros:
- Identifies network and internet routes: Spots problems such as latency and packet loss
- Tracks traffic flows: Alerts for conjected links
- Network capacity planning features: Identify opportunities for rerouting
Cons:
- Not a SaaS package: You host the software yourself but pay a subscription
Noction Flow Analyzer installs on Linux – Ubuntu, CentOS, or RHEL. The system is charged on a subscription basis with a rate per month and per year. You can get a free trial to examine Noction Flow Analyzer for yourself.
6. SolarWinds NetFlow Traffic Analyzer
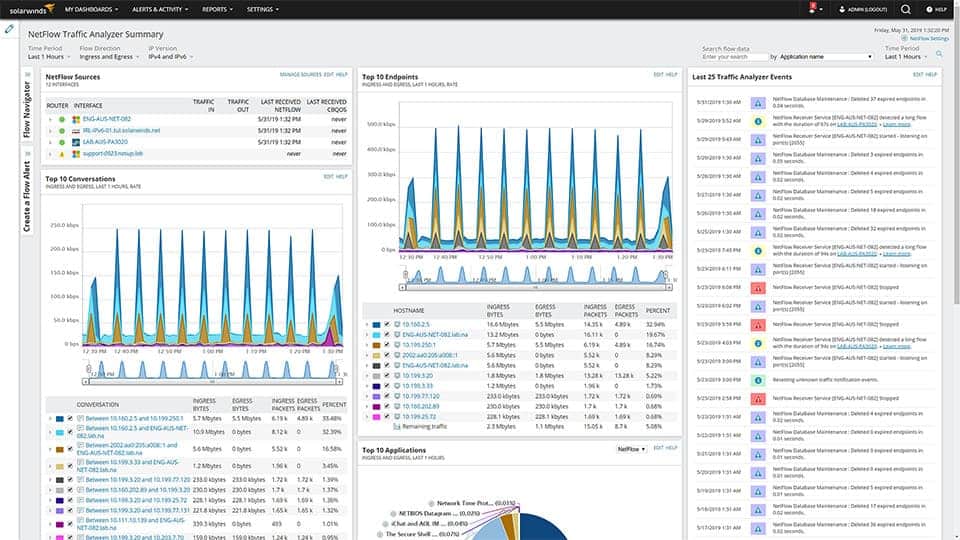
The SolarWinds NetFlow Traffic Analyzer is available as a standalone monitor or as part of the Network Bandwidth Analyzer Pack, which also includes the Network Performance Monitor. The NetFlow Traffic Analyzer uses the packet analysis utilities built into network equipment to get packet samples and throughput metrics. These systems include Cisco NetFlow, J-Flow from Juniper Networks, and Huawei’s NetStream, plus the sFlow and IPFIX systems. The tool also interprets NBAR2 data from Cisco devices.
Key Features:
- Flow protocols: NetFlow, J-Flow, sFlow, NetStream, and IPFIX
- Protocol analysis: NBAR2 for traffic classification
- QoS analysis: Identify traffic anomalies
- Good for VoIP: Mean Opinion Score
- Resolves bottlenecks: Traffic shaping measures
Why do we recommend it?
The SolarWinds NetFlow Traffic Analyzer provides full traffic statistics gathering capabilities in any multi-vendor environment. It uses all of the known traffic statistics protocols that are all loosely based on NetFlow from Cisco Systems. The package gives you protocol analysis as well, so you can see which applications are gobbling up your bandwidth.
It is possible to watch this collected data live on the screen. However, the real analysis only takes place on stored data. The utility is able to identify VLANs, such as simultaneous voice traffic on the network. Live data features include throughput thresholds that will alert you if traffic starts to push to the limit of the network’s capacity.
The data analysis screens will show the top traffic-generating applications and it can also segment data by source and protocol/port. Time-based charts display the peaks and troughs in traffic volumes over hours, days, or months. This will enable you to assess the times of peak demand so that you can shift batch jobs and downloads to less critical hours.
Remediation tools in the utility include traffic shaping measures, that you can implement and manage queue-based traffic shaping measures, such as Class-based Quality of Service.
Who is it recommended for?
This package is intended for use by large organizations with a lot of network devices to look after. The software runs on Windows Server and requires the SolarWinds Network Performance Monitor to also be installed. This duo provides network discovery, topology mapping, device health status checks, and traffic flow tracking.
Pros:
- Path analysis: Lets you track traffic from point to point
- Device capacity utilization: Shows congested devices
- Top talkers report: Identifies big traffic generators
- Automated monitoring: Alerts for traffic problems
- Packet capture function: Derives header statistics
Cons:
- No SaaS version: Only available for Windows Server
Both the Network Performance Monitor and the NetFlow Traffic Analyzer will cover LANs, wireless networks, WANs and connections to Cloud services. Both of these tools install on Windows Server and they are written on a common platform, so they can interact. This data exchange enables a number of common modules, including PerfStack, which shows the underlying resources supporting each application and their live statuses. You can get a 30-day free trial of the NetFlow Traffic Analyzer.
7. Elastic Stack
Netherlands-based Elasticsearch B.V. has hit on a very successful niche market with Elastic Stack. Many software buyers feel restricted by the all-inclusive packages of monitoring and analysis systems and would prefer to select the best-of-breed for each network analysis function. Elastic Stack works together in order to capture packets, analyze them, and display the results but each element can be deployed separately and used in concert with tools from other providers.
Key Features:
- Free version: Download and host each component
- Hosted option: This version isn’t free
- Modular and flexible: Create your own applications
Why do we recommend it?
Elastic Stack is also known as ELK. It is a great data collection and analysis package. However, it doesn’t provide traffic analysis out of the box. You can assemble your own traffic analysis system and feed NetFlow data into the tool, sort it with Elsticsearch, and then create widgets in Kibana to display it.
The business started up with its Elasticsearch product and still carries that name for the company. This tool searches through logs and stored packet streams. It then derives statistics from those searches. You use this search engine as an analytical tool.
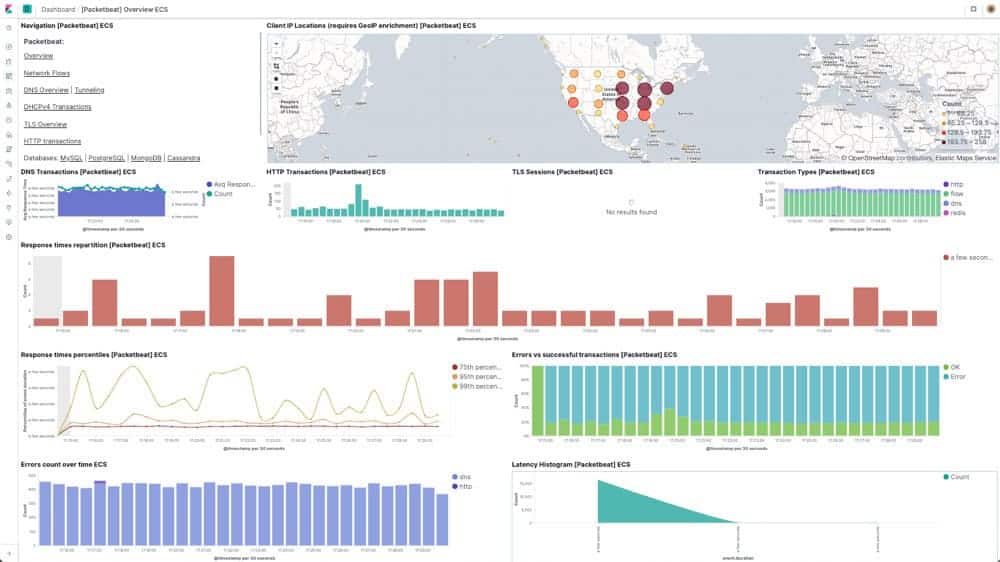
Kibana is the front end of Elastic Stack. This is the star of the stable and is widely recommended by many other network analysis tools. There are many open-source network traffic analysis tools out on the market that have been developed by geniuses that just can’t be bothered with a presentation. These very good systems skip the trouble of creating a dashboard and just tell their users to install Kibana instead.
Kibana was built to interact with many backend data gathering and interpolation systems, such as OSSEC. However, it was specifically written to work with Elasticsearch. The tool has very attractive data visualizations and the screens can be customized. The interoperability with Elasticsearch means that the queries you perform in Kibana get implemented by Elasticsearch, with the results returned to the Kibana data interpretation system.
Logstash is the lowest layer of Elastic Stack. This is a log server and can create storage files for a wide range of data. For traffic analysis, you could use a free pcap tool to feed into the stack via Logstash.
Who is it recommended for?
This tool isn’t suitable for a busy network manager who won’t have time to set up a traffic analyzer. This service is available as a hosted system, which is a subscription service, or you can download each element of the stack individually for free.
Pros:
- A suite of data processing utilities: A group of useful tools for collecting, analyzing, and viewing data
- Create your own application: Any input, any search, any display format
- Interpret data into graphs and charts: Kibana is a highly-rated frontend creator
Cons:
- Not a pre-written traffic analyzer: You have to write it yourself
The Elastic Stack programs are free to use and they are available for Windows, Linux, and macOS. Elastic Stack is also available in a supported version for a fee. There is a Cloud-based service for Elastic Stack, called Elastic Cloud.
Related post: Best J-Flow Monitoring Tools
8. Plixer One
Plixer One is a stand-alone traffic analyzer that is available as an appliance, as a virtual appliance, or as a Cloud service. The focus of this tool is to identify security threats.
Key Features:
- Traffic flow protocols: Uses NetFlow, J-Flow, sFlow, NetStream, and IPFIX
- Deployment options: Network device, virtual appliance, or cloud package
- Processes large volumes of traffic data: Create your own searches
Why do we recommend it?
The Plixer One platform provides network traffic analysis for performance monitoring and for security protection. The traffic performance analyzer. Uses multiple protocols, s it can interface with the devices of all the major providers. It collects data simultaneously from different devices on the network, showing traffic flow changes per link.
Plixer One gathers packets and metrics with NetFlow, IPFIX, NetStream, J-Flow, and sFlow. The system communicates with switches, routers, firewalls, servers, and wireless access points. Data collection occurs simultaneously at many points on the network. All of the passing data is shown in live graphs as it occurs, but it is also stored for security analysis. The multiple viewpoints can be useful for traffic analysis as well as for security processes because they show up bottlenecks in the system.
All of that data gathering produces very large volumes of information – up to 10 million flows per second. However, the Plixer One interpolation engine is built to handle that much volume. Although the system is intended to work with stored data, it operates on a sliding window and gets started including new data as soon as it comes in. This gives it a “near live” capability that is able to spot security breaches almost immediately. You don’t have to wait to find out a couple of days later that there has been a serious problem. Incidences appear as override alerts in the system performance monitoring screens.
Who is it recommended for?
You would get more value out of the Plixer system if you are also in the market for a security monitoring tool. The combination of traffic analysis for performance and for security seems to be a good idea and the tool’s ability to process large volumes of data is ideal for threat hunting.
Pros:
- Dual purpose: Use for performance monitoring or security analysis
- Security threat analysis: Scan for anomalous activity
- Traffic management: Plan capacity expansions
Cons:
- No options to integrate with IT asset management systems: Look for a separate Service Desk system
Plixer One is marketed on a subscription model with two service levels: Enterprise and Core. Both plans allow you to schedule data collection and reporting. Plixer offers a free demo.
9. Open WIPS-NG
Key Features:
- Wireless networks: WiFi packet sniffer
- Packet capture: Also packet injection
- Free to use: There is no paid version
Why do we recommend it?
Open WIPS-NG is a wireless traffic analyzer. This system isn’t just for analysis because it identifies threats and implements responses. The free package includes a sniffer that can also send out traffic, which makes it a capacity-testing tool as well. The software hasn’t been updated for more than 10 years, which would usually make use recommend that you avoid it.
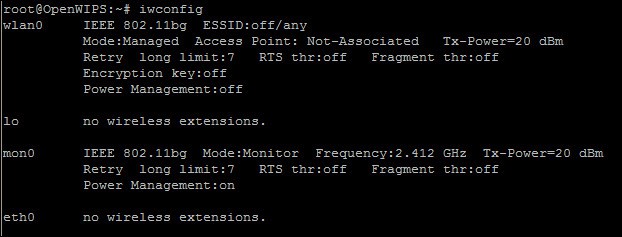
The traffic analyzer includes three elements: a sensor, a data processor, and an interface. The sensor is a two-way communication channel, so it acts as an implementor of mitigation strategies when any malicious activity is spotted.
The sensor is a wireless packet sniffer. It collects packets constantly and sends them to a file. The file is a source for the server program, which implements detection rules, looking for signs of intrusion. The results of security checks are displayed in the interface.
Remediation can be implemented automatically. If an intruder is spotted, the server program sends a command to the wireless AP via the sensor to kick that user off the network.
Who is it recommended for?
Open WIPS-NG has very few rivals, which is probably why it is still in use. The system’s uniqueness lends it to many uses. It can be used for research, in a similar manner to its sister tool, Aircrack-NG. However, it doesn’t have the system-breaching capabilities of that other system.
Pros:
- Security monitoring through traffic capture: Can also be used for penetration testing
- Options for automated responses: Kick an intruder out
- Traffic assessments across packets: Aggregates data to identify patterns of malicious activity
Cons:
- Getting old: Hasn’t been touched since 2012
- No support: You’re on your own
Open WIPS-NG is an open-source project. The software can only be run on Linux.
Exploring network traffic analysis
As this report makes clear, there are two main reasons to conduct network traffic analysis: network performance enhancement and security checks. This guide aimed to rate the best in both of these worlds. If you have a favorite network traffic analysis tool that isn’t on this list, leave a message in the Comments section below and share your experience with the community.
Network Traffic Analysis FAQs
Why is it important to perform a network traffic baseline definition analysis?
A baseline provides you with a pattern of normal behavior on your network. It is useful to establish regular traffic patterns per application. This allows you to detect abnormal activity if traffic for a specific protocol suddenly rises.
What is network traffic analysis?
Network traffic analysis can be used for capacity planning and also for security monitoring. In both cases, analysis of the headers of circulating data packets can give you a running total of traffic per endpoint and per protocol. With a stored history of traffic patterns, you can identify unexpected increases in traffic per source and per protocol.


