

Pulling up information at the touch of a button from a database is something that most organizations take for granted. Now that database management systems like Apache Cassandra have enabled organizations to store data in high availability format, top-tier performance is an expectation. In this article, we’re going to look at what Apache Cassandra is and the nine best tools to monitor it.
Here is our list of the best tools to monitor Apache Casandra:
- ManageEngine Applications Manager EDITOR’S CHOICE Also compatible with MongoDB, has a great dashboard that can monitor clusters and more. Download a 30-day free trial.
- Site24x7 Cassandra Monitoring (FREE TRIAL) A monitor for networks, servers, services, applications, and websites that includes database monitoring for Cassandra plus other DBMSs. Start a 30-day free trial.
- Datadog Apache Cassandra Monitor A system infrastructure monitoring package from a cloud platform that includes database monitoring, linked into an application dependency map.
- Sematext Apache Cassandra Monitoring This monitoring service is part of the Sematext Infrastructure Monitoring package that also monitors other applications plus servers and networks. Structured as a SaaS package or for hosting over Docker.
- AxonOps 3-in-1 Cassandra Operations This tool combines monitoring, maintenance, and backup services for Cassandra systems in the one package.
- Dynatrace Automatically detects Apache Cassandra databases, can get into depth on the data it gathers.
- AppDynamics Also auto-detects Apache Cassandra databases and offers good monitoring and tracking options.
- Splunk Cassandra Monitoring This is part of the Splunk Observability platform, which uses distributed tracing to track Cassandra activity. Runs on Linux or Kubernetes.
- SolarWinds Server & Application Monitor Great for monitoring Linux or Unix including nodes stats, tracking, and network health.
- Instaclustr A database management service that can host your Cassandra databases or monitor your Cassandra system remotely as a managed service.
- Instana This monitor is good at providing metrics right down to the node level.
What is Apache Cassandra?
Apache Cassandra is an open-source NoSQL database built to handle very large datasets across distributed systems. Originally created at Facebook to enhance Inbox search, it was open-sourced in 2008 and became an Apache top-level project in 2010. Its architecture is designed for enterprises that require fault tolerance, continuous availability, and the ability to scale seamlessly as data volumes grow.
Core Features:
- Peer-to-Peer Architecture: Every node in a Cassandra cluster functions as a peer, eliminating single points of failure and supporting uninterrupted service.
- Horizontal Scalability: Nodes can be added to a cluster on-the-fly, allowing capacity to increase without downtime.
- Replication for High Availability: Data is duplicated across nodes to maintain access even if some nodes fail.
- Optimized Performance: Cassandra excels in write-heavy workloads while supporting fast reads, with consistency levels that can be tuned to application needs.
- Flexible Schema: Tables and columns can be modified dynamically, avoiding service interruptions during schema changes.
Cassandra is commonly used for real-time analytics, IoT platforms, time-series tracking, and other high-volume transactional systems. Major organizations such as Netflix, Uber, and Spotify leverage it for reliable, scalable data management.
Unlike relational databases, Cassandra favors performance over complex queries, avoiding joins in favor of a column-family model inspired by Google’s Bigtable. Its design makes it particularly suitable for distributed applications that require continuous uptime and efficient processing of large-scale data streams.
The best tools for monitoring Apache Casandra
Our methodology for selecting Cassandra monitoring systems
We reviewed the market for Cassandra monitoring tools and analyzed the options based on the following criteria:
- Full stack infrastructure monitoring
- Application dependency mapping that shows Cassandra’s activities in context
- The ability to monitor Cassandra on any platform
- An integration that extracts activity data from within Cassandra instances
- Alerts for performance problems
- A free trial or a demo service that allows an assessment to be carried out before paying
- Value for money from a monitoring system that is offered at a fair price
1. ManageEngine Applications Manager (FREE TRIAL)
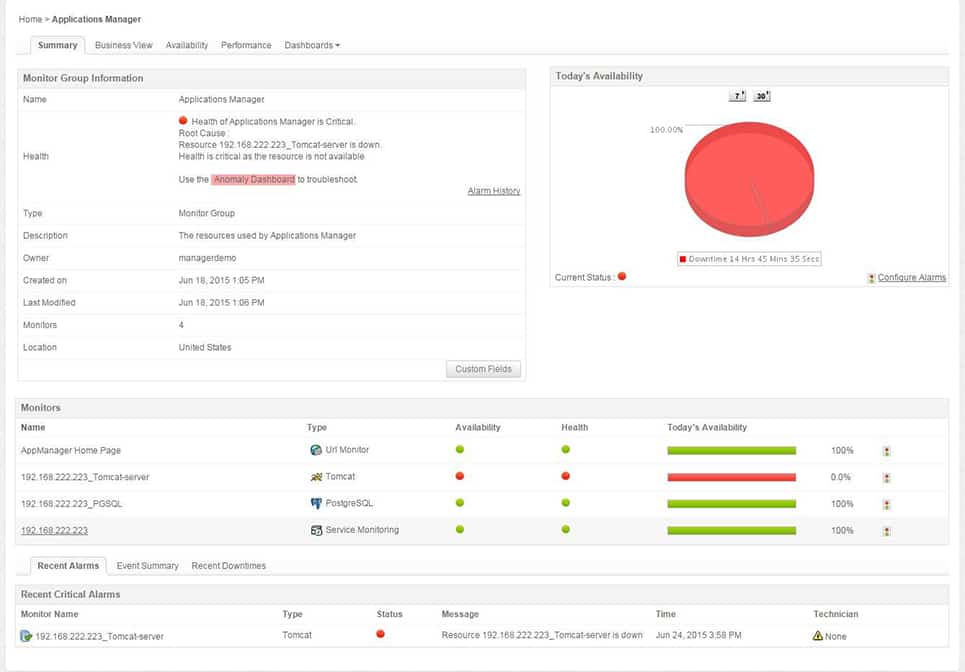
ManageEngine Applications Manager is an application monitoring tool that is compatible with Apache Cassandra and MongoDB. Performance metrics you can monitor with ManageEngine Applications Manager include CPU usage, operational performance, latency, pending tasks, and memory utilization. The dashboard has been designed specifically to help you monitor clusters, and breaks down the health status of individual clusters in a list format.
Key Features:
- Cassandra Instance Monitoring: Also MongoDB
- Server Monitoring: CPU, memory, and disk space
- Application Dependency Mapping: Useful for root cause analysis
Why do we recommend it?
ManageEngine Applications Manager is similar to SolarWinds Server & Applications Monitor. Both systems discover, record, and map all software, services, and server resources. This package has the edge over SolarWinds because it also includes distributed tracing for Web applications. Apache Cassandra is one of the many technologies that this package monitors.
Beyond the dashboard, there are many different performance graphs that show you how Cassandra is performing. There are graphs for memory utilization, CPU usage, and storage statistics. For example, the memory utilization graph shows you how used memory, free memory, and total memory has changed over time.
There are three versions of ManageEngine Applications Manager: Free, Professional and Enterprise. The Free version supports up to five applications or servers free of charge. The Professional version starts at 25 monitors for $945 (£756) up to 250 monitors for $7,195 (£5,759).
Who is it recommended for?
This package has scaleable pricing, so it is suitable for businesses of all sizes. There is a Free edition for small businesses that is limited to monitoring five assets. That should be enough if you only want to monitor Apache Cassandra. This software package runs on Windows Server, Linux, AWS, and Azure.
Pros:
- System Discovery: Detects databases, server hardware, and devices
- On-Premises and Cloud Deployment Options: Windows Server, Linux, AWS, or Azure
- Log Monitoring: Tracks database health and stores the evidence
Cons:
- No SaaS Option: The cloud-hosting options give you the responsibility of managing the software
The Enterprise version costs $9,595 (£7,680) for 250 monitors up to $83,995 (£67,238) for 5000 monitors. You can add additional monitors up to 10,000 monitors in total. You can download the 30-day free trial.
2. Site24x7 Cassandra Monitoring (FREE TRIAL)

Site24x7 Infrastructure is part of a cloud-based platform of monitoring tools. It monitors all of the applications, services, and resources that lie behind front-ends software or Web pages. This includes applications, such as databases. This service is able to monitor Cassandra and also other DBMSs. It can monitor SQL Server, MySQL, Oracle, PostgreSQL, DB2, MongoDB, VoltDB, CouchDB, and ClickHouse databases.
Key Features:
- Full Stack Monitoring: Networks, servers, services, software, and cloud platforms
- Cassandra Plug-In: Adds a monitoring screen in the dashboard
- Alerts for Performance Problems: Forwarded as notifications by SMS, email, voice call, or instant messaging post
Why do we recommend it?
Site24x7 Cassandra Monitoring is part of a cloud-based monitoring service from the same company that runs ManageEngine. This platform provides packages that cross competencies rather than dividing up the monitoring of each asset type into separate subscriptions. The plans include an integrations library that has a package for Cassandra monitoring.
Cassandra database monitoring activities performed by Site24x7 Infrastructure include transaction monitoring, server resource usage monitoring, and log file collection. The Site24x7 system includes an application stack map. This identifies all of the interdependencies among applications and resources. This allows the service to trace performance issues from a Web page or software packages through the applications that support it, such as a Cassandra database instance, down to the resources of the server and network.
The Site24x7 Infrastructure service includes AI-based performance thresholds. If performance drops or if unusual activity is detected, the service raises an alert. The tool is able to forward alerts to technicians by SMS, email, voice call, or instant messaging post. This means that operations staff don’t have to sit and watch the dashboard waiting for things to go wrong.
Who is it recommended for?
This service is suitable for all sizes of businesses. Site24x7 sizes its base plans for small businesses and then large businesses pay for greater capacity. So, this is a scaleable system. The platform is based in the cloud and can monitor Apache Cassandra no matter where you run it.
Pros:
- Multiple DBMSs: SQL Server, MySQL, Oracle, PostgreSQL, DB2, MongoDB, VoltDB, Cassandra, CouchDB, and ClickHouse
- Graphical Data Representation: Charts, network maps, and inventory reports
- Log Management: Provides data for manual analysis
Cons:
- Can’t Buy Modules Individuals: All plans provide all the modules on the platform
Site24x7 Infrastructure is a subscription service that costs $9 per month when paid annually. You can get it on a 30-day free trial.
3. Datadog Apache Cassandra Monitoring

Datadog APM is a SaaS platform that covers a long list of applications, including Apache Cassandra and other RDBMSs. Datadog has a library of integrations, including those with Apache products, such as Apache Cassandra.
Key Features:
- Specialist Monitoring Extension: Cassandra integration
- Constant Monitoring: Extracts live instance activity data
- Multi-Level Observations: Links to server activity
- Performance Alerts: Warn of problems with Cassandra
Why do we recommend it?
Datadog Apache Cassandra Monitoring is part of the Infrastructure monitoring module on the Datadog platform. This is a core module that links together server and software monitoring and also feeds through to network monitoring. The package has a library of extensions that provide special status extraction from specific technologies, such as Apache Cassandra.
The screens of the dashboard are packed with information. If the standard screen seems too busy, you can create your own home page with the metrics that matter most to you. It is even possible to combine widgets from different pages, giving you a stack overview showing database, server, and network performance overviews all in one place.
It isn’t possible to watch all of the performance statuses of your database all of the time. However, this is not a problem because Datadog Infrastructure sets performance threshold levels on every metric and alerts you if one gets tripped. This service enables you to get on with other tasks rather than spending all of your time monitoring your Apache Cassandra databases.
Who is it recommended for?
Being a cloud-based system, this package can unify the monitoring of servers on multiple sites and also cloud platforms. The service is suitable for businesses of all sizes. The tool monitors all software other than Web applications, which are covered by an APM module. You can monitor many applications together with one subscription.
Pros:
- Integrations Library Provides Specialist Functions: There are 700 of these packages
- Identifies Slow-Running Queries: Performance monitoring
- End-to-End Application Tracing: Spots error rates and bottlenecks
- Query throughput rates: Collects activity data
Cons:
- Trial Only Lasts 14 Days: Would like to see a longer trial period for testing
Datadog Infrastructure Monitoring includes an integration that enables the monitor to extract performance information directly from the Cassandra DBMS to compile live reports on performance and also store statistics for historical analysis. The Infrastructure system also monitors related systems that rely on your databases and all of those resources that support them. This chain of dependency enables you to quickly identify the root cause of any problem that might arise in your database-dependent applications. See issues within, above, and beneath your Cassandra database and isolate the true cause of performance issues quickly.
Datadog is charged for by subscription and the entire platform is split into modules of monitors. You can add on Datadog APM to get distributed tracing of all of the layers of services that support each application and the Network Performance has traffic flow analysis capabilities. All Datadog modules are available on 14-day free trials.
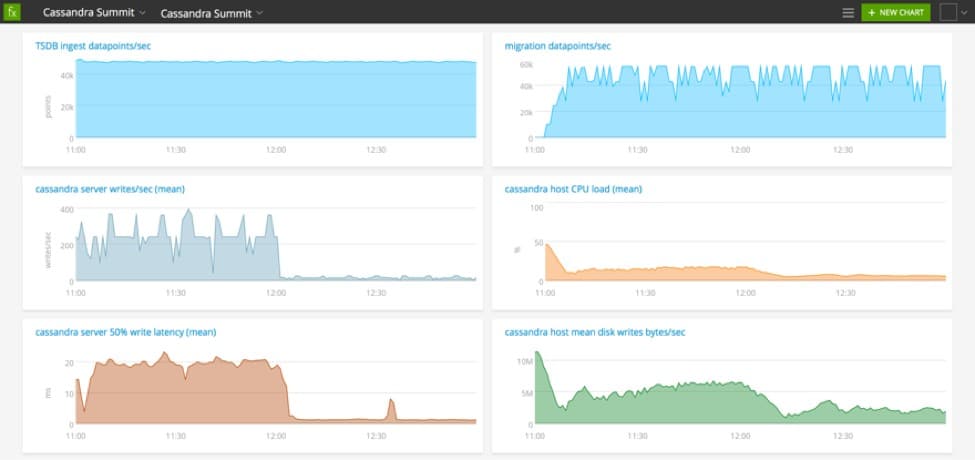
4. Sematext Apache Cassandra Monitoring
Sematext Infrastructure Monitoring covers networks, servers, and applications. It is particularly good at monitoring databases, such as Apache Cassandra. The capabilities to access metrics for Cassandra come with the Apache Cassandra Monitoring integration, which is an add-on to the main monitoring package. The plug-in is easy to access because it is available with the click of a button in the settings screens of Sematext. This service will consolidate the monitoring of many instances, which is great if you are operating Cassandra in a distributed model or in a cluster.
Key Features:
- Integration for Cassandra: Plus add-ons for other technologies
- Constructed with the Elastic Stack: Hosted in the cloud
- Free Version: Limited capacity
Why do we recommend it?
Sematext Apache Cassandra Monitoring is an integration add-on to the Apache Infrastructure Monitoring plan. Sematext charges a base price for general system monitoring that includes server and software activity tracking. The plans for this service are very cheap but they don’t include any integrations, each of which incurs a charge.
The Sematext system includes an alerting mechanism for all of the IT assets that it monitors, including Cassandra. This system will spot deteriorating performance or excessive errors and notify you of a problem by email, Slack, or Webhooks. The tool applies these performance tests to all of the metrics that it gathers from a Cassandra database instance.
Who is it recommended for?
Sematext is very affordable and small businesses can use the system for free with the Basic plan. The Apache Cassandra extension isn’t free but you can add it to whichever of the three plans you choose and pay the extra charge. Expand the platform as much as your budget allows.
Pros:
- Monitors Multiple Instances and Clusters: Live consolidated Cassandra performance monitoring
- Metrics Storage: Historical analysis
- Monitors All System Resources: Operates across platforms
Cons:
- Pay Attention When Assembling Your Plan: Longer data retention periods can push up the subscription price
Sematext Infrastructure Monitoring is free to use if you are only monitoring five hosts and accept a data retention period of 30 minutes. More hosts and longer retention periods require a paid subscription. The monitoring service is delivered as a SaaS package or you can opt to download the software and run it as a virtual appliance over Docker. Sematext is available for a 14-day free trial.
Related post: Apache Web Server Monitoring Tools
5. AxonOps 3-in-1 Cassandra Operations
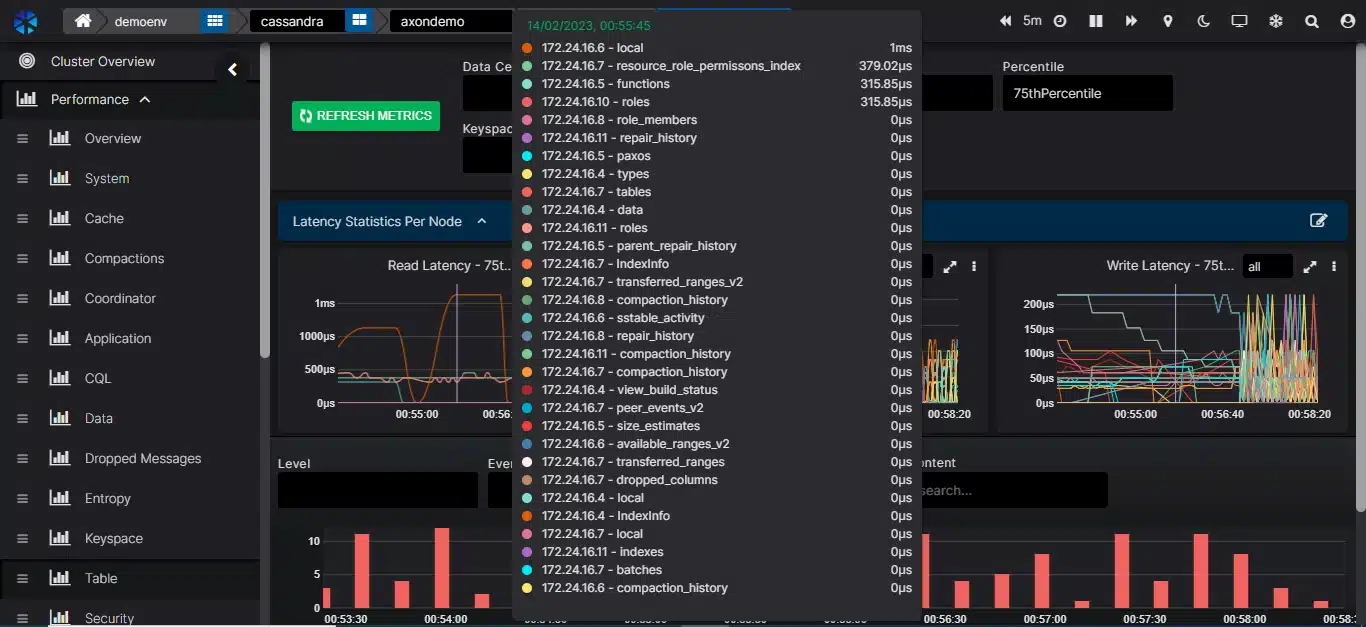
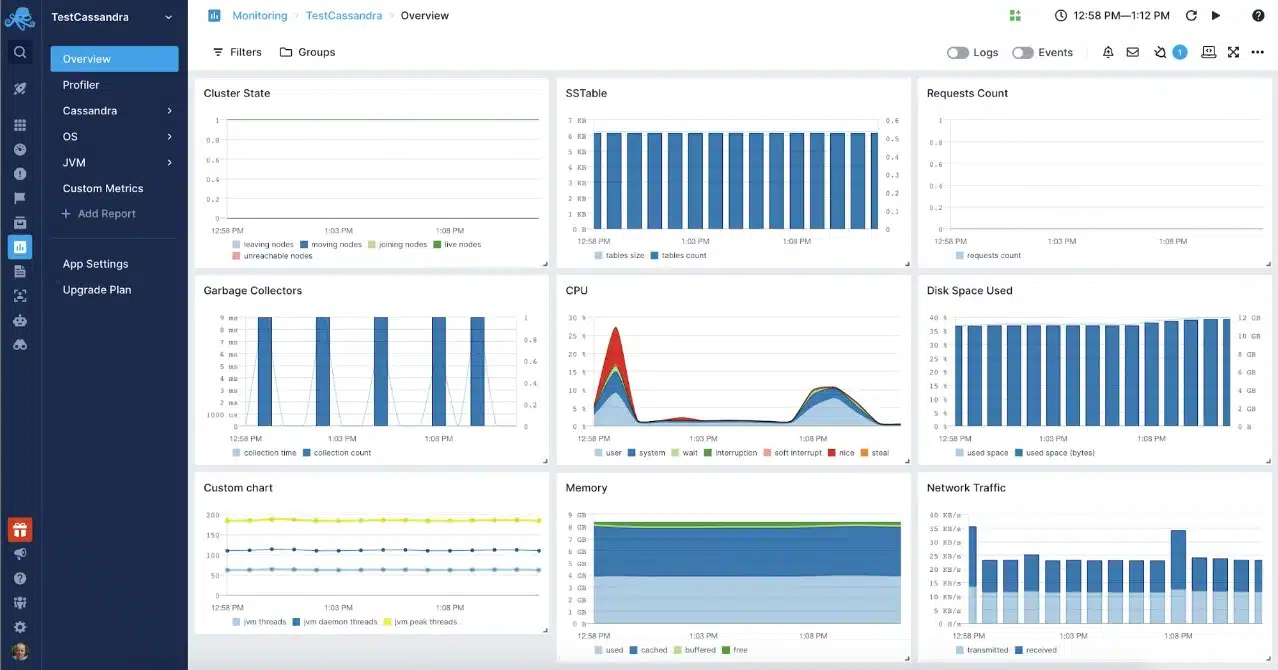
AxonOps 3-in-1 Cassandra Operations is a full management suite for Cassandra instances that is delivered from the cloud. The 3-in-1 package provides monitoring, maintenance, and backup services for multiple Cassandra nodes. This service will collect key performance metrics every five seconds and store them for historical analysis as well as displaying them live in the system console.
Key Features:
- Cloud-Based System: Specializes in Cassandra monitoring
- Enterprise Alert Integration: Slack and PagerDuty
- Adaptive Repair: Operates at times of low demand
Why do we recommend it?
The AxonOps platform provides monitoring, management, and backup functions for Cassandra implementations and that is what the title of this review describes with the 3-in-1 term. The platform only monitors Apache Cassandra, which means it is a highly specialized service. It will monitor Cassandra on cloud platforms as well as on your servers.
The AxonOps monitoring service collects a list of typical database performance metrics but you can focus on those statistics that are important to your business because the screens for the service are completely customizable. The tool includes a series of alert rules as well and you can adjust those or write your own. The alerts for performance issues are listed in the AxonOps console but you can also set up forwarding rules to get them sent to your technicians. Notifications can be sent by email, PagerDuty, Opsgenie, Slack, or Teams. They can also be channeled into ServiceNow.
AxonOps is much more than a Cassandra monitoring platform because it also provides management functions that include Cassandra log management and maintenance scheduling. The system provides a backup service as well that lets you store repositories locally, on your own cloud account, or on the AxonOps platform.
The AxonOps service maps your database nodes with the racks that they are part of along with the servers that host them. This relationship is depicted in a live performance graphic. If a database is experiencing problems, that node is displayed red in color, while healthy instances are colored green. The console includes an Adaptive Repairs system that will automatically fix problems with a node. You can also command an immediate rolling restart or schedule that action for a later time.
Who is it recommended for?
While AxonOps provides great focus on Cassandra operations, it’s specialization means that you need to switch consoles to monitor all of your other services. However, this tool is available in three editions, which match the requirements, of small, medium, and large organizations. The smallest package is the Free edition for five Cassandra nodes.
Pros:
- Tracks All the Major Performance Statistics: CPU, memory, and disk usage
- Stores Log Messages: Provides a log viewer for analysis
- Backup and Restore: Save to AWS, Azure, or Google Cloud Platform
Cons:
- Doesn’t Monitor Other DBMSs: Only tracks Cassandra’s performance
AxonOps provides monitoring, maintenance, and backup capability in one tool and it is available in in three editions. The Free Starter Subscription covers five Cassandra nodes and has a data retention period of one day. The two other plans are called Premium and Premium Plus – they do not have limits on the number of Cassandra nodes they will watch over. You can experience the way AxonOps works by registering for the free demo sandbox and the free version for up to 5 nodes.
6. Dynatrace
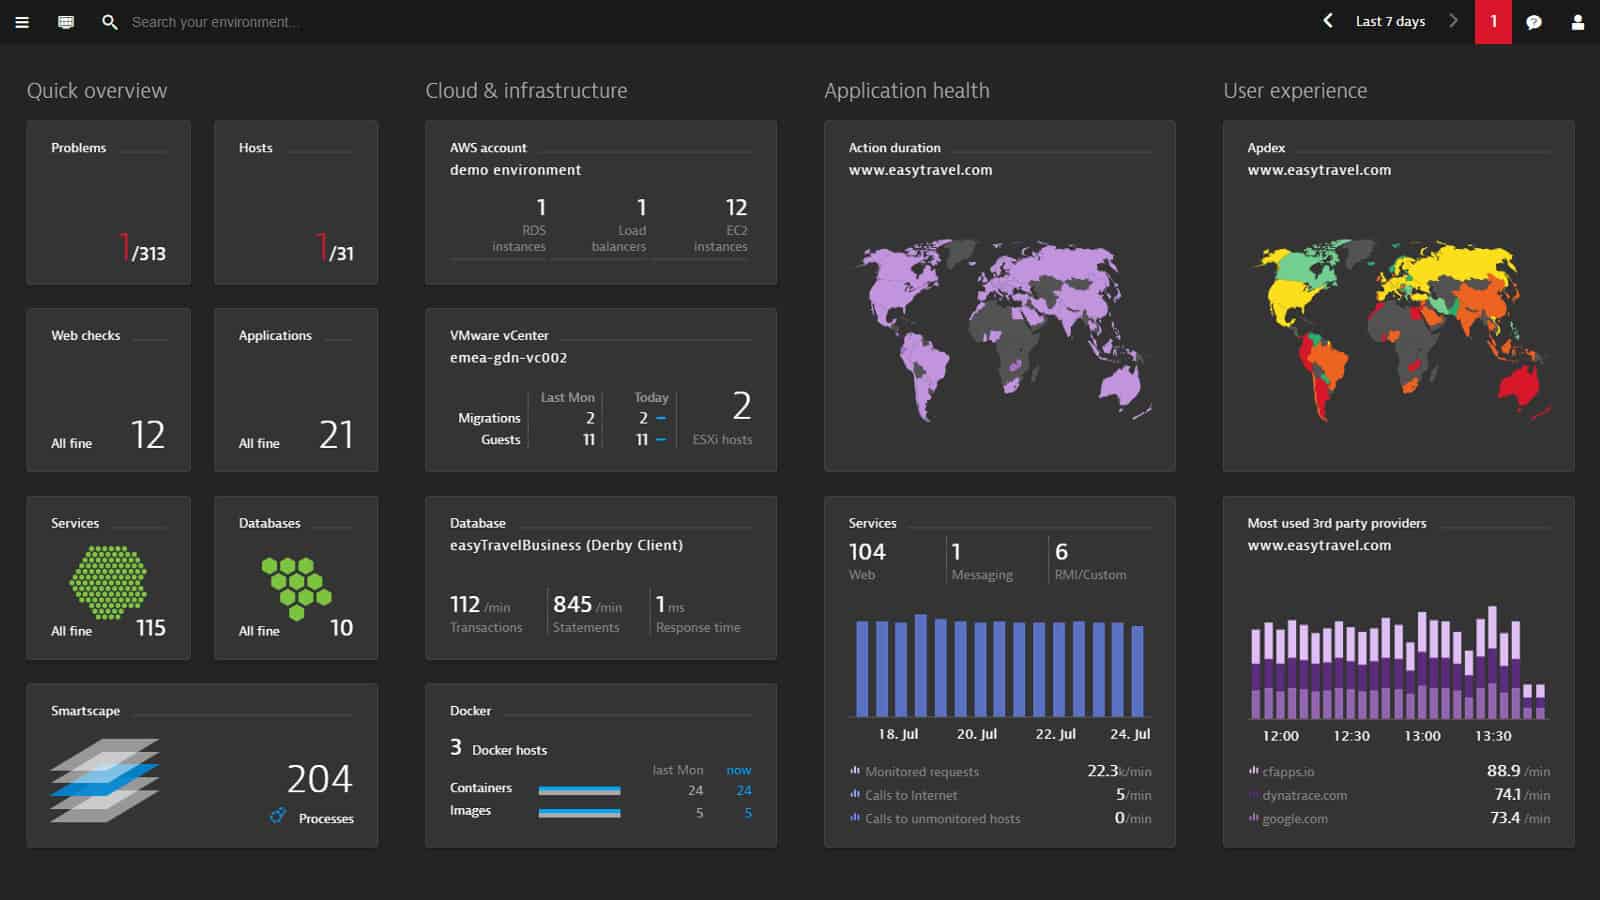
Dynatrace is an application performance monitoring tool that can monitor Apache Cassandra. Dynatrace automatically detects Cassandra databases in less than five minutes, so you can start monitoring their performance. Performance metrics you can monitor include CPU, connectivity, garbage collection time, suspension, and retransmissions. On the Further details tab, you can start looking at deeper statistics like disk usage, Cache, Hints, Load, Thread Pools, and Java Managed memory.
Key Features:
- Cassandra Database Discovery: Along with the discovery of all systems
- Predictive Alerts: Forecasts resource needs
- Root Cause Analysis: Identifies the real reason for performance problems
Why do we recommend it?
Dynatrace is a platform of services that include an Infrastructure Monitoring plan and a Full Stack monitoring package. The full-stack option includes the Infrastructure monitoring system. If you want Cassandra monitoring, you will find it in the Infrastructure Monitoring edition, which means it is also available in the Full Stack Monitoring plan.
Root cause analysis is one of Dynatrace’s strongest features. Dynatrace will be able to highlight the root cause of performance issues on individual nodes. Automating root cause analysis allows you to respond to server problems much faster by having all the necessary information on hand to make an informed response.
Who is it recommended for?
The structure of the Dynatrace plans means that t can cater to any type of business. The Full Stack Monitoring package is considerably more complicated than the standalone Infrastructure Monitoring plan and it is twice the price. So, if you are on a tight budget, you would probably opt for the Infrastructure Monitoring plan.
Pros:
- Highly Visual and Customizable Dashboards: Excellent for enterprise NOCs
- Operates in the Cloud: It is platform-independent
- Can Monitor Application Uptime: Supports infrastructure and user experience
Cons:
- Designed Specifically for Large Networks: Smaller organizations may find the product overwhelming
If you require a Cassandra monitoring tool that is easy to configure and visibility that stretches right down to the node level then Dynatrace is a tool you should definitely consider. If you want to know the price of Dynatrace you’ll have to contact the company directly. There is also a 15-day free trial.
7. AppDynamics
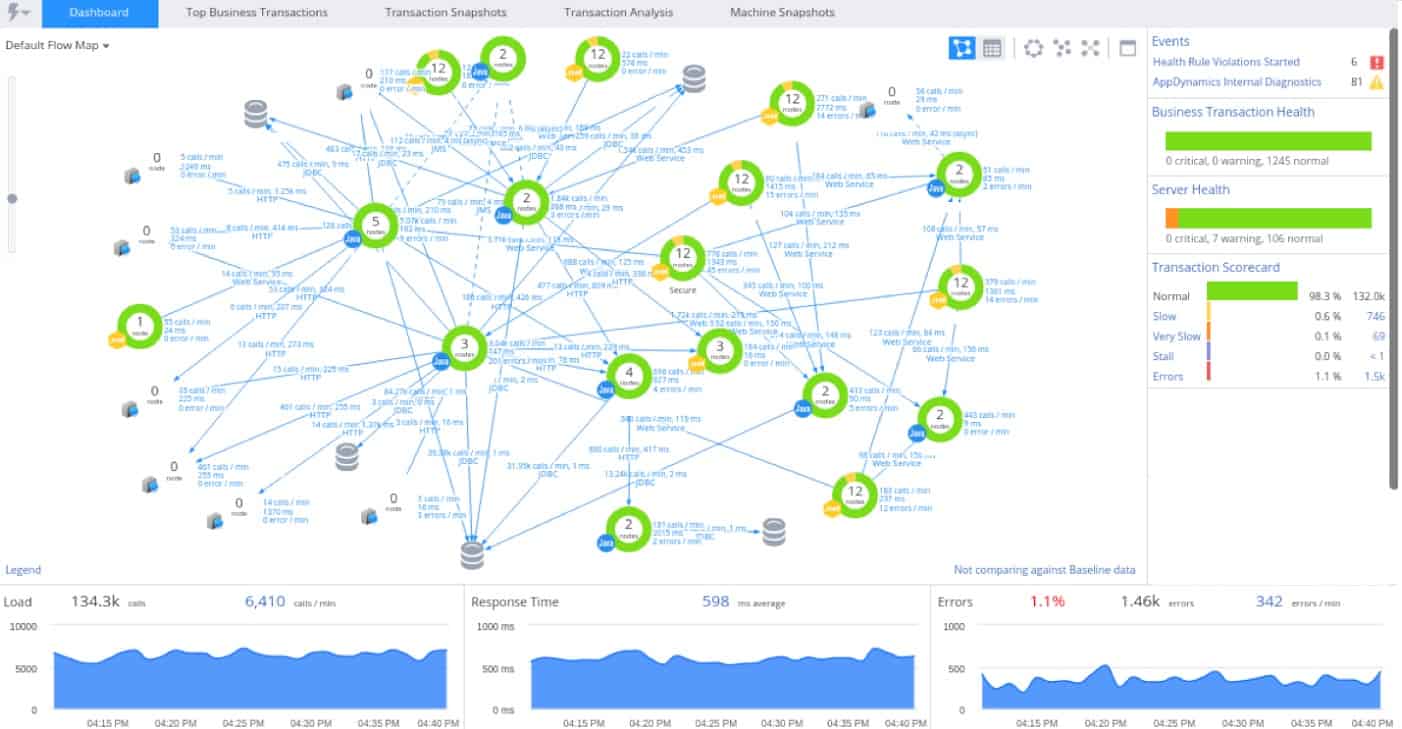
AppDynamics is another leading application management tool that can monitor Cassandra databases. With AppDynamics, you can see right down into the details of business transactions. The product automatically discovers Apache Cassandra databases and adds them to your monitoring environment.
Key Features:
- Application Discovery: Also dependency mapping
- An Infrastructure Monitoring Plan is Available: This is cheaper than the APM
- Gathers Activity Data from Within Cassandra Instances: Also scans Cassandra logs
Why do we recommend it?
AppDynamics is a close competitor to Dynatrace. It offers an Infrastructure Monitoring plan and then three observability editions, which are way more expensive than the Infrastructure Monitoring system. Fortunately, Cassandra monitoring is available in the Infrastructure Monitoring plan. You get more features, such as AI-based resource requirements projections and distributed tracing in the higher plans.
There are many different metrics you can monitor with AppDynamics. For example, by monitoring Cassandra back-end communications you can capture data on average response time, errors per minute, and calls per minute. This information gives you an overview of how the service is performing.
There are three versions of AppDynamics available to purchase; APM Pro, APM Advanced, and APM Peak. APM Pro includes business transaction monitoring as a basic package but you need APM Advanced to make use of server visibility and network visibility as well.
Who is it recommended for?
The AppDynamics Infrastructure Monitoring plan is affordable for all businesses. Small businesses might hesitate to step up to the observability plans because of the steep increase in price. However, if your main concern is monitoring your Apache Cassandra nodes, the Infrastructure Monitoring tool will do the job.
Pros:
- Tailored for Large-Scale Enterprise Use: Priced per CPU core
- Visualizations to Help Troubleshooting: Identifies related performance issues
- AI-Based Monitoring: Included in the higher APM plans
Cons:
- Deployment/Onboarding can be Complex: Leans more to web application monitoring that on-system systems tracking
APM Peak is the premium package which includes business performance monitoring, transaction analytics, and business journeys. In order to view the price of these packages, you will need to contact the sales team. You can download the 15-day free trial.
8. Splunk Cassandra Monitoring
Splunk Observability is available on Splunk Cloud or Splunk Enterprise, which runs on Linux or Kubernetes. The package has an extension that will monitor Cassandra nodes. However, that feature is only available in the Splunk Enterprise version.
Key Features:
- Hybrid Monitoring: Collects performance data from sites and cloud platforms
- Consolidates Logs: Creates a central data pool for threat hunting
- Graphs for Clarity: Aids quicker status recognition
Why do we recommend it?
The Splunk Cassandra Monitoring unit of Splunk Infrastructure Monitoring is available in the on-premises Splunk Enterprise version. This system will group statistics for multiple clusters and also examine each cluster. It provides drill-down views to get into statistics for each node. You can customize screens to see server statistics on the same page.
Splunk Observability is dividends into Splunk Infrastructure Monitroring and Splunk Application Performance Monitoring. The Cassandra monitoring system is part of the Infrastructure Monitoring unit. It is an integration, which means that you won’t find it in the base system when you access the console. However, once you activate the integration, you will see a Cassandra Monitoring page open in your console.
Who is it recommended for?
The Splunk system is able to monitor many technologies, not just Cassandra. So, if you use Splunk Observability to track activity on your Cassandra databases, you also get monitoring for all our applications plus your servers or cloud platforms. The Splunk system is not free, and the Observability platform is complicated, so it won’t appeal to small businesses.
Pros:
- A SIEM System: Log scanning for threat hunting
- Full Stack Monitoring: Track multiple technologies with one package
- Web Application Monitoring: Uses OpenTelemetry distributed tracing
Cons:
- Requires Technical Skills to Manage the Tool: A complicated monitoring package
Splunk Observability is a very competent monitoring system. However, it needs an expert technician to manage, so this is not a solution for small businesses. You will need to have highly skilled technical experts on staff to run the tool. You can get a 14-day free trial of Splunk Enterprise Infrastructure Monitoring.
9. SolarWinds Server & Application Monitor
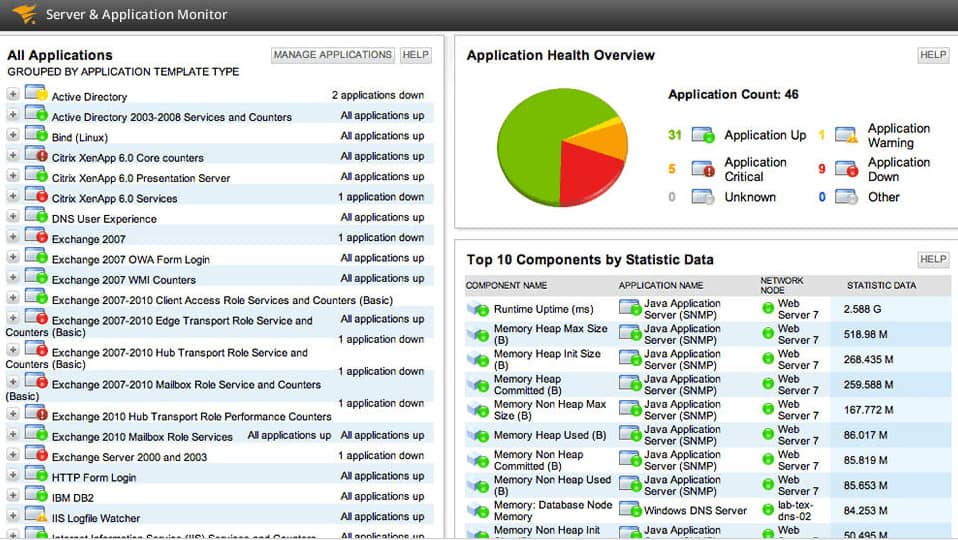
SolarWinds Server and Application Monitor is a network monitoring tool that can monitor Apache Cassandra. The tool has been designed to monitor the performance and availability of Apache Cassandra servers on Linux or Unix. Details on service health, node stats, and network tracking can all be viewed through one unified dashboard.
Key Features:
- Application Dependency Mapping: Supports root cause analysis
- Cassandra Integration: Adds a specialized screen in the dashboard
- Server Resource Monitoring: Looks at supporting services
- Activity Correlation: Service stack examination
- Log Management: Collects logs from Cassandra and other systems
Why do we recommend it?
SolarWinds Server & Application Monitor is able to discover and map all applications, services, and server resources. It then identifies all activities and extrapolates the requirements for resources, alerting in advance if it calculates that there will be a shortage. The package includes specialized scenes for some applications, including Apache Cassandra.
You can also set customized alerts on SolarWinds Server & Application Monitor. Factors monitored include increased latency or ongoing hint activity. Alerts can be viewed through the All Active Alerts page which tells you a list of all current alerts including the cause of the alert and how long it has been active.
Who is it recommended for?
This is a very valuable package and is particularly important for large businesses. While there are some very large applications that occupy an entire server, these are few. When multiple applications run on the same server there is always going to be the possibility of resource shortages during execution.
Pros:
- Scans Complex Networks: Designed with both large and enterprise networks in mind
- Tracks Supporting Infrastructure Resource Usage: Can also track Apache-specific metrics
- Proactive Alerts: Buys time to fix problems
- Fully Supports Unix and Linux Deployments: Runs on Windows Server
- Customizable Dashboards: Uses drag-and-drop widgets
Cons:
- Works Best When Supported by Technical Experts: Not suitable for small businesses
As an Apache Cassandra monitoring solution, SolarWinds Server & Application Monitor is an excellent product on account of its alerts system and its versatile dashboard. SolarWinds Server & Application Monitor starts at $2,995 (£2,397). You can download a 30-day free trial.
You can increase the details that you get on your Apache Cassandra database by taking on the Database Performance Analyzer, which is also able to monitor other DBMSs, such as SQL Server and MySQL. This module can be linked to the Server & Application Monitor and run in the same dashboard. The two systems can be bought together in the Application Performance Optimization Pack. This software runs on Windows Server and you can get it on a 30-day free trial.
10. Instaclustr
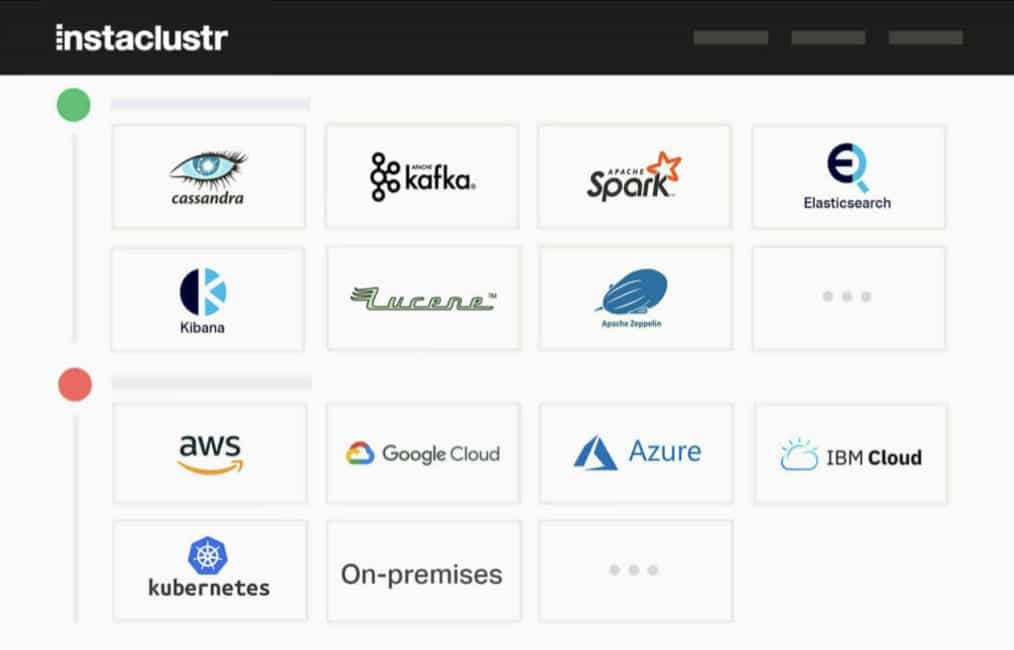
Instaclustr is a managed service provider for open-source technologies. The company offers packages for different technologies and Apache Cassandra is one of these. If you have a Cassandra cluster, you would choose the Instaclustr for Apache Cassandra. The Instaclustr technicians will manage your cluster for you and you can still examine the performance of the system by accessing the Cassandra console yourself.
Key Features:
- Managed Service: The plan includes technicians to manage your software
- Multi-Cluster Monitoring: Can extend across server locations
- Rapid Statistics Polling: Live statistics are shown in the dashboard
Why do we recommend it?
Instaclustr is a package of management services for a number of Apache tools and other open-source systems. The service is priced per technology, which means you can just get an account for Apache Cassandra monitoring and management or join it with another management service, such as for OpenSearch.
If you don’t already have your Cassandra cluster set up, the Instaclustr team can do that for you. They can also offer hosting for your clusters and you can get them to migrate your editing nodes which could be to their platform or to somewhere else.
The Instaclustr service doesn’t block you from accessing your Cassandra console yourself and you also get an Instaclustr dashboard where you can see the activities of the remote team in their work for your Cassandra implementations.
Who is it recommended for?
The key attribute of the Instaclustr system is that it provides the technicians to manage your open-source systems remotely. Those systems could be hosted already on your own servers or on a cloud platform, such as AWS or Azure. The team of technicians can also install clusters or host your databases.
Pros:
- Manages Multiple Technologies: Apache Cassandra, Apache Spark, Apache Kafka, Apache ZooKeeper, OpenSearch, PostgreSQL, Redis, and Cadence
- Clients Can See Performance Views: Can track and report on host resource consumption
- Uptime Guarantee: Provides a service level agreement
Cons:
- Would Like to See More Integrations: Support for other cloud services could be better
Instaclustr doesn’t just manage Apache Cassandra instances. The team can also look after other open-source systems, including Kafka, PostgreSQL, and Redis. Set up an account for free to investigate the Instaclustr service.
11. Instana
Instana is an application performance monitoring tool with a range of support for Cassandra. Once Instana is deployed it will automatically detect Cassandra. The autodiscovery features help you to get set up quickly without having to manage lots of manual configurations. Visibility-wise, the software shows right down to node-level metrics like Requests, Client Read/Write Latencies and Pending Requests. There is also cluster-level metrics which show you keyspace details, replication factors, and disk sizes.
Key Features:
- An IBM Product: Hosted on the cloud
- Automatically Discovers All Assets: Includes Cassandra database detection
- Cluster Monitoring: With instance details
Why do we recommend it?
Instana is a service from IBM and it provides an observablity platform for a range of technologies. IBM describes it as an APM plus. This system includes a customer experience analytical tool that is aimed at websites but also examines the backend services that contribute to a successful or failed transaction and that can include an Apache Cassandra cluster.
You can also monitor the health of Cassandra via the Dynamic Graph. The Dynamic Graph displays infrastructure events alongside a timeline so you can see how performance is changing over time. Having this information in front of you gives you a clear perspective of the performance trends impacting the service.
Who is it recommended for?
This tool can be used by a range of teams in your company, including the development team that is building an application, the operations team that manages it, or a marketing team that wants to analyze its performance. The system is good at discovering and mapping all of the contributing components behind a user-facing system.
Pros:
- Infrastructure Monitoring: Tracks all assets that operate between the user interface and the network
- Unique Dynamic Graphing: Relates infrastructure events with application outages
- Visualizes Assets and Clusters: Generates a 3D diagram
Cons:
- Short Free Trial: Only lasts 14 days
There are two versions of Instana available to purchase: Infrastructure Monitoring and Application Performance Management. Infrastructure Monitoring costs $20 (£16) per host per month with unlimited users and over 100 sensors. The Application Performance Management package costs $75 (£60) per host, per month and includes infrastructure monitoring, end-user monitoring, and analytics. You can download the free trial.
What Tool Should I Use to Monitor Apache Cassandra?
If you’re currently using Apache Cassandra to manage your databases then a monitoring solution is essential. A good infrastructure monitoring tool will help to make sure that your database performs. ManageEngine Applications Manager is well known for providing deep visibility into the physical and virtual infrastructure.
In terms of configuration and depth, Dynatrace is one of the best on this list (particularly because of its ability to detect Cassandra automatically!). However, if you want more of the dashboard-based approach to monitoring, SolarWinds Server & Application Monitor and Datadog are the way to go.
Apache Cassandra Monitoring FAQs
How do I monitor Cassandra database?
The easiest way to monitor a Cassandra database is to get a monitoring tool that has compatibility with the system. Look at ManageEngine Applications Manager, SolarWinds SAM, and Datadog, for examples.
How do I monitor Cassandra performance?
Monitoring the performance of Cassandra requires a live report on response times from the system plus an awareness of the resources that the database instances that you are running require. Watching capacity issues means that you can head off performance impairment.
Which of the tools is used to view the statistics of a table in Cassandra
Use nodetool cfstats to see the statistics for each table and keyspace.
