
Monitoring CPU temperature is crucial for ensuring optimal system performance, particularly in high-demand or resource-intensive environments. Professionals such as network administrators, system engineers, IT managers, and data center operators rely on these tools to prevent overheating, which can lead to hardware failure, reduced system performance, and costly downtime.
For roles that are responsible for maintaining server infrastructure, workstations, and high-performance computing systems, CPU temperature monitoring is vital to ensure systems remain stable and perform efficiently under load.
Common pain points these professionals face include unexpected system crashes, decreased performance due to thermal throttling, and accelerated hardware wear caused by prolonged heat exposure. In environments with heavy workloads, such as data centers or gaming systems, the risk of overheating is heightened. Without proactive monitoring, these issues may go unnoticed until significant damage occurs.
CPU temperature monitoring tools address these challenges by providing real-time insights into system temperatures, alerting users when critical thresholds are approached, and allowing them to take corrective action before the issue escalates. Whether through fan adjustments, system upgrades, or cooling solutions, these tools empower professionals to keep their infrastructure running smoothly and efficiently.
CPU temperature monitoring software can save your organization from the following pain points
- When computers overheat, it leads to random shutdowns and hardware damage.
- There will be data regarding CPU temperatures, especially during high workloads.
- Proactive monitoring and predictive maintenance are tough.
- There is no centralized monitoring of different systems and servers.
- No alerts when the temperature increases safe thresholds.
In this guide, we explore the best CPU temperature monitoring software to help mitigate these risks and enhance system longevity. We will present a list of monitors that are suitable for business use and those utilities that are better suited for home use.
All PCs and servers on your network emit heat but there is a limit to the amount of heat a computer can withstand before damage is done to hardware.
CPU temperature monitors enable you to monitor CPU temperature from one location. Monitoring the temperature allows you to identify when hardware devices are overheating and gives you a chance to fix the problem – which is vitally important for network troubleshooting.
When looking for a business system, one of the core requirements is that the software can be managed centrally to monitor many remote devices.
Here is our list of the best CPU temperature monitoring software for businesses:
- ManageEngine OpManager EDITOR’S CHOICE This hardware monitoring system discovers all the network devices and endpoints on your site and performs live status monitoring for each, covering factors such as CPU temperature, fan speed, clock speed, and power supply. Get a 30-day free trial.
- Site24x7 (FREE TRIAL) A cloud-based package of system monitoring and management tools that includes hardware monitoring providing details such as CPU temperature. Get a 30-day free trial.
- Paessler CPU Monitoring with PRTG (FREE TRIAL) This all-in-one infrastructure monitor includes several sensors that accurately measure server temperature, either through SNMP or through WMI. Download a 30-day free trial.
- SolarWinds CPU Load Monitor Part of the Engineer’s Toolset, this monitoring tool spots when a server is being overused. Excessive use can lead to high CPU temperatures and alerts in the monitor trigger alarms when activity gets too intense.
- Atera A cloud-based remote monitoring and management platform that includes device and server monitoring for a range of metrics, such as CPU metrics.
- HWiNFO Free hardware and temperature monitoring tool. The tool comes with real-time monitoring capabilities and a customizable alert system.
If you need to know more, explore our vendor highlight section for businesses just below, or skip to our detailed vendor reviews.
Best CPU temperature monitoring software for businesses highlights
Top Feature
Scalable, real-time hardware and network monitoring with proactive alerting and system-wide visibility
Price
Free edition; Standard: $245/year; Professional: $345/year; Enterprise: $11,545; MSP: from $795
Target Market
Businesses of all sizes and managed service providers
Free Trial Length
30-day free trialAdditional Benefits:
Features:
Top Feature
Cloud-based monitoring platform with real-time CPU tracking and customizable alerting
Price
Starts at $9 per month
Target Market
Businesses that prefer cloud-based tools for monitoring
Free Trial Length
30-day free trial
Read more ▼
Top Feature
Flexible, all-in-one monitoring platform with customizable sensors and SNMP/WMI integration
Price
Free for up to 100 sensors; paid plans start at $2,149/year for 500 sensors
Target Market
IT professionals and businesses managing complex infrastructure
Free Trial Length
30-day free trial
Read more ▼
Top Feature
Real-time CPU load monitoring with auto-discovery and multi-device support
Price
Starts at $1,997
Target Market
System administrators managing large-scale networks
Free Trial Length
14-day free trial
Read more ▼
Top Feature
All-in-one remote monitoring and management platform for MSPs and IT departments
Price
Per technician: IT Dept – $149 (Professional), $189 (Expert), $219 (Master), Custom (Enterprise); MSP – $129 (Pro), $179 (Growth), $209 (Power), Custom (Superpower)
Target Market
Managed service providers, IT professionals, and SMBs
Free Trial Length
30-day free trial
Read more ▼
Top Feature
Free, real-time hardware monitoring for Windows systems with detailed diagnostics
Price
Free for home use; Pro licenses start at $29/year or $129 for a lifetime license
Target Market
Small businesses and home users
Free Trial Length
Free for home use; 14-day free trial available for Pro version in commercial environments
Read more ▼
Home users are particularly concerned with keeping a desktop computer operating smoothly. Often, the motivation for installing one of these tools is an unexpected failure of the device or an inexplicable drop in performance. Some of these home-use systems offer opportunities to create custom displays and will be of interest to those who need powerful computers for graphic design or gaming.
Here is our list of the best CPU temperature monitoring software for home use:
- HWMonitor A hardware monitoring tool with temperature and fan speed monitoring. It is compatible with sensor chips including the ITE IT87 series and Winbond ICs.
- NZXT CAM This is a system monitoring tool that is provided for free by a build-it-yourself gaming PC supplier. Runs on Windows.
- Open Hardware Monitor An open-source hardware monitoring platform. It monitors temperature sensors, fan speeds, voltages, load, and clock speeds.
- Core Temp Temperature mentor that takes system information from the Digital Thermal Sensor (DTS) of computer processors. It has a Core Temp Monitor app for Windows and Android phones.
- SpeedFan A piece of software that monitors the voltage, fan speed, and temperature of computers. It also allows the user to control fan speeds and reduce noise.
- AIDA64 Extreme Hardware monitor with support for over 250 different types of sensors that can monitor temperature, voltage, fan speed, and power. It is available for all 32-bit and 64-bit versions of Windows.
- Rainmeter Top CPU temperature monitor for Windows devices that monitors core temperatures, CPU, disk usage, and RAM. It includes customizable skins that you can use to build a unique monitoring environment.
If you need to know more, explore our vendor highlight section for home use just below, or skip to our detailed vendor reviews.
Best CPU temperature monitoring software for home use highlights
Top Feature
Tracks temperature, voltage, and fan data in real time for Windows PCs
Price
Free
Target Market
Home users and small to medium-sized businesses
Free Trial Length
Free
Additional Benefits:
- Free for personal use; Pro version adds remote access for SMBs
- Monitors CPU, GPU, fan speed, and hard drive temperature in real time
- Consumes minimal system resources during operation
- List view in Pro edition helps manage multiple monitored systems
Features:
- Displays minimum, maximum, and current values for monitored hardware
- Cannot be accessed remotely in free version
- Monitors critical components like CPU, GPU, HDD, and power rails
- Supports multiple-PC list view in Pro version
Top Feature
Sleek, real-time monitoring interface for CPU, GPU, and system performance
Price
Free
Target Market
Gamers, PC enthusiasts, and small businesses
Free Trial Length
Free software
Read more ▼
Top Feature
Real-time monitoring of temperature, fan speed, load, voltage, and clock speed
Price
Free
Target Market
PC monitoring
Free Trial Length
Free software
Read more ▼
Top Feature
Accurate core-level CPU temperature monitoring in real time
Price
Free for personal use; commercial licenses available by request
Target Market
Home users and individuals monitoring older PCs
Free Trial Length
Free for Personal Use
Read more ▼
Top Feature
Provides real-time fan speed monitoring and control to optimize cooling
Price
Free
Target Market
PC enthusiasts, system builders, and advanced users who want control over system cooling
Free Trial Length
Free tool
Read more ▼
Top Feature
Provides real-time system diagnostics and benchmarking capabilities
Price
$59.95 per year for three PCs
Target Market
Used computer resellers
Free Trial Length
30-day free trial
Read more ▼
Top Feature
Delivers customizable desktop skins with system performance monitoring
Price
Free
Target Market
Tech enthusiasts, gamers, and users who enjoy customizing their desktop
Free Trial Length
Free tool
Read more ▼
Key points to consider before selecting CPU temperature monitors for business
1. Compatibility with Hardware and Operating Systems
Ensure that the CPU temperature monitoring software is compatible with the hardware and operating systems used across your business. Some tools support specific CPUs (Intel, AMD, etc.) or operating systems (Windows, Linux, macOS), so it’s essential to check compatibility before making a decision.
2. Real-time Monitoring and Alerts
Look for tools that provide real-time temperature monitoring and customizable alerts. This feature ensures that your IT team is immediately notified when temperatures exceed safe thresholds, allowing them to take quick action before hardware is damaged.
3. Data Logging and Reporting
Choose software that offers comprehensive data logging and reporting capabilities. Access to historical data can help identify trends, predict potential issues, and make informed decisions about system upgrades or cooling solutions.
4. User Interface and Ease of Use
The software should have an intuitive interface, allowing IT teams to easily configure, monitor, and analyze CPU temperatures without requiring steep learning curves. A user-friendly dashboard with customizable views can improve efficiency and reduce time spent troubleshooting.
5. Scalability and Enterprise Support
Consider whether the software can scale with your business growth. As your infrastructure expands, you’ll want a tool that can handle multiple servers, workstations, or even data centers. Enterprise-level support and integration options are important for businesses with large networks or complex IT environments.
6. Cost and Licensing
Evaluate the pricing structure and licensing model. Some tools are free, while others require paid subscriptions or licenses. Be sure the cost aligns with your business needs and budget, and consider any additional costs for features like advanced reporting, API access, or multi-user support.
7. Integration with Other Monitoring Tools
If your business already uses other network or hardware monitoring tools, ensure the CPU temperature monitor can integrate seamlessly with these systems. This ensures all your monitoring efforts are centralized and can be easily managed from a single interface.
8. Security and Privacy Considerations
Ensure the software follows best practices for security and data privacy. Given the sensitive nature of system health data, it’s important to choose a tool that offers secure access controls and protects data from unauthorized access.
9. Support and Documentation
Look for vendors that provide solid customer support, detailed documentation, and a knowledge base. In case of any technical issues or setup difficulties, accessible support and comprehensive guides can save your team valuable time and effort.
10. Vendor Reputation and Reviews
Research the software vendor’s reputation and review feedback from other businesses in similar industries. Positive reviews, especially from IT professionals, can give you confidence in the software’s effectiveness, reliability, and customer support.
By considering these factors, businesses can select a CPU temperature monitor that meets their specific needs, ensures system stability, and helps prevent costly hardware failures.
How to calculate ROI for CPU temperature monitoring software
To calculate the return on investment (ROI) for CPU temperature monitoring software, you need to assess both the costs associated with the software and the potential savings or value it brings to your business. Here’s a step-by-step guide on how to calculate ROI:
Determine the Total Costs
This includes both the initial and ongoing costs of the software. Key cost components might include:
- Software Purchase or Subscription Fees: The cost of buying or subscribing to the CPU temperature monitoring tool.
- Implementation and Setup Costs: Any costs associated with deploying and configuring the software within your organization.
- Training Costs: If employees need training to effectively use the software, factor in those expenses.
- Ongoing Maintenance and Support: Consider any costs for updates, upgrades, or customer support services.
Calculate the Benefits/Savings
Next, identify the tangible benefits that come from using the CPU temperature monitoring software. These could include:
- Reduced Hardware Failures: By proactively identifying overheating issues, the software helps prevent CPU failures or other hardware damage, potentially saving significant repair or replacement costs. Estimate the typical cost of replacing a damaged server or workstation and how much the software helps avoid these incidents.
- Decreased Downtime: Overheating or hardware failures can lead to unplanned system downtime. By preventing such issues, the software helps reduce downtime, which can be costly in terms of lost productivity. Calculate the potential savings by multiplying the average cost of downtime per hour by the hours saved due to fewer system failures.
- Improved Efficiency: The software can help optimize cooling systems, resulting in lower energy costs and more efficient use of existing hardware. Estimate energy cost savings and productivity gains by reducing the need for manual intervention or emergency fixes.
- Longer Hardware Lifespan: By maintaining optimal CPU temperatures, the software can extend the life of your hardware, deferring capital expenditure on new equipment. Estimate the cost savings by increasing the useful life of your hardware assets.
Calculate the ROI Formula
Once you have the total costs and the estimated savings or benefits, you can calculate ROI using the following formula:

Where:
Total Savings refers to the total financial benefits derived from using the monitoring software.
Total Costs includes all costs associated with purchasing, implementing, and maintaining the software.
Example Calculation
Let’s assume the following for your business:
- Total Costs: $2,000 (software purchase, setup, and maintenance costs)
- Total Savings:
- Reduced hardware failures: $5,000
- Decreased downtime: $3,000
- Improved efficiency (energy savings): $500
- Longer hardware lifespan: $1,500
Total Savings = $5,000 + $3,000 + $500 + $1,500 = $10,000
Now, apply the formula:

In this example, the ROI for using CPU temperature monitoring software is 400%, meaning for every dollar spent on the software, you gain $4 in savings.
Assess Intangible Benefits
While calculating the financial ROI is important, don’t forget to consider intangible benefits such as improved employee morale due to fewer IT-related issues, better customer satisfaction, and enhanced reputation for reliability. These factors may not always be quantifiable but contribute to the overall value.
By calculating ROI in this way, businesses can assess whether investing in CPU temperature monitoring software delivers a worthwhile return, both in financial terms and overall operational efficiency.
How do CPU temperature monitors work?
CPU temperature monitors track the temperature of the Central Processing Unit (CPU) in a computer system. Monitoring CPU temperature is essential because high temperatures can lead to system instability, performance throttling, and even permanent hardware damage if the CPU overheats. Here’s how CPU temperature monitors work:
Thermal Sensors in the CPU
Modern CPUs have built-in thermal sensors that measure the temperature of the processor. These sensors are typically located at various points inside the CPU die to ensure an accurate reading of the processor’s core temperature.
Most modern processors (Intel and AMD) feature Digital Thermal Sensors that provide temperature readings directly in Celsius. The DTS is usually integrated into the CPU and gives a precise temperature reading. Older processors may use thermal diodes, which convert temperature into electrical signals, which are then processed to give a temperature reading. These sensors feed data about the temperature to the system’s BIOS/UEFI, the Operating System, or monitoring software, allowing the CPU temperature to be tracked in real-time.
BIOS/UEFI Monitoring
When you boot up your system, the BIOS or UEFI firmware can display temperature information for the CPU. The BIOS/UEFI directly reads from the thermal sensors in the processor. In some cases, this information may be accessed during boot-up through a Hardware Monitoring section. The BIOS/UEFI can often display temperatures for each core and the overall CPU, as well as fan speeds, voltages, and power consumption metrics.
Software-Based Monitoring Tools
Once the system is running, CPU temperature monitoring software can read the temperature data provided by the CPU’s sensors, either through the BIOS or directly from the operating system. This software displays the temperature in an easy-to-read format and can also log temperature data for analysis over time.
Factors to Note in CPU Temperature Monitoring
Readings for temperature are not standardized across the IT industry and different factors can influence the readings that you get.
Temperature Readings and Calibration
The readings from the CPU’s thermal sensors are usually calibrated by the manufacturer for accuracy. However, the temperature can be affected by several factors:
- Ambient Temperature: The temperature of the surrounding environment (room temperature) can influence CPU temperature.
- Cooling Solution: The effectiveness of the CPU cooler (air or liquid) directly impacts the CPU temperature. Insufficient cooling can cause temperatures to rise quickly.
- CPU Load: When the CPU is under heavy load (e.g., during gaming or video rendering), it generates more heat, which raises the temperature.
Thermal Throttling
When a CPU gets too hot, modern processors have built-in protection mechanisms to prevent damage. One of the most common mechanisms is thermal throttling, which reduces the CPU’s clock speed to lower its temperature. Thermal throttling ensures that the CPU doesn’t exceed its maximum safe temperature (usually between 80°C to 100°C, depending on the processor). If temperatures continue to rise despite throttling, the CPU may shut down to prevent permanent damage.
Fan Control and Cooling Adjustment
CPU temperature monitors often work in conjunction with system fan controllers to optimize cooling. Software can adjust fan speeds based on temperature readings to provide additional cooling when necessary. Some systems use adaptive cooling technology, which automatically adjusts fan speeds based on temperature readings, ensuring the system stays cool under heavy load but doesn’t waste energy on excessive cooling when the system is idle.
The best CPU temperature monitoring software for businesses
Features Comparison Table
| Product/Features | ManageEngine OpManager | Site24x7 | Paessler CPU Monitoring with PRTG | HWMonitor | NZXT CAM | Open Hardware Monitor | Core Temp | HWiNFO | SolarWinds CPU Load Monitor | Atera | SpeedFan | AIDA64 Extreme | Rainmeter |
|---|---|---|---|---|---|---|---|---|---|---|---|---|---|
Accuracy | Yes | Yes | Yes | Yes | Yes | Yes | Yes | Yes | Yes | Yes | Yes | Yes | Depends on plugin |
| Real-Time Monitoring | Yes | Yes | Yes | Yes | Yes | Yes | Yes | Yes | Yes | Yes | Yes | Yes | Yes |
| Logging Capability | Yes | Yes | Yes | Yes | Yes | Yes | Yes | Yes | Yes | No | Yes | Yes | Depends on plugin |
| Alerts and Notifications | Yes | Yes | Yes | No | Yes | No | Yes | No | Yes | Yes | No | Yes | Depends on plugin |
| Multi-Core Support | Yes | Yes | Yes | Yes | Yes | Yes | Yes | Yes | Yes | No | Yes | Yes | Depends on plugin |
| System Tray Display | No | No | No | Yes | Yes | Yes | Yes | Yes | Yes | No | Yes | Yes | Yes |
| Compatibility | Windows | Cloud | Windows | Windows | Windows | Windows, Linux | Windows | Windows | Windows | Cloud-based | Windows | Windows | Windows |
| Graphical Display | Yes | No | Yes | No | Yes | No | No | Yes | No | No | No | Yes | Yes |
| Other Hardware Monitoring | Yes | Yes | Yes | Yes | Yes | Yes | No | Yes | Yes | Yes | Yes | Yes | Depends on plugin |
| Ease of Use | High | High | High | Medium | High | Medium | High | Medium | High | High | Low | High | Medium |
| Free Trial | 30-day free trial | 30-day free trial | 30-day free trial | 30-day Free Trial | No | No | Free | Free | Yes | 30-day Free Trial | Free | 30-day Free Trial | Free |
1. ManageEngine OpManager (FREE TRIAL)
Best for: Managing network devices and endpoints.
Price: Free edition = $0; Standard edition = $245 per year; Professional edition = $345 per year; Enterprise edition; $11,545; OpManager MSP = from $795.

ManageEngine OpManager is a system hardware documenter and performance monitor. It discovers, documents, and maps all network devices and then polls all equipment for status reports. Those status reports include factors such as CPU temperature, fan speed, power supply status, and clock speed. The system uses the Simple Network Management Protocol to reap regular reports from all devices. Device agents are able to send out an urgent warning if a fault is discovered. These are interpreted into alerts, which appear in the system console and can also be forwarded as notifications by email or SMS.
ManageEngine OpManager’s key features
ManageEngine OpManager is much more than a hardware temperature monitor. Its main features are:
- Customizable Alerts for Overheating: Allows users to set thresholds and receive instant alerts when CPU temperature exceeds safe limits.
- Comprehensive Hardware Monitoring: Monitors various hardware components, such as memory, disk usage, and network performance.
- Network Performance Analytics: Offers in-depth network performance analysis, helping businesses identify bottlenecks and optimize connectivity.
- Scalability and Multi-Device Support: Scalable to monitor multiple devices and servers, making it ideal for businesses of all sizes.
- Custom Dashboards and Reports: Provides customizable dashboards and detailed reporting for a centralized view of system health.
Unique buying proposition
ManageEngine OpManager’s unique buying proposition as a CPU temperature monitor lies in its ability to provide real-time monitoring, proactive alerts, and performance analytics. It integrates seamlessly with broader IT infrastructure, offering scalability and customizable dashboards, making it ideal for businesses that need comprehensive, centralized monitoring for optimal system performance.
Feature-in-focus: ManageEngine OpManager’s wider hardware monitoring capabilities
ManageEngine OpManager excels beyond CPU temperature monitoring, offering comprehensive hardware monitoring capabilities. It tracks various hardware metrics, including memory, disk usage, and network performance, ensuring overall system health. With customizable alerts, detailed reporting, and real-time monitoring, it provides businesses with a comprehensive solution for proactive infrastructure management and optimization.
Comparitech SupportScore
ManageEngine is a division of Zoho Corporation, and in turn, it is the parent company of Site24x7. ManageEngine and Site24x7 are two of the most successful system monitoring providers in the world. The size, financial stability, and longevity of the company rate very well with our SupportScore formula. The company gets a SupportScore of 9.3 out of 10.
That high score also takes into account the excellent online guides and in-app help provided by ManageEngine. The Customer Support team is well staffed with knowledgeable technicians and the job satisfaction reported by employees is high.
Why do we recommend it?
We recommend ManageEngine OpManager because of its comprehensive and scalable monitoring capabilities, which go beyond CPU temperature tracking. It provides real-time insights into hardware health, network performance, and system optimization, offering customizable alerts and reports. Its user-friendly interface, proactive monitoring, and integration with broader IT infrastructure make it an ideal solution for businesses seeking efficient, centralized management.

Who is it recommended for?
The OpManager system is available in five editions. These include a Free edition, however, that is limited to monitoring just three plans. The top plan, called the Enterprise edition will monitor multiple sites in a WAN through a single console. There is also the MSP plan for managed service providers. In short, there is a version of OpManager for every size and type of business.
Pros:
- Hardware discovery: Repeats continuously to discover every device and endpoint on the network
- System documentation: Creates a hardware inventory and network topology map
- Scans for status reports: Periodically requests status reports from device agents
- Tracks environment conditions: Checks on the temperature and fans speed of each network device and endpoint
- Deployment options: The software package runs on Windows Server or Linux or get it as a service in AWS or Azure
Cons:
- No server room environment scanning: Doesn’t check the temperature outside of the hardware
The software for OpManager will install on Windows Server or Linux. It is also available as a service on AWS and Azure. You can access a 30-day free trial to assess the package.
EDITOR'S CHOICE
ManageEngine OpManager is our top pick for CPU temperature monitoring software because this system collects CPU temperature data as part of its regular sweep on devices. It also looks at fan speed, clock speed, and power supply status. The package first scans a network and identifies every piece of hardware connected to it. The information gleaned from this network sweep gets written into a hardware inventory. The service also draws up a network topology map. The system uses the Simple Network Management Protocol to gather status reports from all devices. The CPU temperature data in that report is just one status that is included in the scan feedback. You can set up alerts for excessive SPU temperature or other system problems. You can get three forwarded to technicians by email or SMS.
Download: Get a 30-day free trial
OS: Windows Server, Linux, AWS, and Azure
2. Site24x7 (FREE TRIAL)
Best for: Businesses that prefer cloud-based tools for monitoring.
Price: Plans start at $9 per month.

The CPU monitor in Site24x7 offers comprehensive and real-time monitoring of CPU performance across various types of equipment, including servers, workstations, and network devices. It tracks key metrics such as CPU load, usage, and temperature, helping administrators maintain the health and performance of their infrastructure.
Site24x7’s key features
Site24x7 is a cloud-based platform with many different system monitoring services. Its important features are:
- Real-Time Monitoring: Continuously tracks CPU performance, including CPU load, utilization, and temperature.
- Customizable Alerts: Allows users to set thresholds for CPU metrics and receive real-time alerts.
- Historical Data Analysis: Provides historical data on CPU usage and performance trends for troubleshooting and capacity planning.
- Multi-Platform Support: Monitors CPU metrics across various environments, including physical servers, virtual machines, and cloud infrastructures.
Unique buying proposition
Site24x7’s unique buying proposition as a CPU temperature monitor lies in its ability to offer real-time monitoring of CPU health alongside comprehensive infrastructure management. It provides proactive alerts, customizable thresholds, and detailed reporting, enabling businesses to monitor not only CPU temperature but also overall system performance, ensuring optimized IT operations.
Feature-in-focus: Site24x7’s network device monitoring service
Site24x7’s network device monitoring service offers comprehensive insights into the health of network devices, including real-time CPU temperature monitoring. It tracks performance metrics, device status, and environmental factors like temperature, providing proactive alerts for potential issues. This ensures optimal performance and reduces downtime by addressing hardware problems before they escalate.
Comparitech SupportScore
Site24x7 is a division of ManageEngine and so it shares its SupportScore with its parent company. We already covered the services of ManageEngine in the previous section.
Why do we recommend it?
By providing detailed insights into CPU resource utilization, Site24x7 enables proactive monitoring, ensuring that systems run efficiently without overloading. The platform’s easy-to-read dashboards provide a clear overview of CPU performance, allowing users to quickly identify any performance issues that might arise, such as high CPU temperature, which can lead to physical damage and system crashes.
An important feature of Site24x7’s CPU monitor is its ability to set customizable thresholds for key CPU metrics. Administrators can configure alerts to be triggered when CPU usage or temperature exceeds predefined limits. These alerts provide early warnings of potential issues before they disrupt business operations. This alerting feature prevents costly downtime or hardware damage caused by overheating.
Site24x7 also tracks historical performance data, enabling users to analyze trends over time and make informed decisions about resource optimization and capacity planning. The CPU monitor also integrates with other monitoring features in the platform, creating a holistic monitoring solution for IT infrastructure. In addition to CPU metrics, Site24x7 tracks other vital system health parameters, such as memory usage, disk health, and network performance.
Pros:
- Comprehensive Resource Monitoring: Also tracks system resources such as memory, disk health, and network performance.
- Flexible Dashboards: Customizable, easy-to-use dashboards display real-time and historical CPU performance data.
- Capacity Planning: Helps in planning for resource scaling by analyzing CPU trends and performance over time, making it easier to predict future infrastructure needs.
- Cross-Platform Integration: Supports integration with a variety of server models, network device types, and third-party applications.
Cons:
- Not Possible to Download: This is a cloud-based SaaS package.
You can assess the full Site24x7 platform by accessing a 30-day free trial.
3. Paessler CPU Monitoring with PRTG (FREE TRIAL)
Tested on: Windows, Windows Server
Best for: A flexible system monitoring package.
Price: Free for up to 100 sensors. The paid packages start at $2,149 per year for 500 sensors.

Paessler PRTG is an all-in-one infrastructure monitor that covers networks, servers, and applications. When looking for a temperature monitor, there are several different systems that you could choose. The PRTG service is a bundle of sensors and every customer gets shipped the full set. When starting up the software, the systems device manager has to decide which sensors to turn on and so is able to tailor the system to adjust the necessary monitors.
Paessler PRTG’s key features
PRTG tracks network devices with the Simple Network Management Protocol. Its key features are:
- SNMP Manager: Manages devices using the Simple Network Management Protocol.
- Reports on Device Conditions: Generates reports on the status and conditions of monitored devices.
- Uses WMI: Utilizes Windows Management Instrumentation for monitoring Windows-based devices.
- Live Device Load Tracking: Tracks the load on devices in real-time.
Unique buying proposition
Paessler PRTG’s unique buying proposition as a network device hardware monitor lies in its all-in-one monitoring capabilities. It offers real-time tracking of CPU temperature, memory, disk usage, and network performance across devices. With customizable alerts, detailed reports, and scalability, PRTG ensures businesses maintain optimal hardware performance and prevent potential issues.
Feature-in-focus: Paessler PRTG’s flexible plans
Paessler PRTG offers flexible pricing plans based on sensor allowances, allowing buyers to choose from a wide range of sensors tailored to their needs. After purchasing a base sensor package, users can select additional sensors for monitoring specific devices, networks, or systems, providing scalability and customization to fit various business requirements.
Comparitech SupportScore
Paessler is one of the leading system monitoring package providers but this world leader has surprisingly few employees. The company has a staff of 357, while rival SolarWinds employs 2,000 and ManageEngine has 4,000 employees. The SupportScore formula tends to favor larger companies, so SolarWinds and ManageEngine get ahead of Paessler on that category of points.
Paessler gets full marks for its Customer Support team and its online guides and self-help system. These factors get the company an overall SupportScore of 8.8 out of 10.
Why do we recommend it?
The Paessler PRTG CPU Monitoring tool will watch over the CPU utilization of all of the devices connected to your network, which includes endpoints, switches, and routers. A system of alerts means that you don’t even have to look at the console of the monitor in order to catch problems with CPU availability.
The PRTG package of sensors includes several monitors that can pick up temperature information either from servers or network devices. Temperature performance is one of the factors that can be reported through SNMP and PRTG has a sensor for that. However, not every hardware provider implements procedures to report on temperature by that method.

PRTG includes monitors that pick up CPU performance data on Windows servers through WMI. A sensor for Linux servers also monitors CPU performance managed by that operating system. PRTG has a total of nine different sensors that are capable of looking for temperature information gathered on servers and network devices. If none of your equipment has an actual thermometer inside, there is no way for any system monitor to collect temperature information. However, in those cases, monitoring CPU load on all devices acts as a proxy statistic for temperature statuses.
Who is it recommended for?
Paessler PRTG is recommended for IT professionals, network administrators, and businesses of all sizes that require comprehensive network monitoring. It’s ideal for organizations managing complex infrastructures, including data centers, cloud services, and remote offices. Its flexibility, scalability, and customizable sensor options make it suitable for businesses looking to optimize network performance and prevent downtime.
As with the SolarWinds tool, the PRTG CPU Monitoring service is a bidder help to the managers of large networks. However, the free tier of PRTG makes this assistance accessible to small businesses as well.
Pros:
- Scalability: Enables easy scalability of monitoring efforts within the PRTG ecosystem.
- Flexibility: Configurable to measure only temperature initially, with the flexibility to expand monitoring scope effortlessly.
- Competitive Pricing: Pricing based on the number of sensors offers scalability and flexibility for networks of any size.
- Pre-Configured and Custom Sensors: Offers a variety of pre-configured and custom sensors ready for immediate use. Users can create custom sensors tailored to their specific requirements.
Cons:
- Learning Curve: Rich feature set may entail a learning curve for users unfamiliar with the platform.
Paessler makes PRTG available on a 30-day free trial. This is the full version of the monitoring system and you can activate all of the sensors you want during the trial period.
Read More: Best Hardware Monitoring Tools
4. SolarWinds CPU Load Monitor
Tested on: Windows, Windows Server
Best for: System administrators.
Price: From $1,997
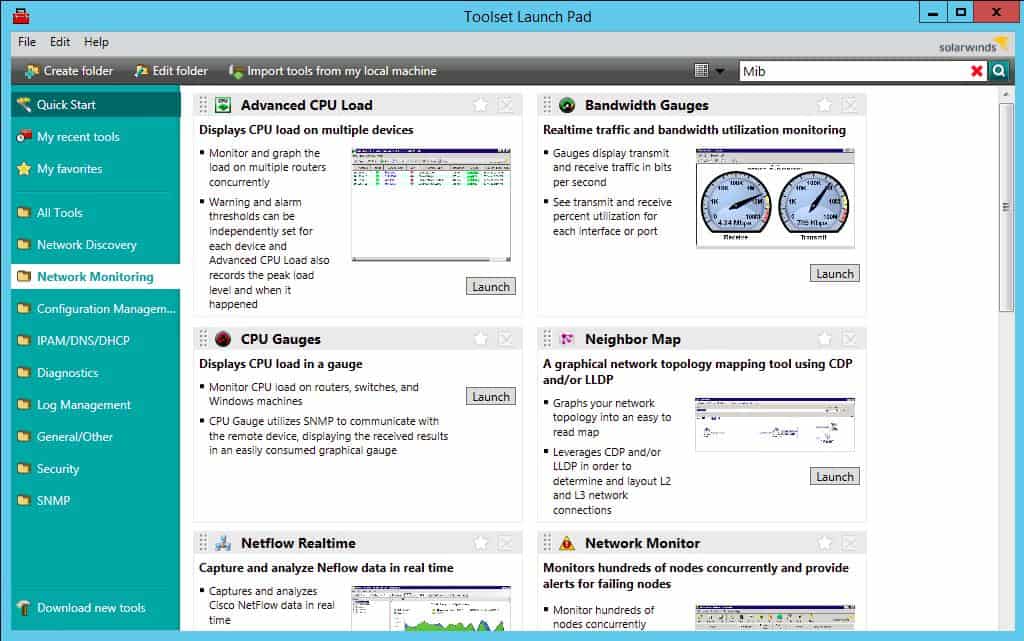
The SolarWinds CPU Load Monitor is part of the Engineer’s Toolset, which is a bundle of more than 60 monitoring and entire system management utilities. The CPU Load Monitor can track the performance of network devices and watch to make sure their hardware doesn’t get overloaded. On testing the CPU Load Monitor we found the following key features.
SolarWinds Engineer’s Toolset’s key features
The Engineer’s Toolset includes more than 60 tools. Its best features are:
- Auto Discovery: Comes with an auto discovery feature that automatically detects new devices on the network.
- Spots Capacity Issues: Identifies and alerts about CPU load capacity issues.
- Live Reports: Provides real-time reports on CPU load status.
Unique buying proposition
SolarWinds Engineer’s Toolset offers a unique buying proposition with its comprehensive set of over 60 network management and troubleshooting tools. It provides real-time monitoring, diagnostics, and network performance analysis, enabling IT professionals to quickly identify and resolve issues. Its user-friendly interface and versatility make it ideal for efficient network management.
Feature-in-focus: SolarWinds Engineer’s Toolset’s network device monitor
SolarWinds Engineer’s Toolset’s network device monitor offers real-time insights into the health and performance of network devices. It tracks key metrics such as CPU usage, memory, and network traffic, helping IT professionals identify issues quickly. With easy-to-use diagnostic tools, it enhances troubleshooting and ensures efficient network management.
Comparitech SupportScore
SolarWinds is a large company with 2,000 employees and has been profitable for a number of years. These are factors that score highly in our SupportScore calculations. The core factors in the formula for SupportScore are the quality of the company’s Customer Support team and the effectiveness of its digital guides. SolarWinds gets full marks in both of these categories. However, company details contribute to the formula as well.
The overall SupportScore of SolarWinds is 8.9 out of 10.
Why do we recommend it?
SolarWinds CPU Load Monitor isn’t designed for just one device, but it can monitor the CPU load on all devices on a network. The tool includes an autodiscovery service that sets up the parameters of the monitoring tool for each device.

Network devices rarely include mechanisms to measure temperature. So, there just isn’t a temperature metric to pick up from switches or routers. However, heat is usually only generated by these devices when they get overworked and the electronic elements that will create heat when overloaded are the CPU and the interfaces. The CPU Load Monitor measures these components and tracks their activity live in the Engineer’s Toolset’s dashboard.
The CPU Load Monitor starts its service by searching the network for all connected devices and lists them in an inventory. Once that autodiscovery phase has been completed, each listed device will automatically be monitored and one of the tracked factors in the CPU load. The CPU load monitor also records interface statistics and memory utilization, so all of the elements inside a network device that could overheat are watched by the CPU Load Monitor.
The monitor automatically sets threshold levels on all of the performance statuses that it tracks. These can be adjusted manually. When a threshold is crossed, the CPU Load Monitor generates an alert. This alert is shown on the dashboard and is also sent out to key personnel as an email or SMS message. This facility means that technicians don’t have to sit watching the panel always for signs of overheating. The threshold levels should be set so that the warning gives staff enough time to take preventative measures before any physical damage or performance impairment occurs.
Who is it recommended for?
The CPU Load Monitor is most suitable for the administration of large networks. Although the managers of all sizes on networks need to watch over the CPU utilization of all routers and switches, that task becomes impossible to perform manually when you have many devices to watch.
During our testing, we identified the following pros and cons related to CPU Load Monitor.
Pros:
- Effective Alarms: Utilizes simple yet effective alarms for long-term proactive CPU temperature monitoring.
- Effective Troubleshooting: Part of a larger tool specifically designed for network admins and IT technicians, offering additional troubleshooting tools.
- Notification Channels: Alerts can be configured to email, SMS, or webhook, ensuring compatibility with various alerting platforms.
Cons:
- Trial Period Not Long Enough: Longer trial period desired to fully test all included features.
While this package gives you all of the tools that any network manager would need, you can expand your toolset further by investing in the SolarWinds 5 Essential IT Tools. This package gives you the Engineer’s Toolset along with Dameware Remote Support, which gives your support technicians all the tools they need to do their work. It also includes the Web Help Desk to enable users to open support requests. The other two tools in the bundle are the Serv-U FTP Server, which can create task automation workloads, and the Kiwi CatTools, which gives you network device configuration management. The whole package runs on Windows Server and you can get it on a 14-day free trial
5. Atera
Tested on: Cloud/SaaS
Best for: Remote monitoring and management of entire IT systems
Price: All prices are per technician – For IT Departments: Professional = per month $149; Expert = $189 per month; Master = $219 per month; Enterprise = Custom pricing. For MSPs: Pro = $129 per month; Growth = $179 per month; Power = $209 per month; Superpower = Custom pricing.

Atera is a cloud-based platform that includes all of the software that a managed service provider (MSP) needs to run its business. The remote monitoring and management (RMM) module of the system includes monitoring screens for networks, servers, endpoints, and applications.
Atera’s key features
Atera is suitable for use by IT departments and MSPs. Its best features are:
- Designed for MSPs: Atera is specifically tailored for Managed Service Providers (MSPs), catering to their needs and workflows.
- Multi Site Monitoring: It allows monitoring and management of devices across multiple sites or locations from a single interface.
- Device Capacity Utilization Tracking: Atera offers features that track and provide insights into various aspects of device performance, including disk I/O, memory usage, fan speeds, and disk capacity.
Unique buying proposition
Atera’s unique buying proposition lies in its all-in-one remote monitoring and management platform. It combines network monitoring, IT automation, and remote support in a single solution, tailored for managed service providers (MSPs) and IT teams. Atera’s scalable pricing, ease of use, and powerful features make it ideal for businesses seeking efficiency and growth.
Feature-in-focus: Atera’s remote monitoring and management functions
Atera’s remote monitoring and management functions provide real-time monitoring, automated alerts, and proactive issue resolution for IT infrastructure. It enables IT teams to remotely access devices, manage network performance, and perform maintenance tasks efficiently. With customizable reporting and alerts, Atera streamlines remote IT management for businesses and MSPs.
Comparitech SupportScore
Atera is a successful and continuously expanding business with almost 400 employees. This success, size, and stability rate well with our SupportScore formula. As does the extensive online help and the well-educated Customer Support team. These factors give Atera a SupportScore of 8.8 out of 10.
Why do we recommend it?
Atera is a system that has been designed for use by managed service providers – although it is also available for use by in-house operations teams. In this package, which is called a Remote Monitoring and Management (RMM) system, you get a collection of automated monitoring services that include CPU monitoring, so you get real value for money.

The home screen of the monitoring dashboard gives a system overview. Atera employs an alert-based system that notifies an administrator if there is anything wrong on the monitored system. So, it is easy to spot problems at a glance. From the summary screen, the operator can click through to see details of individual pieces of equipment.
The device, endpoint, or server monitoring screens include a range of statuses, including CPU performance data. These categories of feedback are all live and they include CPU temperature, utilization, and capacity. Other factors shown in the screen include fan performance, memory usage, disk activity, and I/O throughput rates.
Who is it recommended for?
Atera is recommended for managed service providers (MSPs), IT professionals, and small to medium-sized businesses that need a comprehensive remote monitoring and management (RMM) solution. Its scalability and powerful automation tools make it ideal for teams seeking to efficiently manage networks, resolve issues remotely, and streamline IT operations.
The Atera package is best for managed service providers. Each account is multi-tenanted and includes server space that is similarly segmented.
Pros:
- Lightweight Monitoring: Being cloud-based, Atera offers ease of access and management without requiring heavy infrastructure.
- MSP/Reseller Focused: It is tailored to the needs of MSPs and resellers, offering features that align with their service offerings.
- Visually Appealing Dashboards: Atera provides visually appealing dashboards and reporting tools, making it easy to understand and analyze data.
- Holistic Device Health Monitoring: In addition to capacity utilization tracking, Atera also covers various other aspects of device health, offering a comprehensive monitoring solution.
- Affordable Subscription Service: Atera operates on a subscription model, making it accessible and affordable for networks of any size.
Cons:
- Steep Learning Curve: Due to its depth and comprehensive feature set, Atera may require some time to fully explore and master all its features and options.
Atera is a subscription service with a rate per technician per month. The cloud-based dashboard is accessed through any standard browser, so you don’t need to host the Atera software on-premises. You can get a free trial to experience the platform for yourself.
6. HWiNFO
Tested on: Windows, Windows Server
Best for: Small businesses, although the customer list includes some very large organizations
Price: Free

HWiNFO is a real-time system and temperature monitoring solution for Windows. With HWiNFO you can monitor hardware elements like CPUs, GPUs, drives, mainboards, and more to discover performance issues. The user interface is easy to navigate and you can view in-depth performance data by clicking through the infrastructure hierarchy.
HWiNFO’s key features
HWiNFO installs on Windows. Its best features are:
- Free to Use: No cost associated with utilizing the software.
- Real-Time Monitoring: Runs continuously to provide real-time monitoring.
- Desktop Sidebar Interface: Offers a convenient sidebar interface for quick access to monitoring data.
Unique buying proposition
HWiNFO’s unique buying proposition lies in its comprehensive hardware monitoring and diagnostics capabilities. It provides real-time insights into various system components, including CPU temperature, voltage, and fan speeds. With detailed reporting, extensive sensor support, and a lightweight interface, HWiNFO is ideal for users seeking precise, in-depth system analysis and monitoring.
Feature-in-focus: HWiNFO’s hardware scanning
HWiNFO’s hardware scanning feature offers detailed, real-time monitoring of system components, including CPU, GPU, motherboard, and memory. It provides in-depth information on temperatures, voltages, fan speeds, and other metrics, helping users identify performance issues. The tool’s comprehensive scanning ensures accurate diagnostics for optimal system health and performance.
Comparitech SupportScore
HWiNFO is a sole trader and so the business doesn’t have any staff to run a Customer Support team. The business doesn’t have any of the indicators that would get it a high SupportScore mark – financial success, size, happy employees. The company hasn’t provided any online documentation for its products, so it misses out on that category of points, too.
The above factors resulted in a low SupportScore of 0.5 out of 10 for HWiNFO.
Why do we recommend it?
HWiNFO is free for home use and it can monitor a range of hardware factors on Windows PCs, such as temperature, CPU activity, and RAM. The tool can be networked and when implemented in combination with Lansweeper can provide automated monitoring for a fleet of endpoints.

Customizable alerts help to keep track of overheating and performance degradation. There are also add-ons you can use to augment the monitoring experience. For instance, the HWiNFOMonitor plugin adds a customizable sidebar which displays CPU performance with bars and graphs.
Who is it recommended for?
The basic, free HWiNFO is intended for home use. The paid versions are designed for small businesses. Medium-sized and large enterprises would be better looking for a combined system monitoring package for networks, servers, and applications.
Pros:
- Detailed Metrics: Provides comprehensive metrics including cache sizes, ratio, clock speeds per core, and timing information, offering deep insight into system performance.
- Beyond CPU-Related Metrics: Offers monitoring capabilities beyond just CPU-related metrics including GPU and disk utilization.
- Built-in Visualizations: Provides visual representations of data for easier interpretation and analysis.
Cons:
- Cluttered Interface: The interface may become cluttered, particularly on devices with many components such as servers or hosts, potentially making it difficult to track metrics effectively.
- Windows Only: Limited compatibility as the software is exclusive to the Windows operating system. It may also not be suitable for users with limited technical knowledge
HWiNFO is ideal for enterprises that require a free CPU monitoring solution. The tool is available HWiNFO32 for Windows 32-bit and HWiNFO64 for Windows 64-bit. You can download the program for free.
Read more: Step-By-Step CPU Benchmark Test
The best CPU temperature monitoring software for home use
1. HWMonitor
Tested on: Windows
Best for: PC monitoring
Price: Free

HWMonitor is a hardware monitoring tool for Windows that monitors computer temperatures, voltages, and fans. The software monitors the hard drive and video card GPU temperature. These metrics give you a strong indication of the overall health of a device.
When we tested HWMonitor we found the following key features.
HWMonitor’s key features
HWMonitor can only be read on the computer that hosts it. Its best features are:
- Temperature, Fan, and Voltage Monitors: Monitors key hardware metrics including temperature, fan speed, and voltage levels.
- Free Version: Offers a free version of the software.
- Low CPU Usage: Operates with minimal CPU resource consumption.
Unique buying proposition
The most attractive aspect of HWMonitor is that it is free. However, this free tool can’t be accessed remotely, so it wouldn’t be suitable for corporate use. The paid version of the package, called HWMonitor PRO can be accessed remotely and so is more suitable for businesses.
Feature-in-focus: HWMonitor’s live hardware status monitoring
HWMonitor’s live hardware status monitoring provides real-time tracking of critical system components, including CPU temperature, fan speeds, voltages, and power consumption. It offers detailed insights into hardware health, allowing users to quickly identify potential issues. Its intuitive interface and continuous monitoring ensure optimal performance and prevent overheating or failures.
Comparitech SupportScore
CPUID, the company behind HWMonitor, is a single-person business. Small businesses don’t fare well in our SupportScore formula because they aren’t seen as a good risk. They are more likely to go out of business and leave their users high and dry. There wouldn’t be any loss of support for CPUID’s customers if the company went bust because it doesn’t offer any support. Unfortunately, CPUID hasn’t written any digital documentation on its products either.
Unsurprisingly, with no form of customer support on offer, CPUID gets a very low SupportScore: 0.5 out of 10.
Why do we recommend it?
The big advantage of HWMonitor is that it has a free version and the paid options are very cheap. You can centrally monitor the CPU availability of all of your hosts. A demerit of this system in comparison to higher-placed services on this list is that it doesn’t monitor network devices.

There is also an extended version of HWMonitor called HWMonitor PRO, which costs $22.10 (£17.08) for 10 remote connections or $38.71 (£29.92) for up to 20 remote connections. HWMonitor Pro adds remote monitoring, graph generation, and an improved user interface.
Who is it recommended for?
The free service is a good option for very small businesses and the paid editions are good options for SMBs that run a fleet of endpoints. Larger organizations would be better off with a system monitor that includes CPU monitoring along with server and network monitoring.
Pros:
- Freeware Option: Freeware with paid options available for remote monitoring, offering flexibility based on user needs.
- Suitable for SMBs: Ideal for home labs and smaller networks due to its cost-effective nature.
- Monitors CPUs and GPUs: Designed to run on Windows.
Cons:
- Lacks Customizable Interface; Interface lacks customization options, which can make it challenging to focus solely on desired metrics.
- Visualization Can be Better: Could benefit from improved visualization features for reporting over extended periods, enhancing data interpretation and analysis.
When using the PRO version you can monitor multiple PCs in a list view. Next to each device you can view the Value, Min, and Max temperatures of hardware components. The list perspective makes it easier to monitor multiple devices at once. You can download the program for free.
2. NZXT CAM
Tested on: Windows
Best for: Games computers
Price: Free

NZXT CAM is a free onboard system monitoring tool that is provided by a self-build games PC components producer. It is possible to set up a login account for the tool but it isn’t necessary; you can use the system as the Guest account. CPU temperature, clock speed, and fan status are three of the metrics that are available on the PC Monitoring screen. When we tested NZXT CAM we found the following key features.
NZXT CAM’s key features
You can use NZXT CAM on any PC, not just those tuned for gaming. Its best features are:
- Ease of Installation: User-friendly installation process for hassle-free setup.
- CPU Statistics: Provides detailed statistics and information about the CPU.
- GPU Information: Offers insights into the status and performance of the GPU.
Unique buying proposition
NZXT CAM’s unique buying proposition lies in its sleek, user-friendly interface and real-time monitoring of system performance. It provides in-depth insights into CPU temperature, GPU stats, fan speeds, and power usage, all in one place. Designed for gamers and PC enthusiasts, it offers customizable controls for optimized system performance and cooling.
Feature-in-focus: NZXT CAM’s customizable dashboard
NZXT CAM’s customizable dashboard allows users to tailor their monitoring experience by displaying key metrics such as CPU temperature, GPU load, fan speeds, and more. The intuitive interface lets users prioritize the information they care about, offering easy access to real-time data and personalized control over system performance and cooling.
Comparitech SupportScore
NZXT isn’t a software company; it produces computer components and gaming PCs. The CAM software is a free tool that the company makes available to attract a customer base for its hardware. So, it is difficult to assess the company’s SupportSciore just for the CAM product. Our formula assesses the company rather than one of its products. Naturally, most of NZXT’s support effort goes into its profitable hardware products.
NZXT gets a very high SupportScore of 9.2 out of 10. However, remember, that’s more for the support of its hardware products than for the CAM software.
Why do we recommend it?
NZXT CAM has the most attractive interface of all of the CPU monitoring systems on this list. The first two tabs of the tool show useful system information and all of the subsequent tabs display advertisements for NZXT products. The advertising is not intrusive.

Not all of the statistics in the utility will have values. For example, if your PC doesn’t have a graphics processing unit, GPU is a whole action of the screen that will be useless and very few fans include status reporting processes. However, you will get CPU temperature. The tool is only available for Windows and you can download it for free.
Who is it recommended for?
NZXT CAM is an onboard tool, so it reports on the device on which it is installed – it can’t report across a network. You would have to install the software on every PC, which would be tedious for system administrators of large businesses and not ideal for managed service providers.
Pros:
- Live Hardware Statistics: Real-time monitoring of hardware components for up-to-date information and hardware statistics.
- Visually Appealing Display: User-friendly interface with visually appealing layout for easy navigation.
- Free to Use: Available at no cost to users, making it accessible to a wide audience.
Cons:
- Can’t be Accessed Remotely: Lack of remote access functionality limits monitoring capabilities when away from the system.
This tool is most suitable for small businesses and home use.
3. Open Hardware Monitor
Tested on: Windows and Linux
Best for: PC monitoring
Price: Free

Open Hardware Monitor is an open-source hardware monitoring solution that monitors the temperature, fan speed, load, voltage, and clock speed of computers. The tool supports common hardware chips meaning it can be deployed in a range of environments. The user interface displays the data pulled from temperature sensors in a list format – making it easy to find mission-critical devices and maintain them.
Open Hardware Monitor’s key features
The tool is an open source project. Its most important features are:
- Free to Use: No cost associated with utilizing the software.
- Monitors Hardware Metrics: Tracks crucial hardware metrics including temperature, voltage levels, clock speeds, and fan speeds.
- Multi OS Support: Compatible with both Windows and Linux operating systems.
Unique buying proposition
Open Hardware Monitor’s unique buying proposition lies in its open-source nature, offering free and transparent monitoring of system hardware. It tracks CPU temperature, fan speeds, voltages, and load in real-time. With support for a wide range of hardware and customizable settings, it provides an accessible and efficient solution for hardware monitoring.
Feature-in-focus: Open Hardware Monitor’s open source status
Open Hardware Monitor’s open-source status allows users to access, modify, and contribute to the software’s code, ensuring transparency and flexibility. As a free tool, it provides an inclusive solution for monitoring hardware performance, including CPU temperature and fan speeds, while fostering community-driven improvements and customization options.
Comparitech SupportScore
Many of the tools on this list are free; Open Hardware Monitor is one of these. This tool was produced by Michael Möller who still holds the product and hasn’t hired any people to help him – he isn’t making any money from his free tool. Thus, there is no Customer Support team for this software.
Some free tools providers make up points in our SupportScore system by providing a lot of online or in-app help; Möller doesn’t do this, so his score is only 0.5 out of 10.
Why do we recommend it?
Open Hardware Monitor tracks issues with the device that hosts it, so this isn’t a networked solution. However, its good points are that it monitors many hardware aspects, not just CPU, and that it is free of charge.
Open Hardware Monitor is recommended for those users who want to use a low-cost, open-source temperature monitoring platform. Open Hardware Monitor is available for Windows XP, Vista, 7, 8, 8.1, 10, 11,and Linux. You can download the program for free.
We recommend Open Hardware Monitor because of its open-source, free-to-use model, offering transparency and flexibility. It provides reliable real-time monitoring of system components such as CPU temperature, fan speeds, and voltages. With its wide compatibility, customization options, and active community, it is an excellent choice for users seeking a reliable hardware monitoring tool.
Who is it recommended for?
Open Hardware Monitor is recommended for tech enthusiasts, DIY PC builders, and users who prefer open-source software. It’s ideal for individuals seeking a free, customizable, and transparent tool to monitor system hardware, including temperature, voltages, and fan speeds. It’s also suitable for those comfortable with tweaking and contributing to open-source projects.
The Open Hardware Monitor is a great choice for home computers and very small businesses that have individual PCs rather than networked systems. A good feature of this package is that it is available for Linux as well as for Windows.
Pros:
- Open-Source: Open Hardware Monitor is open-source, providing transparency to users.
- Comprehensive Monitoring: Can measure other metrics like fan speed, clock speed, and voltage alongside temperature readings:
- Better Suited for SOHO Networks: Ideal for individual users and hardware enthusiasts seeking detailed hardware monitoring.
Cons:
- No Management Console: Lacks a centralized management console
- Lacks Multi-Machine Monitoring: Cannot monitor multiple machines simultaneously
- Not Ideal for a Business Environment: Due to limitations in multi-machine monitoring and lack of enterprise-level features, it may not be suitable for business environments.
4. Core Temp
Tested on: Windows, Windows Server
Best for: Monitoring older PCs
Price: Free

Core Temp is a temperature monitoring tool that can monitor Intel processors, AMD, and VIAprocessors in real-time. The program uses data taken from the Digital Thermal Sensor(DTS) of each processing core. The software collects the data and then displays it on the screen so the user can take an accurate temperature reading.
Core Temp’s key features
Core Temp is a straightforward temperature monitor. Its important features are:
- Focused on Temperature: Core Temp primarily focuses on monitoring CPU temperature.
- Metrics Measurements and Reporting: Provides detailed metrics measured at the core level, offering precise temperature readings.
- Extensible: Offers the ability to extend functionality through plugins for additional features.
Unique buying proposition
Core Temp’s unique buying proposition lies in its lightweight, user-friendly design that focuses solely on accurate CPU temperature monitoring. It provides real-time temperature data for each core, with support for a wide range of processors. Its simplicity and low system resource usage make it ideal for users seeking precise temperature tracking without complexity.
Feature-in-focus: Core Temp’s core temperature measurements
Core Temp provides highly accurate, real-time core temperature measurements for each individual CPU core. It supports a wide variety of processors, delivering precise temperature readings to help users monitor system health. This enables efficient temperature management, preventing overheating, enhancing performance, and ensuring the longevity of the CPU and overall system.
Comparitech SupportScore
Core Temp is similar to Open Hardware Monitor; it is the product of a sole trader and is available for free. The SupportScore calculation for Arthur Liberman, the producer of Core Temp is the same as the score for Michael Möller: 0.5 out of 10.
Like Michael Möller, Libermsan hasn’t written any documentation to help the users of his product and he doesn’t have any staff for a Customer Support team.
Why do we recommend it?
Core Temp is easy to install and it is free to use. The tool will warn you if your PC is getting to the point of overheating but it also provides a range of live hardware status reports.

There are multiple add-ons available for Core Temp so the user can add additional capabilities. For example, the Core Temp Monitor app allows users to monitor devices on Windows and Android phones. The Core Temp Grapher plug-in creates a visual display that creates a graph for each processor core showing load percentage and core temperature.
We recommend Core Temp for its simplicity, accuracy, and efficiency in monitoring CPU core temperatures. Its lightweight design ensures minimal system resource usage while providing precise, real-time temperature readings for each core. Ideal for users who need a straightforward, reliable tool for temperature management without unnecessary complexity.
Who is it recommended for?
Core Temp is a good tool for people who run older PCs that need closer monitoring than new computers that have sophisticated hardware monitors built into them. The tool is more appropriate for home use than for businesses.
Pros:
- Remote Temperature Monitoring: Enables users to remotely monitor their system’s temperature using Android and iPhone mobile devices.
- Free for Personal Use: Available at no cost for personal usage, making it accessible to a wide range of users.
- Lightweight: Barebones interface makes the tool very lightweight and resource conservative. This minimalist interface ensures efficient performance with minimal system resource consumption.
Cons:
- Dependency on Plugins: Reliance on plugins for visual enhancements may inconvenience some users who prefer integrated features.
- Not Ideal for Large Networks: While suitable for individual or home use, Core Temp may lack the robustness required for managing extensive network infrastructures.
- Lack Alerting Features: Absence of alerting functionality limits its capability to notify users about critical temperature thresholds or system issues in real-time.
Core Temp is available for Windows XP, Vista, 7, 8, 10, 11, 2003 Server, 2008 Server, 2012 Server, and 2016 Server. For commercial use, you have to purchase a commercial license. You can request a quote from the company directly. Download Core Temp for free.
5. SpeedFan
Tested on: Windows, Windows Server
Best for: Computer fan monitoring
Price: Free

SpeedFan is a hardware monitor that monitors: temperature, fan speed, voltage, and hard disk temperatures. The software can also display S.M.A.R.T data from hard disks. With SpeedFan you can configure the program to change fan speeds remotely according to the system temperatures. For example, you can choose a minimum and maximum fan speed.
SpeedFan’s key features
This is an enthusiast-developed tool. Its main features are:
- Temperatures, Voltage, and Fan Speed Monitoring: SpeedFan comes with features that allows users to monitor temperatures, voltage levels, and fan speeds of their system components.
- CPU and Disk Monitoring: It provides monitoring capabilities for CPU and disk usage, allowing users to keep track of system performance.
- Lightweight Tool: Won’t drag down your CPU.
Unique buying proposition
SpeedFan’s unique buying proposition lies in its comprehensive hardware monitoring capabilities, offering real-time temperature monitoring for CPUs, GPUs, and other system components. It allows users to control fan speeds, optimize cooling performance, and prevent overheating. Its customizable interface and support for a wide range of hardware make it a powerful tool.
Feature-in-focus: SpeedFan’s fan speed monitors
SpeedFan’s fan speed monitoring feature allows users to track and control the speeds of system fans, helping optimize cooling performance. It provides real-time data on fan activity, enabling adjustments to reduce noise or improve airflow. This ensures efficient system cooling and helps prevent overheating, enhancing overall hardware performance and longevity.
Comparitech SupportScore
SpeedFan is provided by Alfredo Milani Comparetti, a lone developer in the same mold as Michael Möller and Arthur Liberman. Like those two, Comparetti is happy to give away his software and doesn’t make enough money to set up a Customer Support team. He hasn’t created any digital documentation about the product either, so SpeedFan gets a SupportScore of 0.5 out of 10.
Why do we recommend it?
SpeedFan is a free system that not only monitors fan speed but it can also intervene and change it. This is a great help if you have an older PC that tends to overheat. The system also monitors CPU activity.

The user interface is simple to use, and the platform automatically detects temperature sensors so you don’t need to waste time creating extensive configurations. However, if you want to engage with more complex configurations you can do so on the Advanced page. Here you can offset inaccurate temperature readings and control fan speed.
Similarly, if you want to view visual displays then you can do so through the Charts window. The Charts window displays performance charts that allow you to choose what metrics you want to monitor. Simply enter the start and end time of your reading, what elements you want to monitor, and the values you want to see.
We recommend SpeedFan for its ability to monitor and control fan speeds, ensuring efficient system cooling. Its comprehensive hardware monitoring, including real-time temperature tracking and customizable fan adjustments, helps prevent overheating and optimize performance.
Who is it recommended for?
SpeedFan is recommended for PC enthusiasts, system builders, and advanced users who want detailed control over their system’s cooling. It’s ideal for those looking to monitor temperatures, adjust fan speeds, and optimize airflow to prevent overheating. It’s especially useful for users managing custom-built PCs or overclocked systems. The tool can’t be networked, so it won’t interest corporate system administrators.
This tool runs on Windows and it monitors the computer on which it is installed. The system is free to use and it isn’t really suitable for business use.
Pros:
- Free to Use: SpeedFan is available for free, making it accessible to users without any cost.
- Ease of Use: SpeedFan offers a straightforward installation process, and it begins pulling metrics immediately after setup.
- Correlates Fan Speed with Temperature: It helps users correlate fan speeds with temperature, enabling better understanding and management of system cooling.
Cons:
- Not Suitable for Larger Networks: SpeedFan is more suited for individual machine monitoring and may not scale effectively for larger network environments.
- Lacks Long-Term Monitoring Features: It lacks features for long-term monitoring and analysis of system performance trends over time.
- Lacks Robust Reporting; The reporting capabilities of SpeedFan may not be as robust or user-friendly as some other monitoring tools, potentially requiring improvements for better usability.
SpeedFan is available for Windows 9x, ME, NT, 2000, 2003, XP, Vista, Windows 7, 2008, Windows 8, Windows 10 & 11, and 2012. You can download the tool for free.
6. AIDA64 Extreme
Tested on: Windows, Windows Server
Best for: Used computer resellers.
Price: $59.95 per year for three PCs

AIDA64 Extreme is a device monitor that monitors temperature, voltage, fan speeds, and power. AIDA64 supports over 250 different types of sensors meaning it works with most IT assets. The user interface is simple with a SensorPanel where you can build a custom panel to monitor temperature data and other information.
AIDA64 Extreme’s key features
This is an on-device tool, so it isn’t possible to aggregate data from multiple computers in a central console. The system’s main features are:
- Extensive Device Monitoring Capabilities: It provides comprehensive monitoring capabilities for devices, covering various aspects of performance and hardware specifications.
- Supports External Displays: AIDA64 Extreme supports external displays, making it suitable for network operation centers or smartphone apps, enhancing accessibility and usability.
- Benchmarking Tools: Useful for assessing the performance of various system components, including processor, memory, and disk drives.
Unique buying proposition
AIDA64 Extreme’s unique buying proposition lies in its comprehensive system diagnostics and benchmarking capabilities. It provides in-depth hardware monitoring, including CPU, memory, and GPU performance, as well as real-time temperature tracking. With detailed reports and customizable alerts, AIDA64 Extreme is perfect for overclockers, PC enthusiasts, and professionals seeking powerful system analysis tools.
Feature-in-focus: AIDA64’s use for overclocking
AIDA64 Extreme is a useful tool for overclocking. It offers real-time monitoring of key components like CPU, memory, and GPU. It tracks temperature, voltage, and stability during overclocking tests, helping users safely push hardware limits. Its benchmarking and diagnostics ensure optimal performance while preventing potential damage from overheating or instability.
Comparitech SupportScore
The AIDA64 product line makes money for its owner, FinalWire Ltd. The company has ten employees and has a moderate turnover. Although this isn’t one of the richest companies in the world, it doesn’t make a loss. As it is a stable and long-running company, FinalWire Ltd gets some corporate-related points in the SupportScore calculation.
FinalWire provides documentation for its products but doesn’t have a Customer Support team. Thus, the SupportScore for the company is 2 out of 10.
Why do we recommend it?
We recommend AIDA64 Extreme for its comprehensive system monitoring, detailed diagnostics, and powerful benchmarking tools. It’s especially useful for overclockers and PC enthusiasts, offering real-time tracking of temperatures, voltages, and performance metrics. Its in-depth reporting and customizable alerts help ensure stable, optimal system performance while preventing overheating and hardware damage.

AIDA64 Extreme provides monitoring of a number of hardware features and a notable advantage of this tool is that it is available for macOS, Android, and iOS as well as Windows. However, it isn’t available for Linux.
One feature that is particularly useful for enterprise users is external display support. You can view hardware data on over 50 external LCD/VFD screens, including smartphones and tablets. Display support makes sure that you can see all of the information that you need.
Who is it recommended for?
This tool is recommended for home use or for those who custom build or recycle computers. The tool is able to test a PC for correct performance and spot component issues. So, users who want to reconfigure or push hardware for tricks such as overclocking would also use this package.
The AIDA64 Extreme system provides processor diagnostics and so it is particularly useful for use with mission-critical hardware.
Pros:
- 250 Sensors for Detailed Measurement; It is designed for technicians and outputs very detailed measurements, offering over 250 sensors for comprehensive monitoring.
- Compatibility with Older Hardware: AIDA64 Extreme offers a version compatible with 32-bit systems, ensuring compatibility with older hardware configurations.
- Customizable Dashboard: AIDA64 Extreme offers a customizable dashboard, allowing users to tailor the display of information according to their preferences.
Cons:
- Windows Only: AIDA64 Extreme is limited to the Windows operating system, potentially restricting its use for users on other platforms.
- Not Ideal for Larger Networks: The licensing model may not be suitable for enterprise companies, as it is marketed more towards smaller networks.
- Overwhelming Interface: The interface can feel overwhelming for users without customization, potentially requiring adjustments to suit individual preferences.
- Lacks Robust Alerting Features: Some users may find the alerting features of AIDA64 Extreme lacking in options and customization, potentially requiring improvements for better functionality.
AIDA64 Extreme is available for all 32-bit and 64-bit versions of Windows. The tool is useful for users who want a low maintenance temperature monitor. You can purchase AIDA64 Extreme for home users from $39.95 (£30.87) for three PCs. You can download the 30-day free trial.
7. Rainmeter
Tested on: Windows
Best for: Custom designing Desktop backgrounds and lock screens
Price: Free

Rainmeter is a free, open-source CPU temp monitor for Windows. Rainmeter can monitor data on temperature, CPU, RAM, disk usage, and more. There is a range of skins that make this possible. Skins are essentially small tools that you can customize the layout of. The user can create monitoring skins, use one of the starter packs or install a plugin.
Rainmeter’s key features
Rainmeter isn’t just for creating a temperature monitor; you can create any design. Its main features are:
- Performance Monitoring Features: It offers monitoring capabilities for various system metrics, enabling users to track important aspects of system performance.
- Extensive Customizable Features: Rainmeter allows users to apply custom skins via plugins or premade starter packs, and a drag and drop user-friendly interface menus enabling extensive customization.
- Resource Utilization Reporting: Rainmeter provides reports on resource utilization (such as CPU, RAM, and disk) as well as temperature monitoring.
Unique buying proposition
Rainmeter’s unique buying proposition lies in its highly customizable, open-source desktop customization tool that allows users to create and display various system monitoring widgets, including CPU temperature, RAM usage, and disk performance. Its flexibility and user-driven design make it ideal for those seeking a personalized and functional desktop experience.
Feature-in-focus: Rainmeter’s skins library
Rainmeter’s skins library offers a vast collection of customizable, user-created skins that enhance desktop aesthetics and functionality. These skins display real-time system data, such as CPU usage, memory, and temperature. With a wide variety of themes and designs, users can easily personalize their desktop while monitoring system performance efficiently.
Comparitech SupportScore
Rainmeter is actually an open source project. It has one worker, who is the administrator of the software of the project. The tool is free and so the project isn’t profitable and does not have the budget to maintain a Customer Support team. However, the unpaid development team wrote documentation in the form of help screens, guides, and troubleshooting tips, so Rainmeter gets a SupportScore of 1.5 out of 10.
Why do we recommend it?
We recommend Rainmeter for its unique ability to combine desktop customization with real-time system monitoring. Its extensive library of customizable skins allows users to personalize their desktop while keeping track of CPU, memory, and other performance metrics. It’s perfect for those who want both functionality and aesthetic control.

Rainmeter provides an attractive display of system hardware statuses for Windows PC. The great feature of this tool is that it is free to use.
For example, the CoreTemp plugin allows the user to pull information from the CoreTemp application. The advantage of doing this is that you can use skins to control how you see information on the screen.
Skins are drag-and-drop so you can create a custom monitoring panel for better visibility. You can also use one of the starter skins so you don’t have to create any if you don’t want to.
Who is it recommended for?
Rainmeter is recommended for tech enthusiasts, gamers, and anyone who enjoys customizing their desktop. It’s ideal for users who want to monitor system performance, such as CPU temperature and RAM usage, while also personalizing their desktop with visually appealing and functional widgets. It is best suited for those with a creative, tech-savvy mindset.
Pros:
- Sleek Minimalist Design: Rainmeter features a sleek and minimalist design, which is lightweight and visually appealing.
- Free and Open-Source: Being open-source, Rainmeter allows for transparency and community-driven development.
Cons:
- Not Suited for Larger Networks: Rainmeter may not be the best option for larger networks, as it is primarily targeted towards hobbyists and home users.
- Lacks Detailed Metrics: While great for non-technical users, Rainmeter may lack some detailed metrics required for in-depth system monitoring and analysis.
- Lacks Robust Reporting Features: Rainmeter may not offer robust reporting features for long-term monitoring and analysis of system performance trends.
If you’re looking for a customizable tool that’s accessible for non-technical users then Rainmeter is an excellent choice. Rainmeter is available from Windows 7 to Windows 10. It’s available as a free download.
Which CPU monitoring software works on Windows?
| Name | Platform | Price |
|---|---|---|
| Paessler PRTG | Windows | Free trial |
| HWMonitor | Windows | Free version available |
| Open Hardware Monitor | Windows, Linux | Free |
| Core Temp | Windows | Free |
| Paessler CPU Monitoring with PRTG | Windows, Linux, Mac | Free trial |
| HWiNFO | Windows | Free |
| SpeedFan | Windows | Free |
| AIDA64 Extreme | Windows | Free trial |
| Rainmeter | Windows | Free |
CPU Load & Temperature Monitors: Stop Your Devices from Overheating
CPU temperature monitors make it easier to monitor the heat of an entire network of devices. ManageEngine OpManager, Site24x7, PRTG, and Atera are all reliable solutions for monitoring CPU performance. Implementing regular hardware monitoring with CPU monitors will make sure your devices stay available year-round.
Why trust us?
Comparitech is a trusted authority in the IT industry, offering expert analysis, reviews, and comparisons of various software and technology solutions. With our team of experienced professionals, Comparitech provides reliable, unbiased advice on IT systems, cybersecurity tools, and software deployment. Our in-depth research and thorough evaluations ensure businesses can make informed decisions, optimizing their IT infrastructure and improving operational efficiency with confidence.
Our methodology for choosing CPU temperature monitoring software for business and home use
For Business Use:
When selecting CPU temperature monitoring software for business use, we follow a comprehensive methodology to ensure that the tool meets the unique needs of organizations, whether small or enterprise-level. Key considerations include:
- Scalability and Compatibility: We prioritize software that can support various hardware configurations and scale as the business grows. The tool must work across multiple operating systems and hardware platforms, including servers, desktops, and workstations.
- Real-time Monitoring and Alerts: For businesses, real-time monitoring and instant alerts are essential to quickly detect and address overheating issues before they affect performance or cause downtime. We focus on solutions that offer customizable notifications for critical temperature thresholds.
- Integration with Existing Systems: We evaluate software based on its ability to integrate with other IT management and monitoring tools businesses already use. Seamless integration helps centralize monitoring efforts and improves overall efficiency.
- Data Logging and Reporting: Businesses often require detailed historical data and reporting for compliance, auditing, and performance analysis. Software that offers comprehensive logs and customizable reports is preferred.
- Security Features: Given the sensitive nature of business data, we assess software for strong security features, including secure access controls and encryption to protect monitoring data.
- Vendor Support and Documentation: Effective customer support and thorough documentation are crucial for business users. We focus on solutions that offer excellent vendor support, user manuals, and troubleshooting resources.
For Home Use:
When choosing CPU temperature monitoring software for home use, our methodology shifts to prioritize ease of use, affordability, and sufficient functionality for non-professional users. Key considerations include:
- User-Friendly Interface: For home users, simplicity is key. We favor software with intuitive, easy-to-navigate interfaces that allow users to monitor CPU temperatures without needing technical expertise.
- Cost-Effectiveness: Many home users are looking for affordable or free solutions. We recommend software that delivers excellent value, providing essential features at a low cost or with a free tier, while also ensuring reliability.
- Basic Features and Real-time Alerts: Home users typically need basic monitoring features like real-time temperature tracking and alerts for overheating, but they don’t need the advanced features required by businesses. We focus on software that offers these core capabilities.
- System Compatibility: We ensure that the software works on popular home operating systems like Windows, macOS, and Linux, and supports common home hardware, such as gaming PCs, personal laptops, and workstations.
- No Overcomplication: Home users generally don’t need overly complex configuration options. We prefer software that provides essential functionality without overwhelming users with too many settings or features.
- Support and Community Resources: While businesses require comprehensive support, home users benefit from accessible online communities, forums, or simple help guides. We look for software that offers accessible support and a strong user community.
By following this tailored methodology for both business and home use, we ensure that the recommended CPU temperature monitoring software meets the distinct needs and expectations of each user group.
Broader B2B Software Selection Methodology
When selecting B2B (business-to-business) software, we follow a structured and thorough methodology to ensure that the tools chosen meet the specific needs of an organization, its employees, and its business goals. This methodology takes into account not only the functionality of the software but also factors like scalability, security, and cost-efficiency. Below are the key steps involved in our B2B software selection process:
1. Define Business Requirements
The first step is to understand the specific business requirements the software needs to address. This includes evaluating the objectives, challenges, and goals the organization hopes to achieve. By collaborating with key stakeholders, we gather detailed requirements that help narrow down potential software options that align with business processes.
2. Evaluate Core Features
After defining the requirements, we assess software options based on their core features. This includes identifying the primary functionalities, such as automation capabilities, reporting features, integration abilities, scalability, and ease of use. We prioritize software that directly addresses the pain points and enhances operational efficiency.
3. Scalability and Flexibility
Scalability is a critical factor for B2B software. We look for solutions that can grow with the business, supporting increasing users, data volume, and complex use cases. Flexibility is also key, as businesses often require software that can adapt to changing processes and needs. A solution that can scale efficiently without compromising performance is a top priority.
4. Integration with Existing Systems
Any software selected must integrate seamlessly with existing systems and software used by the business. We assess the ability of the tool to integrate with other enterprise solutions, such as customer relationship management (CRM) systems, enterprise resource planning (ERP) tools, data analytics platforms, and other critical business applications.
5. User Experience and Adoption
The ease of use and user interface of the software are vital for ensuring employee adoption and maximizing its effectiveness. We evaluate the intuitiveness of the user interface and the learning curve associated with the software. Additionally, we assess whether it offers training resources, onboarding support, and adequate documentation to ensure smooth adoption.
6. Security and Compliance
Security is paramount when selecting software for business use. We scrutinize software for its security features, such as data encryption, user authentication, and compliance with industry-specific regulations (e.g., GDPR, HIPAA). Software must meet the highest standards of security to protect sensitive business data and ensure compliance with legal requirements.
7. Total Cost of Ownership (TCO)
We consider not only the initial cost of purchasing the software but also its total cost of ownership over time. This includes subscription fees, maintenance and upgrade costs, support fees, and potential hidden costs. We also account for the return on investment (ROI) that the software will deliver, based on its efficiency and productivity improvements.
8. Vendor Reputation and Support
The reputation of the software vendor is a key consideration. We review customer feedback, vendor history, and industry reviews to gauge the reliability and reputation of the software provider. We also evaluate the level of support offered, including customer service, technical support, and response times. Ongoing support and the availability of resources are crucial for businesses that rely on software for critical operations.
9. Customization and Future-proofing
As businesses evolve, their needs often change. We look for software that allows for customization to fit specific business requirements and the flexibility to accommodate future upgrades or new features. Ensuring that the software is future-proof and will continue to meet business needs is essential for long-term success.
10. Trial Period and Testing
Before committing to any B2B software solution, we encourage a trial or pilot phase. This gives the organization an opportunity to test the software in a real-world environment, evaluate its performance, and gather feedback from users. Testing allows for better-informed decisions and ensures that the software will meet expectations.
11. Feedback from Stakeholders
Collecting feedback from key stakeholders who will be using the software is essential. This includes IT teams, end-users, department heads, and other relevant parties. Their insights will help identify potential issues, ease of use, and overall satisfaction with the software, leading to a more informed and collective decision-making process.
By following this comprehensive methodology, we ensure that businesses select software solutions that align with their goals, deliver value, and support long-term growth. This structured approach minimizes risks, enhances operational efficiency, and ensures that businesses invest in tools that will provide the most benefit over time. You can read more about our methods in How we review B2B software and vendors at Comparitech.
CPU Temperature Monitors FAQs
How do I check my CPU usage?
In Windows, CPU usage is displayed as a live metric in the Task Manager.
- Right-click on the Task Bar at the bottom of the screen and select Task Manager from the pop-up menu.
- Wait for the Task Manager to open and then click con the Performance tab.
- Click on CPU at the top of the left-hand options list to see a live graph of CPU performance.
What CPU temperature is too high?
There are many factors to be taken into account when working out what is an acceptable CPU temperature. However, as a rule of thumb, for an Intel processor, a temperature of more than 40 oC/104 oF when it is inactive is worrying. A temperature of more than 85 oC/185 oF when it is under full load is a cause for concern.
What is a normal CPU temperature at full load?
For Intel processors, generally, the normal CPU temperature at full load is between 50 and 60 degrees Celsius. Intel Celeron processors run hotter at about 65 to 80 degrees Celsius under full load. AMD processors don’t have as much variability per model as Intel processors. They shouldn’t go above 70 degrees Celsius under full load.
Related post: CPU Monitoring Guide & Tools


HWMonitor is not open source.
HWMonitor isn’t but Open Hardware Monitor is
Thanks Cem, we have corrected the error.