
Networks are the lifeline of organizations, and any network issues can have a profound impact on your operations. This is why it helps to have tools that can continuously scan and monitor networks to identify potential problems, so you can fix them quickly. However, given the size of networks and the many devices in them, manual monitoring is difficult.
Network troubleshooting tools are automated platforms that scan your networks to recognize potential problems and even point to their root cause. Specifically, these tools can address the following pain points.
- Slow or intermittent drops in performance: without clarity on the cause.
- Unplanned downtimes and outages: due to network issues, that can impact productivity.
- The presence of rogue or unmanaged devices in the network: as they are security threat.
- Misconfigurations: that can lead to frequent outages.
- Routing and DNS errors: that make some applications unreachable.
- Lack of visibility: into the root cause of problems.
To address the above pain points, we have come up with a list of tools in this guide, and also the process behind this selection.
Our list of the best network troubleshooting and diagnostics tools
Based on our independent research, selection requirements, and rating methodologies, these are the best network troubleshooting and diagnostics tools on the market today:


- SolarWinds Network Configuration Manager – Best for larger businesses on Windows Server.
- Obkio – Best for IT teams with distributed or performance-sensitive networks.
- N-able N-sight – Best for small and mid-sized MSPs.
- Datadog Network Performance Monitoring – Best for any business with cloud or hybrid setups.
- Ping – Best for every network engineer needing quick checks.
- Tracert – Best for all network managers tracing paths.
- Ipconfig – Best for quick local IP and configuration checks.
- Netstat – Best for every network admin checking connections.
- Nslookup – Best for network managers troubleshooting DNS.
- Uptrends Uptime Monitor – Best for website owners needing availability tests.
- Sysinternals – Best for Windows sysadmins managing AD and networks.
- Wireshark – Best for any network manager doing deep packet analysis.
- Nmap – Best for spotting devices and security auditing.
If you need to know more, explore our vendor highlight section just below, or skip to our detailed vendor reviews.
Best network troubleshooting & diagnostics tools highlights

Top Feature
Dependency mapping links sensor failures to reveal the root cause
Price
Starts at $200 per month for 500 aspects when paid annually
Target Market
Network engineers, NOCs, MSPs and IT operations teams
Free Trial Length
30-day free trial
Additional Benefits:
- Links sensor dependencies to isolate root causes
- Monitors devices, traffic and services from one platform
- Alerts teams before outages become widespread
- Supports free monitoring for up to 100 sensors
Features:
- Includes Ping, Traceroute and packet-sniffing sensors
- Uses SNMP, flow protocols and packet inspection
- Monitors TCP ports and TLS-protected port ranges
- Maps devices, dependencies and performance paths

Top Feature
NetPath visualizes hop-by-hop latency and packet performance
Price
Annual subscription starts at $1,233 for 50 devices
Target Market
IT operations teams, NetOps teams, SREs and MSPs
Free Trial Length
30-day free trial
Read more ▼
Top Feature
Cloud monitoring combines SNMP discovery with root cause analysis
Price
Starts at $9 per month
Target Market
MSPs and distributed IT teams managing hybrid networks
Free Trial Length
30-day free trial
Read more ▼

Top Feature
Automated rollback restores approved network device configurations
Price
Starts at $754
Target Market
30-day free trial
Free Trial Length
30-day free trial
Read more ▼

Top Feature
Visual Traceroute overlays latency, jitter and loss across network paths
Price
Free plan available; paid pricing scales by agents, devices and users
Target Market
Network engineers, MSPs and distributed support teams
Free Trial Length
14-day free trial
Read more ▼

Top Feature
Multi-tenant RMM combines monitoring, automation and service management
Price
Starts at $99 per month for 100 nodes; regional pricing may vary
Target Market
Small and midsized MSPs, helpdesks and remote support teams
Free Trial Length
30-day free trial
Read more ▼

Top Feature
Dynamic network maps connect traffic flows with services and endpoints
Price
Contact sales; pricing depends on hosts and network flow volume
Target Market
Cloud engineering teams, DevOps teams and SREs
Free Trial Length
14-day free trial
Read more ▼

Top Feature
ICMP echo testing measures reachability, latency and packet loss
Price
Free
Target Market
Network administrators, support technicians and home users
Free Trial Length
Free forever
Read more ▼

Top Feature
TTL-based hop discovery isolates delays along a network path
Price
Free
Target Market
Network engineers, IT teams and connectivity support staff
Free Trial Length
Free forever
Read more ▼

Top Feature
DHCP and DNS controls diagnose Windows addressing problems
Price
Free
Target Market
Windows administrators, helpdesk staff and support technicians
Free Trial Length
Free forever
Read more ▼

Top Feature
Process-aware socket inspection links connections with local applications
Price
Free
Target Market
Network engineers, sysadmins, developers and security teams
Free Trial Length
Free forever
Read more ▼

Top Feature
Query-type switching tests DNS records and reverse resolution
Price
Free
Target Market
Network engineers, IT support teams and security analysts
Free Trial Length
Free forever
Read more ▼

Top Feature
Global verification checks confirm outages before alerts are raised
Price
Free on-demand checks; Core starts at $210 per month with 360 credits
Target Market
SREs, DevOps teams and website reliability engineers
Free Trial Length
30-day free trial
Read more ▼

Top Feature
Process-aware Windows utilities expose network and system activity
Price
Free
Target Market
Windows sysadmins, security teams and support engineers
Free Trial Length
Free forever
Read more ▼

Top Feature
Capture and display filters isolate packet-level network problems
Price
Free
Target Market
Network engineers, sysadmins, developers and forensics teams
Free Trial Length
Free forever
Read more ▼

Top Feature
NSE scripts extend network discovery into service and vulnerability checks
Price
Free for end users; OEM redistribution starts at $59,980
Target Market
Network engineers, security auditors and compliance teams
Free Trial Length
Free forever for end users
Read more ▼
Key points to consider before choosing network troubleshooting and diagnostics tools
Network troubleshooting and diagnostics tools alert you to network problems and point you to the source of the problem, all of which ensures efficient troubleshooting and minimal interference with your operations. However, to get the most out of these tools, you must select the one that best meets your needs. Below are a few key aspects to consider.
- Depth vs Breadth: As a first step, make a list of your requirements, and decide if you want to focus on the depth or breadth of network monitoring. For example, tools like Wireshark provide in-depth data about packets, while tools like PRTG cover a wide range of aspects to give you a holistic perspective.
- Ease of Use: This is an aspect across all tools because when it is easy to use, there will be wider adoption within the organization. Moreover, a shorter learning curve can save time and costs.
- Real-time Visibility: Prioritize tools that provide real-time alerts and instant visibility into the root cause of problems, as they can be critical in quickly identifying and resolving network issues.
- Protocol and Device Coverage: Look for tools that cover multiple protocols, as this can be useful when you scale in the future. It is also helpful if you have a mix of legacy, distributed, proprietary, and modern networks.
- Advanced Diagnostic Features: The tool you select must have capabilities like root cause analysis, path analysis, traffic replay, deep inspection, and more. Such advanced features can speed up the resolution process and can even help with proactive measures.
- Security and Compliance: While selecting a tool, it’s important to ensure that the tool has the required security features to safeguard your sensitive data. It also helps if the tool can seamlessly integrate with SOAR and SIEM systems.
Based on the factors, we have come up with a list of the best tools that can work well across multiple industries and use cases.
To dive deeper into how we incorporate these into our research and review methodology, skip to our detailed methodology section.
The best network diagnostics tools & troubleshooting software
When curating this list, we considered the reliability of the tool in use in diverse situations, ease of setting up and use documentation and support, and how up-to-date the diagnostic software is kept.
Five of the tools in our list (ping, tracert, ipconfig, netstat, & nslookup) can be executed directly from a Windows command prompt (cmd.exe) without installing any additional programs for advanced troubleshooting. The rest of the network analysis tools can be used alone or in combination for network discovery.
1. Paessler Network Troubleshooting with PRTG (FREE TRIAL)
Best for: Sensor-based network troubleshooting.
Relevant for: Network engineers, NOCs, MSPs, and IT operations teams.
Price: Starts at $200 per month for 500 aspects.
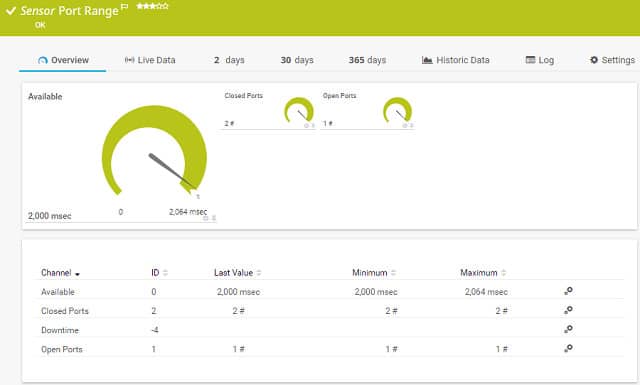
Paessler’s PRTG is a complete monitoring system. It can help you with troubleshooting because it can diagnose network issues right down the protocol stack and identify the root of the problem. Port monitoring is one of the network diagnostics techniques that you can use with this tool.
Paessler PRTG’s network troubleshooting key features
- Flexible Package: Buyer decides which services to activate
- SNMP-Based Monitoring: Automated device status detection
- Traffic Flow Protocols: Bandwidth monitoring
Unique buying proposition
This tool takes a unique approach to monitoring, as it has hundreds of sensors to track different aspects of your network. This approach also offers the flexibility to monitor what you want from specific devices or network segments. It also comes with extensive dashboards and alerting options.
Feature-in-focus: Dependency Mapping
PRTG allows you to link data from different sensors, so the downstream checks are paused automatically when there’s a problem with the upstream devices. Moreover, it generates a dependency map of the “parents” and ”children” to make it easy to identify the root cause of outages.
Why do we recommend it?
Paessler PRTG is a very large package of monitors that include network, server, and application monitors and has sensors for network troubleshooting including Ping implementations and a TraceRoute facility.
The PRTG system includes two port monitoring sensors. One homes in on a specified port on a particular device, the other will check a range of port numbers. This tool only monitors TCP ports. The port range sensor has one extra feature that the single port sensor does not have. You can set it to check the port with TLS protection. Both sensors report on the response time of the port and whether it is open or closed.
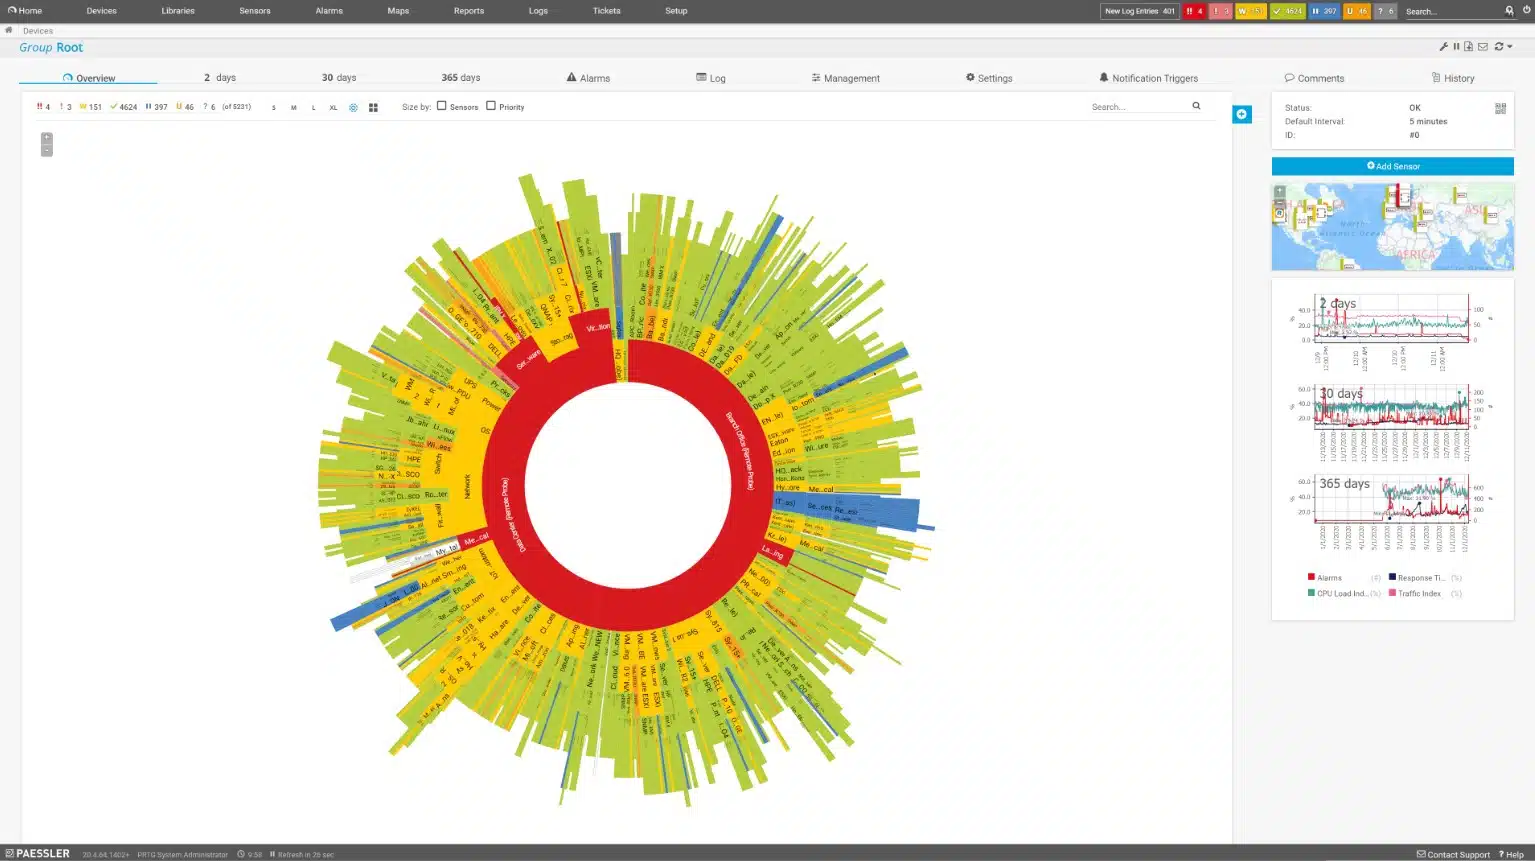
PRTG includes network traffic analysis tools to help you troubleshoot delivery speeds. The tool includes a range of traffic monitoring techniques including route tracing to a destination with Traceroute and a Ping sweep, which will give you the response times to each node on your network. A packet-sniffing utility can tell you which applications and endpoints are producing excessive traffic and you can query the health of the network devices to see which are congested to the point of queuing.
Paessler built a tool that covers servers and applications as well as network statuses, port response times, and services to monitor all conditions that can cause software performance issues. If you’ve got VMs on your network, PRTG can sort through their underlying connections, services, servers, and operating software. That monitoring is constant, so you will be able to trace back through events to spot the source of any performance issues.
Who is it recommended for?
PRTG is a flexible package. All customers get the same software bundle containing thousands of monitoring tools, which are called “sensors.” Each buyer decides how many sensors to turn on and the price for the package is levied as an allowance of sensors. This is a good package for large businesses and small companies can use the system for free if they only turn on 100 sensors.
Pros:
- Free for Small Businesses: No charge for 100 sensors
- System Documentation: Network discovery inventory creation, and mapping
- Uptime Monitoring: Device availability checks
Cons:
- Device Protection Shortfall: No network configuration management
Paessler delivers PRTG as a cloud service or you can install the diagnostic software on your premises. The tool installs on Windows Server environments. You can use the system for free for up to 100 sensors. Start a 30-day free trial.
2. ManageEngine OpManager Nexus (FREE TRIAL)
Best for: Full-stack observability.
Relevant for: IT teams, Security/NetOps teams, SREs, and MSPs.
Price: The price depends on the number of devices that need to be monitored. The annual subscription starts at $1,233 for 50 devices.
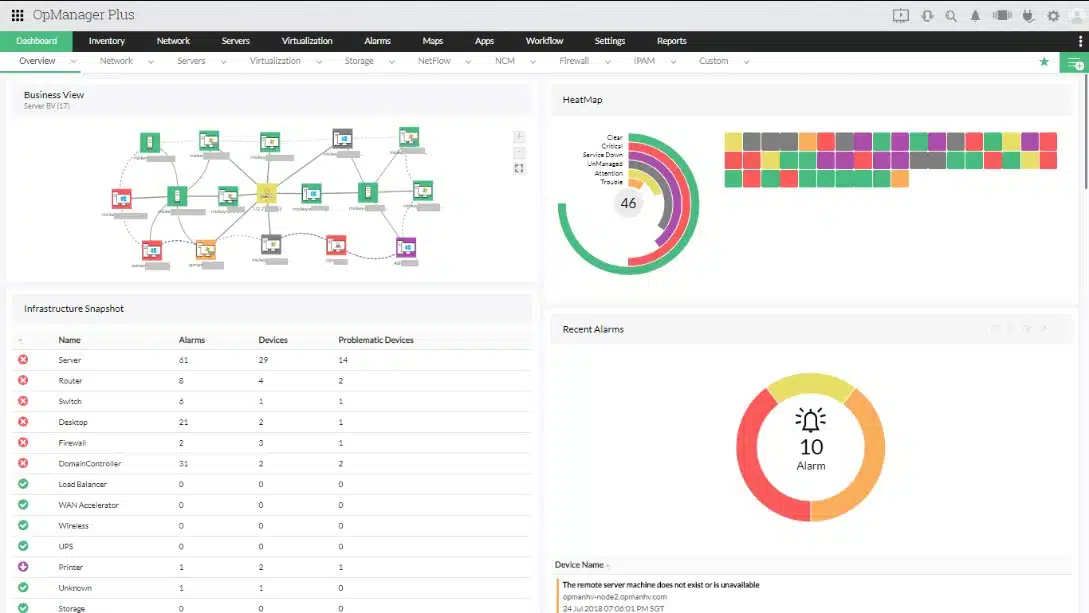
ManageEngine OpManager Nexus gives you all the tools you need to monitor networks and servers. These tasks are complex and could involve tracking the statuses of containers, virtualization, file storage servers, firewalls, and IP address-related issues. OpManager Nexus takes care of all of those tasks and also adds on an application performance monitor to provide the full stack of IT services.
ManageEngine OpManager Nexus’s key features
- Self Setup: Network discovery
- SNMP-Based System: Device monitoring
- Flow Protocols: Traffic analysis
Unique buying proposition
This is a unified monitoring platform that can be used for monitoring a wide range of network, storage, server, application, and infrastructure devices. You can manage the performance of all these devices through a single console, reducing tool sprawl while giving you the visibility you need for troubleshooting. It also offers add-ons like logs, configuration management, and more.
Feature-in-focus: NetPath Analysis
A notable feature of this tool is Netpath Analysis, which visualizes the hop-by-hop performance of packets between source and destination devices. This analysis gives information about latency and packet behavior. It also maintains information about path history and offers route-level insights into delays and outages.
Why do we recommend it?
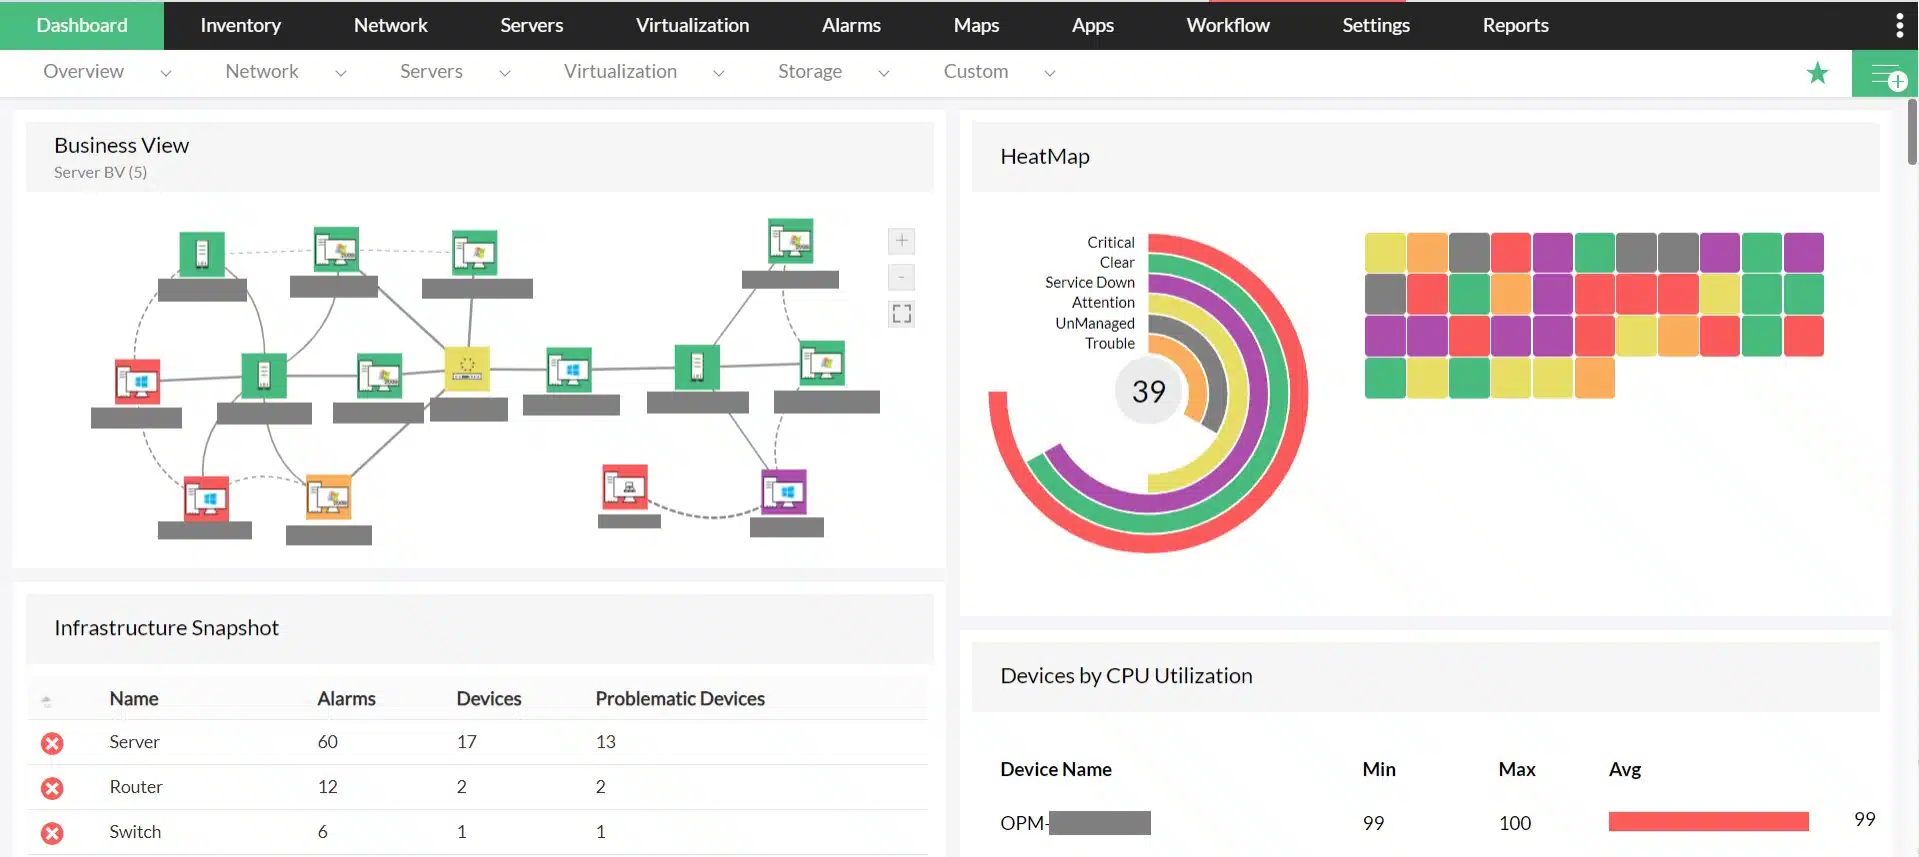
ManageEngine OpManager Nexus combines automated monitoring for networks and servers. The tool is also a good choice for its VM monitoring capabilities. Troubleshooting tools in the software include troubleshooting tools, such as NetFlow and other packet data extraction protocols.
The OpManager Nexus system gives you the tools to scrutinize and manage network devices. The system automatically detects all devices connected to the network, logs them, and then maps the network. The system then provides constant performance monitoring through SNMP.
You also get a bandwidth analyzer with this bundle. You can see live throughput statistics per link and get the system to assess utilization of full capacity. Performance thresholds will generate alerts if tripped. You can channel these through email, SMS, or a service desk ticketing system. The package lets you run tests to ensure constant system availability.
Device management services include an IP address manager that integrates a DHCP and DNS server. You also get a switch port mapper so that you can see exactly how many ports are occupied on each device. A configuration manager lets you standardize the settings of all of your devices, restoring stored configurations automatically in the case of unauthorized tampering.
Who is it recommended for?
There are five editions for OpManager Nexus and these include a Free edition. This monitors networks with only three devices, which could only be for the very smallest businesses. Large organizations and multi-site businesses would benefit from the OpManager Nexus system. There is also an edition built for MSPs.
Pros:
- System Information Management: Log collection and analysis
- Network Device Protection: Includes network configuration management
- Network Address Management: IP address management and port scanning
Cons:
- Very Large System: Includes many non-network management systems, such as application monitoring
The software for ManageEngine OpManager Nexus installs on Windows Server or Linux. The bundle offers a lot of services and so you will spend a lot of time learning all of its functions. You can perform that investigation for free with a 30-day free trial.
See also: Network Configuration & Backup Tools
3. Site24x7 Network Monitoring (FREE TRIAL)
Best for: Cloud-based tool for network visibility
Relevant for: MSPs and global IT teams.
Price: Starts from $9 per month.
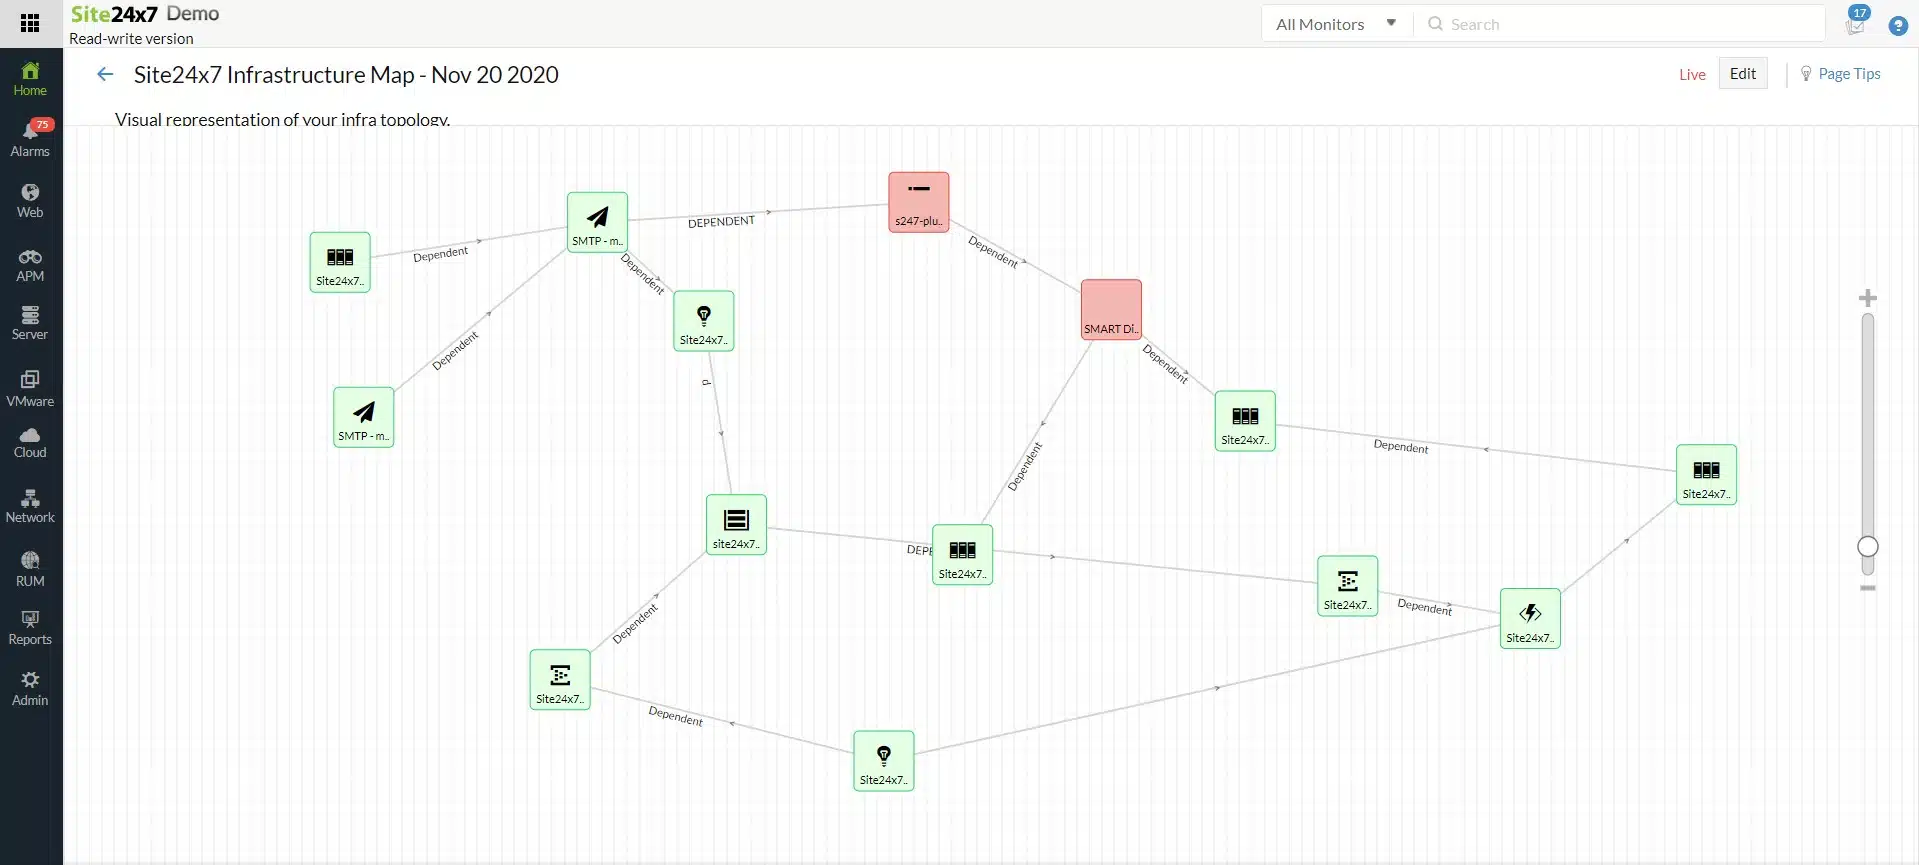
Site24x7 Network Monitoring discovers all of the devices on a network, creates a hardware inventory, and draws up a network topology map. The package implements continuous device performance monitoring and also records traffic patterns to guard against system overloads.
Site24x7 Network Monitoring’s key features
- SNMP-Based System: Network discovery
- Automated System Documentation: Inventory and mapping
- Netflow Protocols: Traffic analysis
Unique buying proposition
This is a SaaS-based platform that operates under the same parent company as ManageEngine. Similar to ManageEngine, it offers a broad set of tools that cover every aspect of network monitoring, but through a cloud-based app. In particular, features like automatic device discovery, multi-vendor support, visual maps, alerts, and reports help with faster troubleshooting.
Feature-in-focus: SNMP-based discovery and mapping
Site24x7 uses an on-premises poller that uses SNMP protocols to scan your network. You have flexibility and control over this polling, as you can define the frequency, IP range, and more. Using the data collected from this poller, you can better understand the devices and their dependencies, performance, and health.
Why do we recommend it?
Site24x7 Network Monitoring uses the Simple Network Management Protocol to identify all devices and create a map. The inventory and map help with troubleshooting but the package goes further, offering alerts when problems are detected, allowing time to fix problems and identifying where the issue lies. The bundle also provides Ping and Traceroute utilities to test connections.
The device agents scan each switch and router and raise alarms when faults are discovered. These alarms get translated into alerts in the Site24x7 dashboard. A traffic monitoring unit in the Site24x7 package will also generate alerts if traffic volumes rise close to the full capacity of a switch interface. The Site24x7 system can be set up to forward alerts as notifications to technicians by SMS, voice call, email, or Slack message.
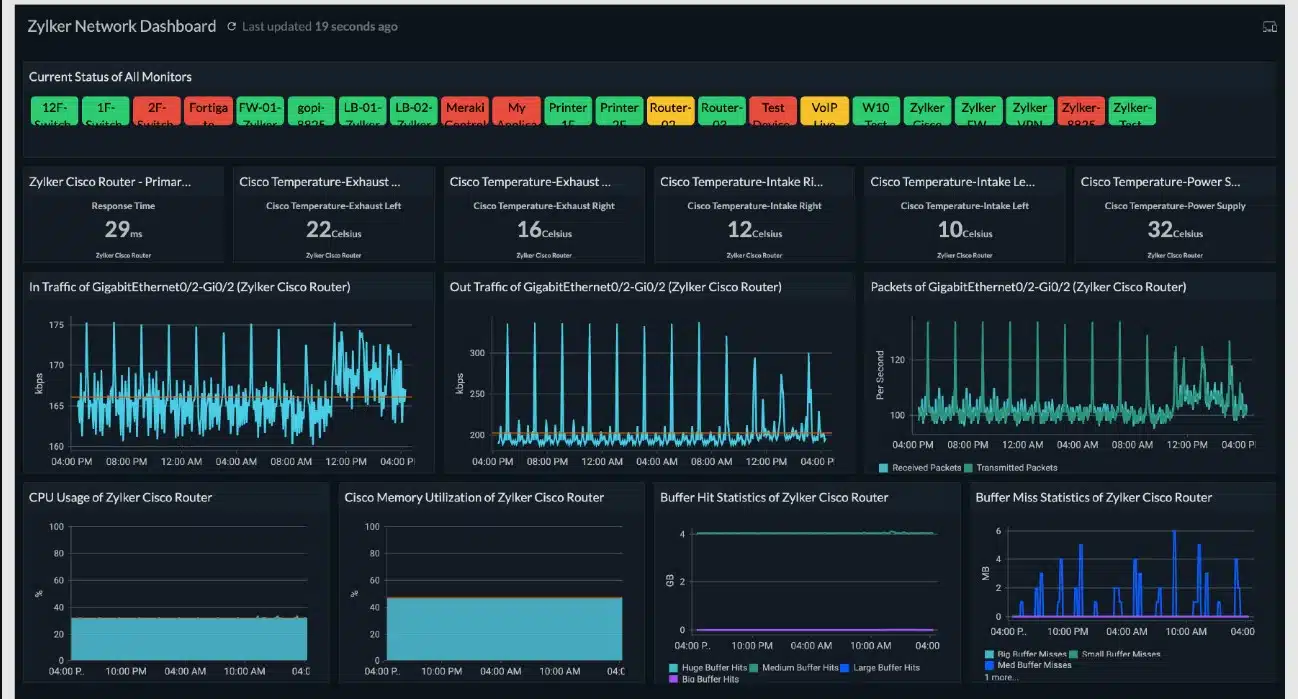
The alerts of the Site24x7 Network Monitoring service provide immediate root cause analysis if network problems arise, so many times, there won’t be any need for troubleshooting. However, the package also includes Ping and Traceroute utilities.
Site24x7 offers SaaS packages and all of them include the network monitoring system. You can’t subscribe to just the Network Monitoring unit by itself. Other utilities in the plans include server and application monitoring systems and also network configuration management and log management.
Who is it recommended for?
The Site24x7 platform is accessible for any size of business. Plans are offered in a base package with capacity expansions available. The based package is sized and priced to be suitable for small businesses but the expansion upgrades make it suitable for larger companies as well.
Pros:
- Automated Status Tracking: Constant SNMP-based device monitoring
- Bandwidth Analysis: Traffic flow protocols
- Device Protection: Network configuration management
Cons:
- Deceptively Low Prices: Base packages are suitable for small businesses and larger companies have to pay for capacity expansions
The Site24x7 plans offer different capacities of each module but all editions include all of the modules on the platform. There is even a plan for use by managed service providers. You can experience Site24x7 with a 30-day free trial.
4. SolarWinds Network Configuration Manager
Best for: Automated management of networks with multiple vendors.
Relevant for: Network engineers, IT teams, MSPs, and compliance officers of large organizations.
Price: Negotiated pricing
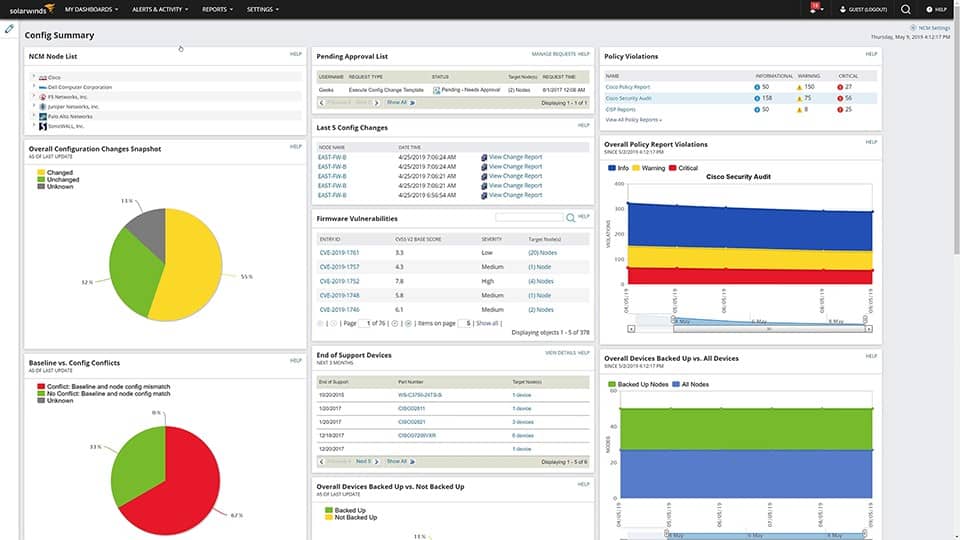
The SolarWinds Network Configuration Manager offers the opportunity to automate system troubleshooting and problem resolution. Busy systems managers often overlook the settings of network devices. The network could be performing badly because you don’t have all of the settings of your devices coordinated. The Network Configuration Manager saves you time by seeking out all devices, the network device health, importing their settings into a central manager, and allowing you to create a standard configuration for each device type and make.
SolarWinds Network Configuration Manager’s key features
- Network Discovery: Access network devices
- Device Protection: Extracts configuration image
- Archiving: Stores configurations
- Device Security Monitoring: Checks for unauthorized configuration changes
Unique buying proposition
SolarWinds NCM comes with extensive automation capabilities for backing up device configurations, tracking changes, bulk uploads, and more. With this automation, you can detect vulnerabilities and safeguard your configurations across multi-vendor environments.
Feature-in-focus: Automated Rollback
NCM regularly takes backups of device configurations, and this means multiple versions are available along with their timestamps. At any time, you can restore a previous version to roll back configuration changes. It also sends real-time alerts to administrators when any configuration changes are made.
Why do we recommend it?
SolarWinds Network Configuration Manager scans a network and identifies all devices. It then enables the network manager to create a standard setup for each type of device and then roll that out. Those authorized configurations are stored by the Network Configuration Manager and then the tool performs constant checks on devices. If any changes occur to settings, the system automatically restores the standard configuration by applying the stored image.
The configuration manager rolls out the standard configurations that you write into the central dashboard. This standardization should fix a lot of the problems that you experience on your network because it will wipe out inappropriate settings for network devices, such as routers and switches that might be slowing down data transfers. Once the standard configurations have been stored, they can only be changed through the password-protected dashboard of the Network Configuration Manager.
This system configuration troubleshooter is an important security tool. Unauthorized intruders can be traced or blocked through the network devices of the network, so altering settings is a common intrusion strategy. The Network Configuration Manager constantly monitors the configurations of all network devices and automatically restores the authorized settings, stored as images, should any change be detected.
SolarWinds produces a range of IT whole infrastructure monitoring and network management tools, and many of these are created on a common platform, called Orion. This makes it possible for the independent tools to interact, and the Network Configuration Manager is one of these Orion-based utilities. The central network monitoring tool in the suite is the Network Performance Monitor and this is usually the lead utility in any monitoring system, which is complemented by the Network Configuration Manager. However, SolarWinds NCM can also be used as a standalone tool.
Who is it recommended for?
This is an on-premises package for Windows Server. There isn’t a scaled down version for small businesses. So, the Network Configuration Manager would be suitable for larger businesses.
Pros:
- Blocks Hackers: A security service to block network device tampering
- Switch Management: Allows all configurations to be standardized
- Physical Intrusion Detection: Scans for all devices, spotting rogue equipment
- Uptime Monitoring: Continuous network device availability tests
Cons:
- Runs on Windows Server: No Linux version
The Network Configuration Manager is a paid tool. However, SolarWinds makes it available on a 30-day free trial.
5. Obkio
Best for: SaaS-based traffic diagnostics
Relevant for: Network engineers, IT teams, MSPs, and remote support teams.
Price: Starts at $499/month.

Obkio is a network performance monitoring tool designed to help businesses troubleshoot and diagnose network issues in real time. Its distributed agent-based system monitors the network from multiple locations, providing in-depth insights into network performance metrics such as latency, jitter, packet loss, and bandwidth usage. Obkio is equipped with diagnostic tools that enable IT teams to pinpoint network bottlenecks, slowdowns, and other performance issues quickly and effectively.
Obkio’s key features
- Distributed Monitoring Agents: Deploys monitoring agents at various points in the network.
- Hybrid Monitoring: Real-time visibility into internal, cloud, and external network paths.
- Quality of Service Monitoring: Latency, jitter, and packet loss tracking.
Unique buying proposition
Obkio is an agent-based SaaS platform that uses synthetic traffic to test performance across LAN, WAN, VPN, SD-WAN, Cloud, and SaaS networks. It is easy to deploy and can be up and running in a few minutes. Its actionable insights and timely alerts are helpful for IT teams to troubleshoot issues quickly.
Feature-in-focus: Visual Traceroute
One of the standout features of Obkio is its visual traceroute capabilities. This is a built-in feature that continuously maps network paths and overlays performance metrics like jitter, packet loss, and latency on the maps. Such a visual representation speeds up troubleshooting.
Why do we recommend it?
We recommend Obkio because it excels in real-time network troubleshooting and diagnostics, providing an easy-to-use yet powerful platform for identifying and resolving network issues. Its path analysis tools offer visibility into network performance, making it simple to trace problems, whether they originate within the local network or in external services like ISPs or cloud providers.
Obkio supports network troubleshooting with a focus on real-time monitoring of key performance indicators like packet loss, latency, and jitter. The system uses distributed monitoring agents that are deployed at various points in the network. This setup allows IT teams to get real-time insights into specific segments of the network, helping them diagnose issues like bandwidth congestion or ISP-related slowdowns.
The network path analysis feature is particularly useful for diagnosing complex issues, as it visualizes the entire path data takes between locations. By mapping the network paths, IT teams can easily see where performance degradations occur, whether the problem is on the internal network, a specific router, or an external service provider. This end-to-end visibility helps ensure that issues are accurately pinpointed and quickly resolved.
Another strength of Obkio is its historical reporting, which allows IT administrators to review past performance trends. This is particularly beneficial when diagnosing recurring issues, as it enables teams to compare current and historical data to identify patterns or long-term degradations. Obkio’s automated alerting system ensures that administrators are notified when performance issues arise, enabling them to take immediate action.
Who is it recommended for?
Obkio is ideal for IT teams that need a reliable, real-time network monitoring and troubleshooting tool to manage and optimize network performance. It is particularly suited for organizations running performance-sensitive applications like VoIP, video conferencing, or cloud-based tools, as well as businesses with multiple locations that need to monitor performance across distributed networks.
Pros:
- Network Path Analysis: Visualizes the network path, helping identify the exact location of bottlenecks and performance degradation.
- Automated Alerts: Sends proactive alerts when performance thresholds are breached.
- Historical Data Reporting: Stores historical network data, allowing teams to compare past performance trends and diagnose recurring problems.
Cons:
- Limited to Network Monitoring: No network management features like configuration management.
Obkio is a highly effective tool for network troubleshooting and diagnostics, offering real-time insights into performance issues through its distributed agent-based monitoring. With features like packet loss detection, network path analysis, and historical data tracking, it excels at helping businesses quickly diagnose and resolve network problems. This is a SaaS package and you can examine it with a 14-day free trial.
6. N-able N-sight
Best for: All-in-one monitoring for MSPs.
Relevant for: MSPs, remote support teams, and helpdesk technicians.
Price: Starts at $99/month.
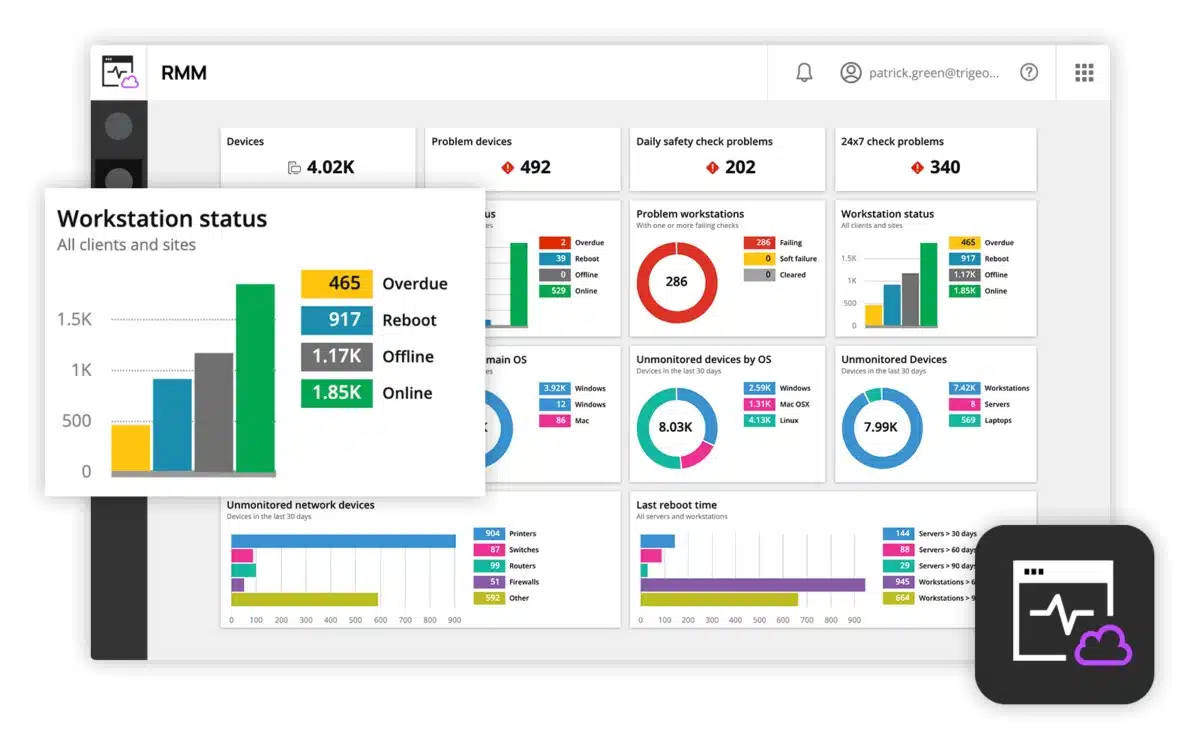
N-able N-sight is a cloud-based remote monitoring and management software package. As this system monitors the network, it also stores metrics for analysis. Having access to all aspects of a system, including endpoints and servers, N-able has many channels of data for diagnostics and troubleshooting.
N-able N-sight’s key features
- An RMM Package: Monitoring and system management features
- Automated Network Monitoring: Reduces technician wage bill
- Full Stack Observability: Networks, servers, and software
- Unattended Monitoring: Alerts for performance problems
Unique buying proposition
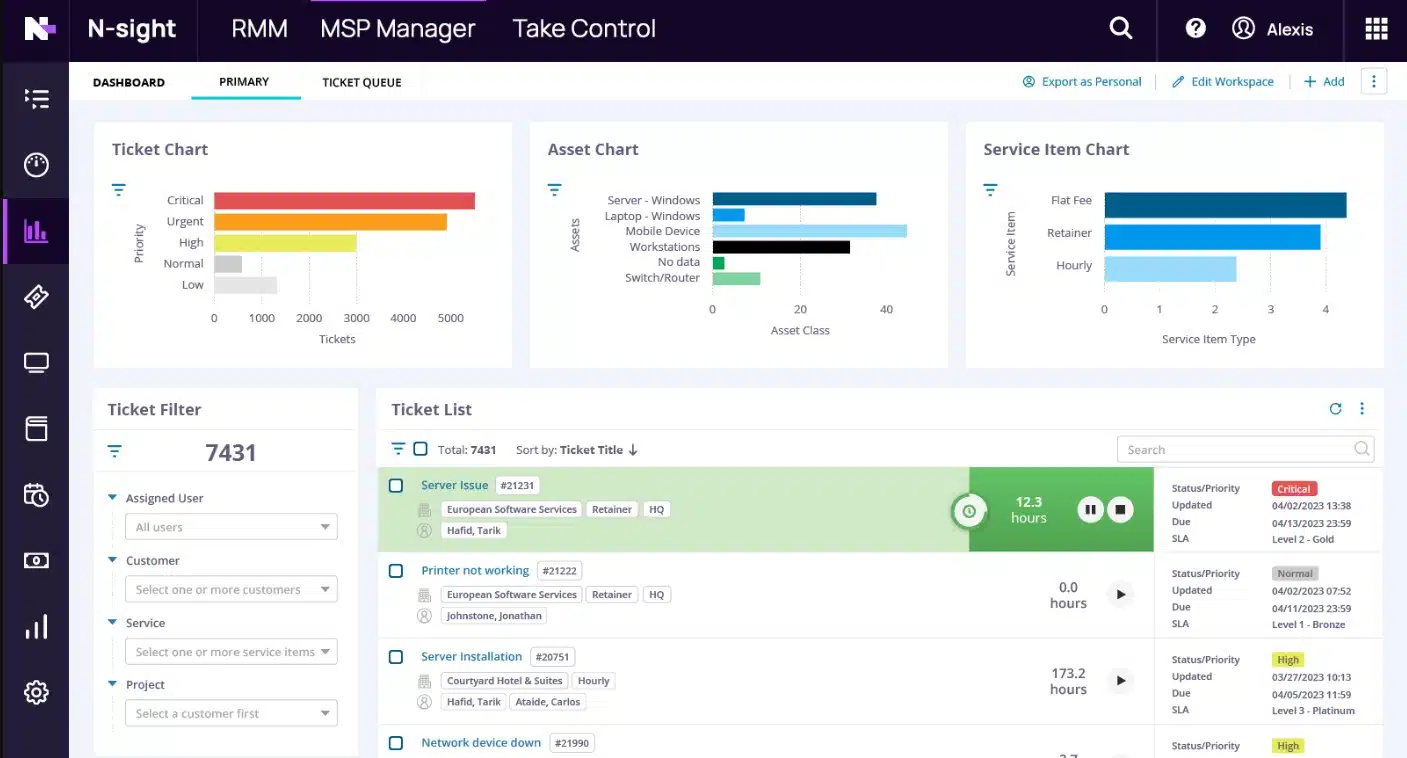
This is a unified RMM platform that brings together multiple capabilities, like real-time network monitoring, endpoint management, automation, patching, ticketing, and billing, all through a single console for easy tracking and management. It works well across remote sites and hybrid environments as well.
Feature-in-focus: Network Discovery
N-sight takes a unique approach to network discovery and mapping. It uses a built-in Discovery Agent that scans subnets once every few minutes or seconds based on the configuration to report the status of connected devices. It can also provide detailed information about each asset, including its dependencies.
Why do we recommend it?
N-able N-sight is a cloud-based service that provides remote monitoring systems for networks, servers, and applications. This service includes a troubleshooting guide that identifies security problems and other issues with networks, endpoints, and software.
Among the benefits offered by N-able N-sight is a service called LOGICcards. This is a data source for a wide range of diagnostic projects. The main value of these feeds lies in security. However, they also give insights into how to improve efficiency and avoid system management mistakes.
LOGICcards gathers data from 5,000,000 endpoints on 4,000,000 networks. Comparing the data extracted from these studies, the LOGICcard system analyzes a network and is able to point out factors and settings that are missing from that system, compared to the organization of the majority of other networks.
Another LOGICcard service is a feed of warnings to look out for, such as patches that cause problems and should be held off or new internet-based scams. A guidance aspect to this service also identifies errors to avoid in network configuration and tips on how to optimize bandwidth usage. Furthermore, the topics covered by a LOGICcard feed adapt according to your responses to past advice.
The dashboard for N-able N-sight is resident on the cloud. It doesn’t require any special equipment to use the service – any standard web browser will do and there is also a N-able N-sight mobile app available.
Who is it recommended for?
The N-able brand produces tools for managed service providers (MSPs). The company has two remote monitoring and management (RMM) tools and N-able is one of those. N-able is marketed as a suitable package for small and mid-sized MSPs.
Pros:
- SNMP-Based System: Network device discovery and constant performance monitoring
- Multi-Tenanted Architecture: Designed for use by managed service providers
- Technician Efficiency Optimization: Task automation scripts
Cons:
- Device Management Shortfall: No network configuration management
N-able N-sight is a subscription service. This is a great attraction for startups because there are no upfront costs for getting set up. There are no setup fees and there is no need to fork out for a software package Instead, the subscribing company pays a little each month. Interested potential customers can access a 30-day free trial of N-able N-sight.
7. Datadog Network Performance Monitoring
Best for: Application-based insights.
Relevant for: Cloud-native engineering teams, DevOps, and SREs responsible for managing microservices and hybrid environments.
Price: Starts at $15 per host per month.

Datadog is a cloud-based monitoring system for IT resources that is available as a menu of modules. The base package of the service is an Infrastructure module that covers network monitoring. However, this service can be enhanced by adding on the Network Performance Monitoring module.
Datadog Network Performance Monitoring’s key features
- Network Traffic Monitor: Measures throughput per link
- Connection Testing: On the network and across the Internet
- Live Traffic Flow: Visualizes speed per link
- Bottleneck Identification: Spots traffic chokepoints
- Protocol Analysis: Identifies the top talkers
Unique buying proposition
This tool is well-suited for complex environments with distributed traffic, as it converts this data into actionable insights for further processing and decision-making. It also integrates well with logs and metrics to provide a unified view of your environment. All these aspects make it easy to pinpoint the root cause of issues.
Feature-in-focus: Auto-discovery and Mapping
A highlight of this tool is its Network Map, which can provide a visual representation of traffic flow between endpoints. It dynamically changes the map based on the traffic changes, and this helps to address issues like latency or connectivity issues between endpoints.
Why do we recommend it?
Datadog Network Performance Monitoring is a SaaS package that provides device discovery, network mapping, and traffic analysis. This tool can be slotted together with a Network Device Monitoring service to get full, automated network monitoring. Infrastructure and application monitoring tools on the platform provide the opportunity to create a full-stack monitoring system.
The Network Performance Monitoring module of Datadog adds on analytical functions to the Infrastructure package and includes capacity planning and troubleshooting utilities. While the Infrastructure module looks at device statuses, the Network Performance Monitoring service examines traffic flows.
The Datadog system uses agent software on-site, but all processing and data storage is implemented on the Datadog server. Systems administrators access the Network Performance Monitoring console through any browser in order to see live statistics on current traffic flows on the network. Given that the service is based in the cloud, it can easily monitor remote networks, just as long as that network has the agent module installed on it.
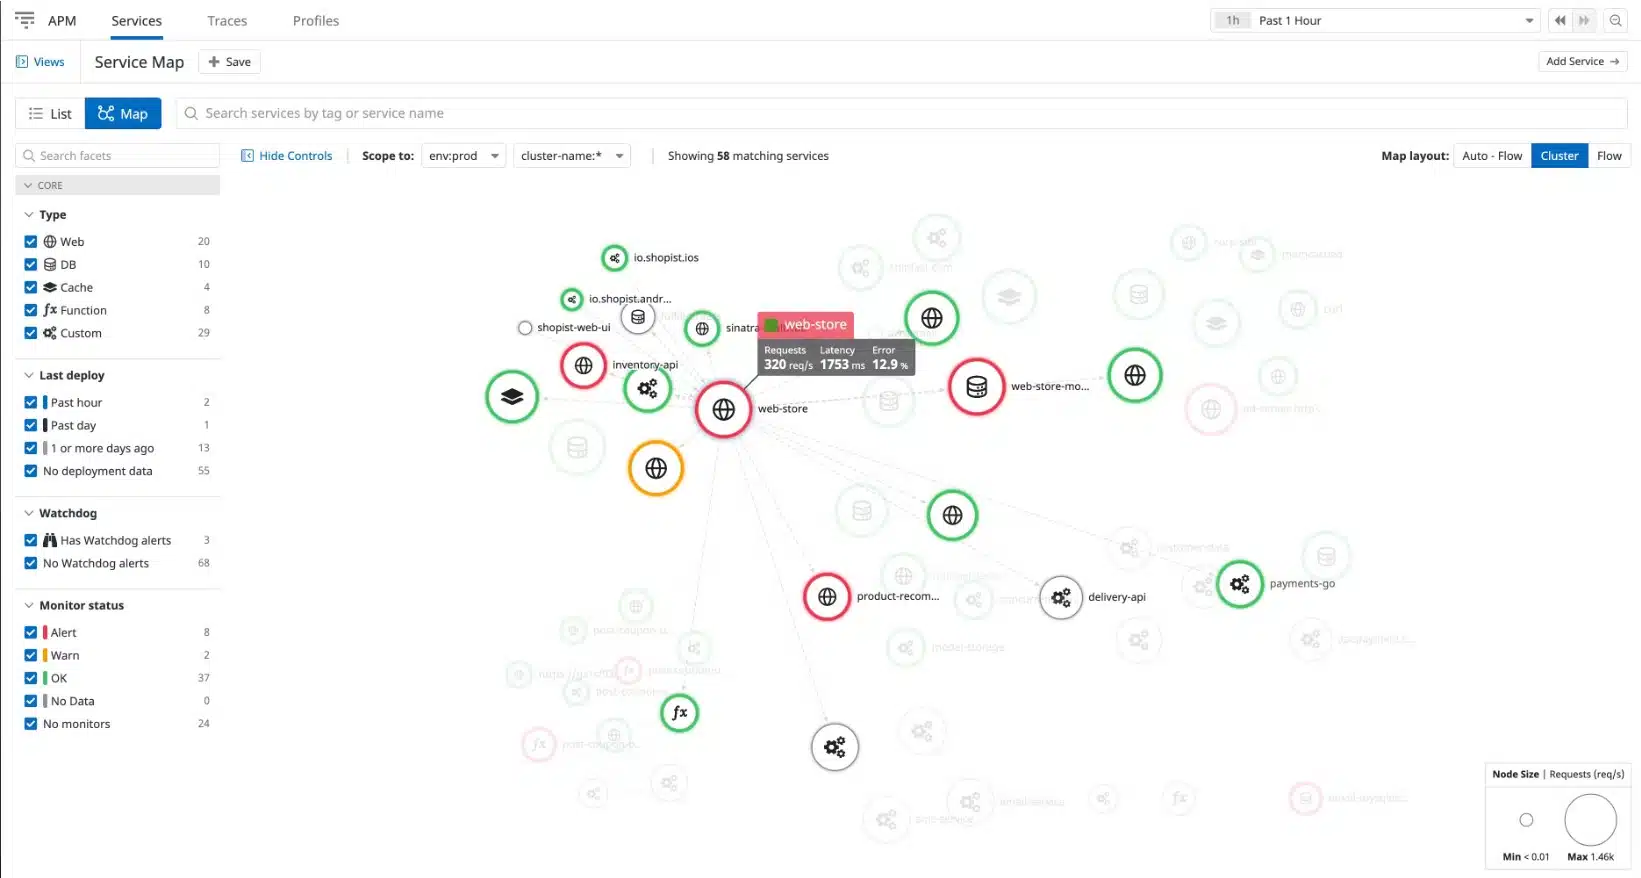
The service doesn’t just display live network traffic data. It also stores that information for analysis. Administrators can trace the journey of a packet, view conversations between endpoints, segment traffic statistics per application or per origin or source, and identify the major bandwidth hogs on the network. The service can unify both onsite, cloud-based, and remote networks to give a complete picture of all network traffic generated by the business. The tool includes live network maps with traffic flows shown on them and it is also possible to see overloaded links or bottlenecks.
Who is it recommended for?
Datadog Network Monitoring is reasonably priced and so accessible to any business. The service is charged for by subscription and there is no setup fee. Charges are levied per host, so even the smallest business will be able to afford this package.
Pros:
- Network-Wide Performance Tracking: Live throughput volumes
- Equipment Assessments: Examine load balancer and firewall performance
- Services Tracking: Assess DNS accuracy and availability
- Time-Series Traffic Throughput Graphs: Identify the causes of traffic surges
- Automated Monitoring: Alerts for delivery delays
Cons:
- Doesn’t Include Discovery: Requires a subscription to Datadog Infrastructure
Datadog has a single plan level for its Network Performance Monitoring module. Charges are levied per host per month with a discount for paying annually in advance. The service is available for a 15-day free trial.
8. Ping
Best for: Simple tool for latency checks.
Relevant for: Home users and IT administrators of small businesses who want to improve the speed of network connectivity.
Price: Free
Ping is the ideal command to use when you need to confirm network connectivity, at the IP level, between two hosts, or to confirm the TCP/IP stack is working on your local machine. A successful ping confirms network connectivity between the two hosts and it also gives reports on packet loss.
Ping’s key features
- Availability Monitoring: Connectivity test
- Connection Quality: Jitter indicators
- Connection Speed: Roundtrip time
Unique buying proposition
Ping is a built-in command-line tool available in every major operating system. Typically, it sends ICMP Echo requests to check if a host is reachable. Also, it measures the time taken by each packet to travel, and the ensuing packet loss and bandwidth usage. All these metrics can help with identifying and troubleshooting issues.
Feature-in-focus: RTT Analysis
A highlight of this is its Round-Trip-Time (RTT) analysis that confirms the reachability of devices. Using the minimum, maximum, and average RTT values, administrators can diagnose connectivity issues, latency problems, and even packet drops.
Why do we recommend it?
Ping is built into every operating system and it is the basis of many of the network monitoring and troubleshooting systems on this list. The utility can tell you the time a packet takes to get to a specific destination across a network or across the internet. It will also give you information on jitter and packet loss.
Using Ping with Examples
Below is an example of a successful run of the ping command to the “google.com” remote host.
C:\Users>ping google.com

Pinging google.com [172.217.9.46] with 32 bytes of data:

Reply from 172.217.9.46: bytes=32 time=38ms TTL=56

Reply from 172.217.9.46: bytes=32 time=12ms TTL=56

Reply from 172.217.9.46: bytes=32 time=14ms TTL=56

Reply from 172.217.9.46: bytes=32 time=12ms TTL=56

Ping statistics for 172.217.9.46:

Packets: Sent = 4, Received = 4, Lost = 0 (0% loss),

Approximate round trip times in milliseconds:

Minimum = 12ms, Maximum = 38ms, Average = 19ms
In addition to confirming IP connectivity to “google.com”, these results confirm that we are able to properly resolve domain names (i.e. DNS is working on the local machine).
That Loss figure that you see in the last line of the ping output is the number of lost packets followed by the packet loss rate in brackets.
A few pro-tips for working with the ping command for advanced troubleshooting:
- Use
ping –tto ping a host continuously. For example:
ping –t google.comwould continue to ping google.com until the ping was interrupted. Press control-c (the “CTRL” and “C” keys) to end a continuous ping.
- If you cannot ping domain names like google.com, but you can ping IP addresses on the Internet like 8.8.8.8 (Google’s DNS servers), you may have a DNS-related problem.
- If you cannot ping IP addresses on the Internet like 8.8.8.8, but you can ping hosts on your Local Area Network (LAN), you may have a problem with your default gateway.
- You can use “ping localhost”, “ping::1”, or “ping 127.0.0.1” to test the TCP/IP stack on your local machine. “localhost” is a name that resolves to one of the loopback addresses of a local machine, “::1” is an IPv6 loopback address, and “127.0.0.1” is an IPv4 loopback address.
Who is it recommended for?
Ping is a part of every network engineer’s toolkit. It is free to use and provides quick answers.
Pros:
- Familiar to Many: Commonly-used network tester
- Cost Saver: Free to use
- Variants Available: Provide repeated tests or range tests
Cons:
- Basic Display: A command line tool without graphics
9. Tracert
Best for: Path tracking and hop-based analysis
Relevant for: Individuals, network engineers, IT teams, and anyone else who wants to check routing between endpoints.
Price: Free
Tracert is similar to ping, except it leverages Time To Live (TTL) values to show how many “hops” there are between two hosts. This makes it a helpful tool in determining where a network connectivity breakdown is occurring. Basically, tracert helps you understand if the router or network that is down between your computer and a remote host is one you control or not.
Tracert’s key features
- Traceroute: Implemented as the tracert command
- Path Tests: Exploits the Border Gateway Protocol
- Local and Global Tests: Network or internet testing
Unique buying proposition
Traceroute or tracert provides information about every hop from the source to the destination. Specifically, it shows where each packet is delayed, dropped, or blocked, so you can monitor those devices. Since it comes built into Windows and other operating systems, no additional installations are needed.
Feature-in-focus: TTL-based Hop Discovery
A highlight of Traceroute is that it sends packets by increasing the Time-to-Live (TTL) values. The first packet has a value of 1, which means it expires at the first router. Next, it sends another packet with a TTL value of 2, which reaches the second router. This incremental sending makes it easy to isolate which router is causing issues.
Why do we recommend it?
Tracert is the Command Prompt implementation of TraceRoute and it provides a list of nodes across the internet to a given destination. While this can’t tell you the exact path that previous transmissions have taken, it follows the path that routing algorithms currently use to reach a destination and shows the transmission times to each node.
Using tracert with examples
Again using google.com as an example, we can see there were 10 hops between our PC and google.com.
C:\Users>tracert google.com

Tracing route to google.com [172.217.4.78]

over a maximum of 30 hops:

  1    1 ms   1 ms 3 ms  192.168.1.1

  2  246 ms    49 ms 56 ms  10.198.1.177

  3   58 ms    48 ms 54 ms  10.167.184.102

  4   63 ms    55 ms 85 ms  10.167.184.107

  5   50 ms    55 ms 56 ms  10.164.72.244

  6   72 ms   365 ms  69 ms 10.164.165.43

  7   92 ms    61 ms 45 ms  209.85.174.154

  8   67 ms    42 ms 58 ms  108.170.244.1

  9  372 ms    66 ms 46 ms  216.239.51.145

 10    64 ms  73 ms 44 ms  lga15s47-in-f78.1e100.net 172.217.4.78]

Trace complete.
Who is it recommended for?
TraceRoute is available on all operating systems. While it is implemented by the tracert command on Windows, it is called traceroute on Linux, macOS, and Unix. The tool is free to use and accessible to all network managers.
Pros:
- End-to-End Testing: Checks a path to a given destination
- Connection Speed: Shows transmission time to each node
- Spots Rerouting: Identifies problematic devices
Cons:
- Doesn’t Repeat History: Can’t guarantee to exactly trace a previously used path
10. Ipconfig
Best for: Interface configuration and IP diagnostics.
Relevant for: Windows users, helpdesk staff, and anyone who wants to diagnose IP/DNS issues.
Price: Free
Determining the IP settings on your computer is an essential part of network troubleshooting. The ipconfig command helps you do just that. Entering ipconfig at a command prompt will return IPv4 and IPv6 addresses, subnets, and default gateways for all network adapters on a PC. This can help determine if your computer has the right IP configuration. Additionally, ipconfig can be used to change or update selected IP settings.
Ipconfig’s key features
- Quick Command: Show interface settings
- Network Addressing: DHCP controls
- Service Tests: DNS management
Unique buying proposition
This is another built-in command-line tool that displays information about the network adapter. In particular, it provides information about IP, mask, gateway, DNS, and more. It is always available and consumes extremely small amounts of system resources, making it a handy tool for troubleshooting.
Feature-in-focus: DHCP Lease Management
Using Ipconfig, you can renew or release DHCP leases, flush the DNS cache, register a DNS, and more. When all these commands are used in the right order, they can fix common issues like “no network access”, “wrong IP or subnet”, etc.
Why do we recommend it?
Ipconfig is another widely-used free command line utility for troubleshooting networks. The tool shows the addressing information for each network interface on the computer. It will also show the gateway address and the address for the network’s DHCP and DNS servers.
Pro-tips for working with ipconfig:
- If ipconfig returns an IP address that starts with 169.254 (e.g. 169.254.0.5), your PC is likely configured for DHCP but was unable to receive an IP address from a DHCP server.
- Use
ipconfig /allto get the full TCP/IP configuration information for all network adapters and interfaces. - Use
ipconfig /releaseto release the current DHCP assigned network parameters. - Use
ipconfig /renewto renew the current DHCP assigned network parameters. - Use
ipconfig /flushdnsto clear the DNS cache when troubleshooting name resolution issues.
Who is it recommended for?
Ipconfig is free to use and already installed on your computer. On Linux, macOS, and Unix, it is called ifconfig.
Pros:
- No Cost: A free utility to show and update IP addresses
- Basic Controls: Can reset address allocations
- Service Verification: Checks on DNS records
Cons:
- Basic Display: No graphical interface
11. Netstat
Best for: Live socket and connection inspection
Relevant for: Network engineers, sysadmins, developers, and anyone who wants to check open ports and live connections.
Price: Free
Netstat allows you to display active connections on your local machine. This can be helpful when determining why users are unable to connect to a given application on a server or to determine what connections are made to remote hosts from a computer. Entering netstat at the command prompt will display all active TCP connections. Adding parameters to the netstat command will extend or alter the functionality.
Netstat’s key features
- Transmission Control: Port statuses
- Path Analysis: IP routing table
- Dual Stack: IPv4 and IPv6
Unique buying proposition
Netstat is also a command-line tool that’s available on Windows, Linux, macOS, and Unix systems. It is lightweight and uses few system resources. Moreover, it provides real-time visibility into TCP/UDP connections to provide critical information about network and device performance for quick troubleshooting.
Feature-in-focus: Process-aware Connection
One of the notable features of Netstat is its ability to show which processes are tied to which network sockets, and the state of the TCP connections that reach them. The advantage of this feature is that you can identify if a rogue or misbehaving process is creating network traffic.
Why do we recommend it?
Netstat lists all the connections that are currently live on the computer on which the command is run. The output show every TCP and UDP port that is currently active, even though the connection might be in a closed state.
netstat commands & example
Here are a few helpful netstat commands and what they do:
netstat –adisplays all active TCP connections and the TCP and UDP ports a computer is listening on.netstat –ndisplays all active TCP connections just like thenetstatcommand, but it does not attempt to translate addresses or port numbers to names and just displays the numerical values.netstat –odisplays all active TCP connections and includes the process ID (PID) for the process using each connection.
You can combine different parameters to extend the functionality of netstat. For example,
netstat –anowould display all active TCP connections and the TCP and UDP ports a computer is listening on, use numerical values, and report the PID associated with the connections.
Who is it recommended for?
Every network administrator will probably use this tool at some point in time. The tool is free to use and it is built into the operating system for Windows, Linux, macOS, and Unix.
Pros:
- No Cost: Free utility
- Command Line Options: Filterable results
- Constant Monitoring: Can run continuously
Cons:
- Command Line Tool: No graphical interface
12. Nslookup
Best for: Reverse lookup diagnostics.
Relevant for: Network engineers, IT support, and security teams.
Price: Free
nslookup is a useful command-line utility that enables DNS troubleshooting and diagnostics. Nslookup is available on Windows and *nix operating systems. There are a variety of use cases for this flexible utility and it can be run in interactive mode or by entering commands directly at the command prompt.
To help you get started, we’ll review some nslookup commands that are helpful in three of the most common use cases: finding an IP address based on a domain name, finding a domain name based on an IP address, and looking up email servers for a domain.
Nslookup’s key features
- Service Testing: Queries DNS records
- Basic Display: Command line tool
- No Cost: Free to use
Unique buying proposition
This is another command-line utility on our list that helps query DNS servers. It works as a single-shot query as well as an interactive one to help point to specific name servers. It supports various record types as well. Like the other command-line tools, it also consumes only a few resources and works well across multiple operating systems.
Feature-in-focus: Query-type Switching
A key aspect of nslookup is the ability to change which DNS record type you request and the DNS server to which you want to send the query. For example, you can find mail exchange servers for a domain. Also, you can do reverse lookups, where you provide an IP address instead of a hostname.
Why do we recommend it?
Nslookup is a command for DNS checks – the name is short for “name server lookup.” With this tool, you can identify the mapping between hostnames and IP addresses on a local network. By entering a remote IP address or Web domain, you can see details from the global DNS service.
Below are examples of how to do each from a Windows command prompt.
Finding an IP address based on a domain name with nslookup:
C:\Users>nslookup google.com

Server:  ns2.dns.mydns.net

Address:  192.168.247.45

Non-authoritative answer:

Name: google.com

Addresses:  2607:f8b0:4009:805::200e

       172.217.10.46
The output above shows us that the DNS server used on our local machine was ns2.dns.mydns.net and since ns2.dns.mydns.net is not an authoritative name server on Google’s domain, we get a “Non-authoritative answer”. If we wanted to specify a different DNS server in our query, we simply add the DNS server’s domain name or IP address after the command, like this (using the 1.1.1.1 DNS server from CloudFlare).
C:\Users>nslookup google.com 1.1.1.1

Server:  1dot1dot1dot1.cloudflare-dns.com

Address:  1.1.1.1

Non-authoritative answer:

Name: google.com

Addresses:  2607:f8b0:4009:812::200e

       216.58.192.174
Finding a domain name based on an IP address with nslookup
Finding a domain name based on an IP address is similar to the previous process, you simply use an IP address instead of the domain name after the “nslookup” command. For example to find out what the fully-qualified domain name (FQDN) for the IP address 8.8.8.8 is we would use the command below:
C:\Users>nslookup 8.8.8.8

Server:  ns2.dns.mydns.net

Address:  192.168.247.45

Name: google-public-dns-a.google.com

Address:  8.8.8.8
Based on the output, we can see that the FQDN associated with 8.8.8.8 is “google-public-dns-a.google.com” which makes sense given 8.8.8.8 is one of the two popular public DNS servers available from Google.
Looking up email servers for a domain with nslookup
Sometimes you may need to determine what email servers are available on a domain. To do that, we simply need to specify that we are looking for MX records using the –ty switch. In the example below, we’ll check what mail servers are returned for gmail.com:
C:\Users>nslookup -ty=mx gmail.com

Server:  ns2.dns.mydns.net

Address:  192.168.247.45

Non-authoritative answer:

gmail.com    MX preference = 40, mail exchanger = alt4.gmail-smtp-in.l.google.com

gmail.com    MX preference = 5, mail exchanger = gmail-smtp-in.l.google.com

gmail.com    MX preference = 30, mail exchanger = alt3.gmail-smtp-in.l.google.com

gmail.com    MX preference = 10, mail exchanger = alt1.gmail-smtp-in.l.google.com

gmail.com    MX preference = 20, mail exchanger = alt2.gmail-smtp-in.l.google.com
Here, five mail servers were returned along with an MX preference value. The lower the MX preference value, the higher the priority of that server (i.e. those servers should be used first).
Who is it recommended for?
Network managers would use nslookup to ensure that the local DNS server is working and also to test for DNS entry errors for Wen properties. The free tool is built into the operating system for Windows, Linux, macOS, and Unix.
Pros:
- Domain Name Resolution: Shows the domain name for an IP address
- Run for Research: Interactive mode
- Network and Internet: Local or Web domains
Cons:
- Limited Functionality: Not a full system monitoring package
13. Uptrends Uptime Monitor
Best for: Continuous website and service availability
Relevant for: SREs, DevOps, and network reliability engineers.
Price: Starts at $7.96/credit/month
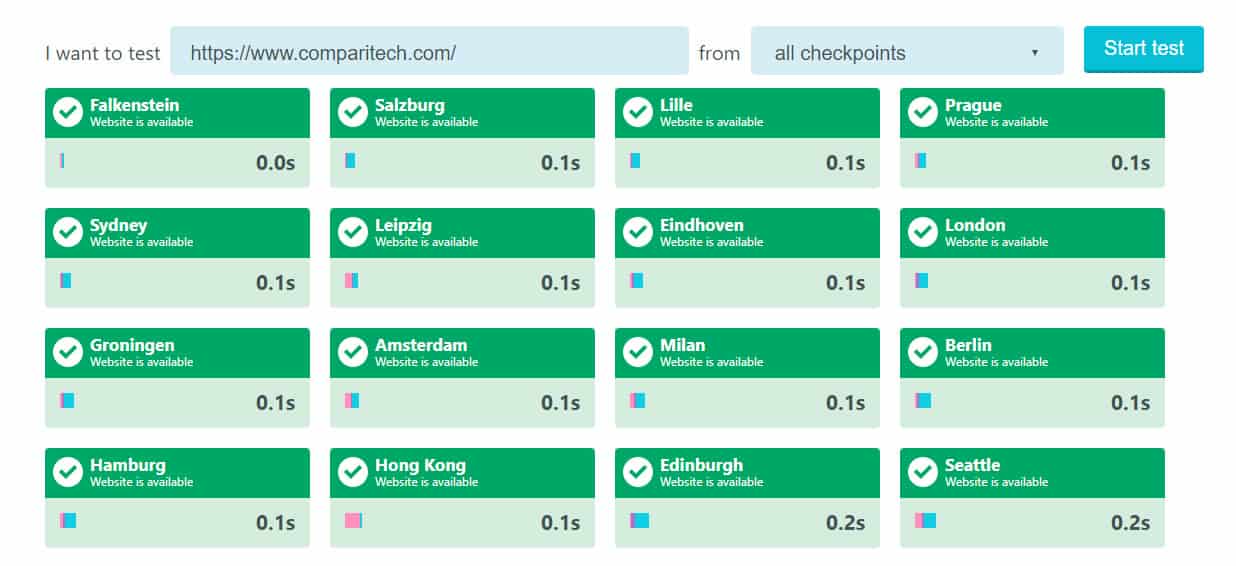
Uptrends offers a menu of website monitoring and testing services from its cloud platform. The Uptrends Uptime Monitor is a free service that can be accessed at the Uptrends website.
The free Uptime Monitor offers a choice of locations from which your site can be tested. It is possible to opt for tests to be run from all of the locations that Uptrends offers.
Uptrends Uptime Monitor’s key features
- Great for Small Businesses: Free on-demand website test
- Multiple Launch Sites: Tests from 40 locations
- Extensive Service: 233 servers around the globe
Unique buying proposition
This tool provides regular global checks of your sites, servers, APIs, SSL certificates, and more to ensure they are reachable and working as they should. It works with 233+ checkpoints around the world, making it easy to check whether the outages are global or local and to identify the exact failure location.
Feature-in-focus: False Alert Checks
A highlight of Uptrends is its ability to reduce false alerts through a double-check mechanism. This tool checks the availability of your web resources from different global checkpoints. If there’s an outage or error, it runs a check from other global endpoints to ensure that it is not a false alert. Such a mechanism improves the speed of troubleshooting and reduces unwanted noise.
Why do we recommend it?
Uptrends Uptime Monitor is a testing service for internet connections. It specifically takes a Web domain as input, so its checks also extend to DNS testing. You can use this tool for free for on-demand availability tests, which can be launched from a long list of locations. You can get the tests to run recursively every minute if you sign up for a paid account.

The free tool is an on-demand testing system and will give you the status of your site from many locations at that moment. It is possible to remind yourself to rerun the test and keep hitting the button. However, it is more practical to get the Uptrends service to repeat its tests automatically.
Uptrends provides automated testing that will launch every minute. The automated service is not free. You can leave that tool to make constant checks on your site’s availability – it will send you an alert if it encounters problems.
Who is it recommended for?
If you run a website, you will need to know if it is available, so it is worth going for the paid account. This will notify you if the site goes offline. The tests launch from different locations around the globe, which is a necessary service for websites that use caching servers for delivery speed optimization or content delivery networks.
Pros:
- Quick Uptime Check: Free single launch test
- Long-Term Uptime Monitoring: Paid repetitive availability tests
- Automated Reporting: Alerts for failed tests
Cons:
- Reporting Limits: Doesn’t provide page load speeds
The paid packages of Uptrends include internal server monitoring as well as uptime tests. You also get real user monitoring that tracks the responses of your site and its services to visitors. The system is offered in five plans: Starter, Premium, Professional, Business, and Enterprise. Each higher plan has more features. You can try all of the features of Uptrends on a 30-day free trial.
14. Sysinternals
Best for: Deep Windows system diagnostics
Relevant for: Windows sysadmins, security teams, support engineers, and network diagnostics teams.
Price: Free
The Sysinternals networking utilities suite from Microsoft offers advanced network diagnostic and troubleshooting tools to Windows administrators that require advanced network diagnostic and troubleshooting tools. The Sysinternals utilities include tools that can help troubleshoot and configure Active Directory (AD), like AD Explorer and AD Insight.
Microsoft Sysinternals’ key features
- Handy Tools: A suite of utilities
- Connectivity Tests: PowerShell Ping
- Web Research: Whois lookup
Unique buying proposition
This is a suite of free and stand-alone utilities from Microsoft that allows you to look into the internal processes of Windows systems. It can examine aspects like file or register activity, network endpoints, auto-start mechanisms, and more. They require no additional installation and can be downloaded from the Microsoft Store.
Feature-in-focus: Detailed Insights
Sysinternals supplements basic OS tools, like Netstat and Task Manager, by providing richer and more process-aware views. It even supports real-time filtering to help you find the required information quickly. In particular, its TCPView provides a live list of TCP and UDP endpoints that can help you better understand each connection.
Why do we recommend it?
Sysinternals is a large package of useful system management utilities for Windows. This is a useful free bundle of tools that are versions of systems that you can get elsewhere, such as Ping and Whois. However, it’s nice to have a package that has all of these tools in one place.
Other tools can help measure network performance (PsPing), scan file shares (ShareEnum), list or run processes remotely (PsTools), and more. If you only require one or a few of the Sysinternals utilities, you can install them separately as opposed to downloading the entire Sysinternals Suite.
Who is it recommended for?
Systems administrators will like this package, not just network managers because the bundle includes some nice utilities for managing Active Directory as well as tools to troubleshoot networks.
Pros:
- No Cost: A free package of system administration tools
- Access Rights Management: Utilities for Active Directory queries
- System Performance: Process examiner
Cons:
- Not a Full Network Monitoring Package: Only one network troubleshooting tool
15. Wireshark
Best for: Deep diagnosis of packets.
Relevant for: Network engineers, sysadmins, protocol developers, and forensics teams.
Price: Free

Wireshark is a protocol analyzer and one of the go-to networking tools for organizations of all sizes when network issues need to be troubleshot with a high level of granularity.
The benefit of using Wireshark to analyze network traffic is that you will be able to view the raw network packets, and this will often allow you to identify the root cause of an issue. This can be especially helpful in situations where it is unclear which application is not doing what it is supposed to or when you try to reverse engineer the functionality of a poorly-documented program.
Wireshark’s key features
- Traffic Analysis: Packet capture
- Data Selection: Filtering and query language
- Easy to Read: Color-coded packet display
Unique buying proposition
This is an open-source network protocol analyzer that enables users to capture and analyze live traffic. It supports thousands of protocols and shows detailed information about the headers and contents. All this information can come in handy for both reactive troubleshooting and proactive security measures.
Feature-in-focus: Dual Filtering System
A standout feature of Wireshark is its dual filtering system that can capture and display filters. The capture filters allow you to limit the packets that get saved, while the display filters show only what is needed. Using these features, you can quickly identify issues and troubleshoot them.
Why do we recommend it?
Wireshark is an iconic packet sniffer and analyzer. Any network engineering course includes a section on the use of Wireshark. This system includes its own filter language that can be applied to packet collection to reduce the large volume of data that it extracts. The same filter language can be applied to search through packet data.
The tradeoff here is that you will have a lot of data to parse through, so some technical knowledge may be required to drill down and identify the important information.
You can download Wireshark for free here.

On Windows operating systems, link-layer packet captures with WireShark are often made possible using Winpcap (either Winpcap or Npcap is required). In addition to enabling WireShark on Windows, Winpcap can enable the powerful Windump command line utility which is Windows answer to the popular tcpdump program found on many *nix operating systems. For a deeper dive on Winpcap, Windump, and tcpdump, check out our recent article on packet sniffers and network analyzers and download the tcpdump cheat sheet.
Wireshark is an excellent tool for processing packet data. However, it’s analytical features are limited. There are a number of other tools that work well with Wireshark to create an even better data analysis system. The data search system Elasticsearch is free to use and it comes with complementary modules for logfile management and data display. Together this suite is called the Elastic Stack.
The illustration below shows how the Elastic Stack can be used with Wireshark to create an improved data analysis system from components that cost nothing.

Although this setup looks complicated, all of the tools shown in this diagram are designed to work together and the Elasticsearch website includes guides on how to put this system together.
Who is it recommended for?
Any network manager that doesn’t already know about Wireshark should download it and learn it because this is an essential tool and experience in using it is career-enhancing. The tool is available for Windows, macOS, Linux, and Unix.
Pros:
- No Cost: Free to use
- Multiple OSs: Available for Windows, macOS, and Linux
- Two-Way Tracing: Can trace a conversation
Cons:
- Use with Caution: Can generate very large files
16. Nmap
Best for: Network discovery and service profiling
Relevant for: Network engineers and compliance teams.
Price: Free to use, but redistribution costs a one-time fee of $119,980.
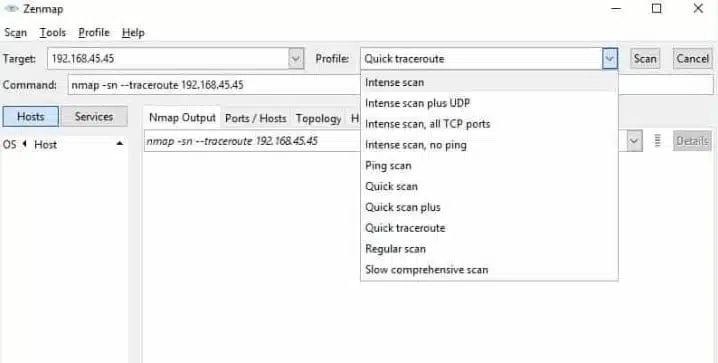
Nmap is a popular security auditing and network exploration tool released under a custom open source license based on GPLv2. While the most popular use cases for nmap are security scans and penetration testing, it can prove quite helpful as a network troubleshooting tool as well.
Nmap’s key features
- Research Tool: Network discovery
- Identification: Endpoint fingerprinting
- Security Monitor: Port scanning
Unique buying proposition
This is an open-source tool that can scan networks for live hosts, open ports, and services like version detection. It can also guess OS types through fingerprinting. It handles large networks and works well across IPv4 and IPv6 networks.
Feature-in-focus: Nmap Scripting Engine (NSE)
NSE is a highly useful feature as it uses the Lua script to detect vulnerabilities and outdated versions that can lead to security issues. It can also be used to check if ports are filtered or closed, and even bypass common filtering rules if required. Additionally, it can also give deep diagnostics.
Why do we recommend it?
Nmap is another classic that has a long history and so has a lot of fans. It is known to be used by hackers as well as network managers to explore a network and discover all devices. The tool is a command line utility and is a little difficult to use. Get the GUI Zenmap add-on to see a graphical network map.
For example, if you are dealing with an unfamiliar app and want to find out what services are running and which ports are open, nmap can help. Nmap itself uses a command-line interface (CLI), but that doesn’t mean you are out of luck if you prefer a graphical user interface (GUI). Zenmap is the official nmap GUI and is a good way for beginners to start working with nmap.

Who is it recommended for?
Nmap doesn’t just map a network, it also performs monitoring. It can be a good tool for checking on all devices, spotting rogue devices, and identifying those that are offline. The tool is free to use. However, getting the free PRTG gives you a much better discovery and mapping service than Zenmap and Nmap offer.
Pros:
- Network Management Service: Useful for security auditing
- Issue Investigations: Network probing and troubleshooting
- Service Verification: DNS searching
Cons:
- Command Line Tool: Needs Zenmap for a graphical display
For more on Zenmap and a deeper dive on nmap, check out our Best Free Port Checkers article.
Choosing a network diagnostics & troubleshooting tool
The tools we discussed here are great to have in your network troubleshooting toolbox and we recommend giving some of them a try the next time you find yourself dealing with a head-scratching network troubleshooting scenario. Did you try out our Editor’s choice – Paessler PRTG? Did we leave any of your favorite network troubleshooting tools out, or do you have questions about the tools we mentioned here? Let us know in the comments section below.
Related post: PingPlotter Alternatives
Our methodology for choosing network troubleshooting and diagnostics tools
While building our list of the best network troubleshooting and diagnostics tools, we evaluated them based on how effectively they help network administrators identify, isolate, and resolve issues. Other factors that we considered are:
1. Comprehensive Coverage
One of the first things we looked at was the coverage. Can the tool monitor a wide range of devices and applications? Does it provide wide visibility into the environment? These answers helped us narrow down tools with the maximum coverage and visibility.
2. Root Cause Analysis
We looked for tools that help administrators trace problems to their source by correlating performance data, device status, network paths, and traffic activity. Tools that came with intuitive dashboards and charts for easy understanding of the metrics and their relationships scored higher.
3. Network Path and Connection Analysis
Along with the root cause, we also prioritized tools that provide route analysis, latency measurements, path visualization, and connection testing to help identify where communication problems occur. This was a critical factor for us because, in our experience, many connectivity problems occur between endpoints rather than on individual devices.
4. Alerts and Notifications
We gave preference to tools that identify abnormal network conditions automatically and notify administrators before users begin reporting widespread issues. Platforms that could send alerts in real time and across multiple channels ranked at the top.
5. Historical Data Interpretation
Network problems are not always active when troubleshooting begins, and sometimes, they are also hard to replicate. To help administrators understand these situations, we looked for solutions that retained historical performance data, diagnostic results, and event records. Such information is handy for capacity planning and long-term forecasting as well.
Broader B2B software selection methodology
Along with the above factors, every review goes through our standard B2B review methodology process, where we evaluate each tool against the following criteria.
- Quality of vendor support
- Usability
- Scalability
- Pricing transparency
- User reviews
- Application to real-world use cases.
Check out our detailed B2B software methodology page to learn more.
Why Trust Us?
We are committed to producing software reviews that are objective, transparent, and backed by thorough research. To provide objective and useful information about each product, we evaluate platforms using a consistent methodology that focuses on the capabilities needed to solve real IT challenges. Our editorial content is unbiased and independent.
Network Diagnostics & Troubleshooting FAQs
What are the six steps of the troubleshooting process?
Follow a formalized routine when troubleshooting networks:
- Identify the problem.
- Make an educated guess of the possible cause of the problem.
- Explore the system to check whether your idea is valid.
- Identify system elements in error; plan and implement remediation steps.
- Check that the solution worked and change procedures to prevent the problem from happening again.
- Document the problem, the solution, and recommendations for procedural change.
Steps 2 and 3 might need to be carried out recursively until you hit the problem. The documentation step is ongoing throughout the troubleshooting process with note-taking to contribute to an accurate record once the entire process is complete.
What causes intermittent network connection issues?
There are many possible causes for intermittent network connection issues:
- Unreliable power source
- Environmental interference
- Queueing on a network device
- A network device overloaded
- A faulty network device
- IP address renewal
- IP address duplication
- DNS server errors
- Firewall software hanging
- Network software jamming
- Hacker attack
- Automatic update of firmware taking a device offline
- Interruption of external networks, e.g., the internet
- Loose cable plug in an endpoint or network device
- Damaged network cable
- Loose wiring
- Multiple domain server clashes
- Lack of storage space on devices for traffic processing or logging
- Security software blocking activity
Which utility or LAN command do you feel was the most useful for network troubleshooting?
Ping and Traceroute are the two LAN commands most often used for network troubleshooting. Ping shows whether an endpoint is contactable. Traceroute shows the most likely path to that endpoint. These two commonly used network utilities are usually integrated into most network monitors.
What are the most common issues that affect network performance and reliability?
The most common issues that affect network performance are:
- Power source problems
- Network device faults
- Network cable faults
- Defective cable connectors
- System overloading
- QoS prioritization
- Incompatible network settings on different devices
- Addressing issues
- Security software
- Hacker or intruder activity
- Malware

I know this was written a few months ago, but what do you think of PingPlotter Pro? Why did it not make the list of best network troubleshooting software?
Just curious . . .
Hi Ben,
Thanks for the reply. The simple answer is: I’ve never used PingPlotter Pro. Topically, it looks like a useful monitoring tool that can also have some troubleshooting benefits. What use cases do you think it is best for?