

Keeping a computer network up and running—especially in a Linux environment, takes some skills
A network or system administrator needs to have the right skills required to manage and maintain a network. One of such skills is an excellent hands-on knowledge of network troubleshooting. There are times when troubleshooting will account for more than seventy percent of a network administrator’s time. Fortunately, network diagnostic tools can enable you to quickly resolve issues during those crisis times and keep your network operating as designed.
Here is our list of the best Linux network troubleshooting tools:
- Site24x7 Linux Monitoring EDITOR’S CHOICE This unit on a cloud platform provides activity monitoring for the operating system that also tracks processor availability and usage and can identify the causes of performance problems. Get a 30-day free trial.
- ManageEngine OpManager A highly scalable Linux network monitoring tool. It can monitor Linux devices and traffic in your network for availability, health, and performance in real-time and generate network performance reports.
- Ping A network troubleshooting tool used to test the reachability of a host on an Internet Protocol (IP) network.
- IP command tool Found in the net tools which are used for performing several network administration tasks.
- NSLookup A network administration command-line tool for querying the Domain Name System (DNS) to obtain the mapping between a domain name and IP address.
- Domain Information Groper (Dig) A network administration command-line tool for querying the DNS. Dig is useful for network troubleshooting and educational purposes.
- Ethtool A tool used for troubleshooting in a Linux network. It is primarily used to query and control Ethernet devices, including driver and hardware settings on Linux systems.
- PuTTY A free and open-source terminal emulator, serial console, and network file transfer application.
- Traceroute A tool in Linux that allows you to investigate the routes of network packets and identify the limiting factor in their journeys.
- Route The route command is used to view and make changes to the kernel routing table on Linux, BSD, and other Unix-like systems.
- NETCAT and NCAT A tool for reading from and writing to network connections using TCP or UDP. It is a feature-rich network troubleshooting and investigation tool.
A good understanding of those troubleshooting tools serves as an advantage. In addition, Linux supports lots of useful command-line tools that can help you narrow down to the root cause of a network issue. This article will explore the ten best Linux network troubleshooting tools to help you when things don’t seem to work.
The Best Linux Network Troubleshooting Tools
Our methodology for selecting Linux network troubleshooting tools
We reviewed the market for Linux network troubleshooters and analyzed tools based on the following criteria:
- A software package for Linux or one that can contact Linux machines across a network
- Live network monitoring
- Analysis tools
- Log collection and management
- Connection testing tools
- A way to test the system for free or a free tool
- Good value for money, represented by a free tool worth using or a paid system that is reasonably priced
With these selection criteria in mind, we selected a range of tools, many of which are free, that can form your troubleshooting toolset.
1. Site24x7 Linux Monitoring (FREE TRIAL)
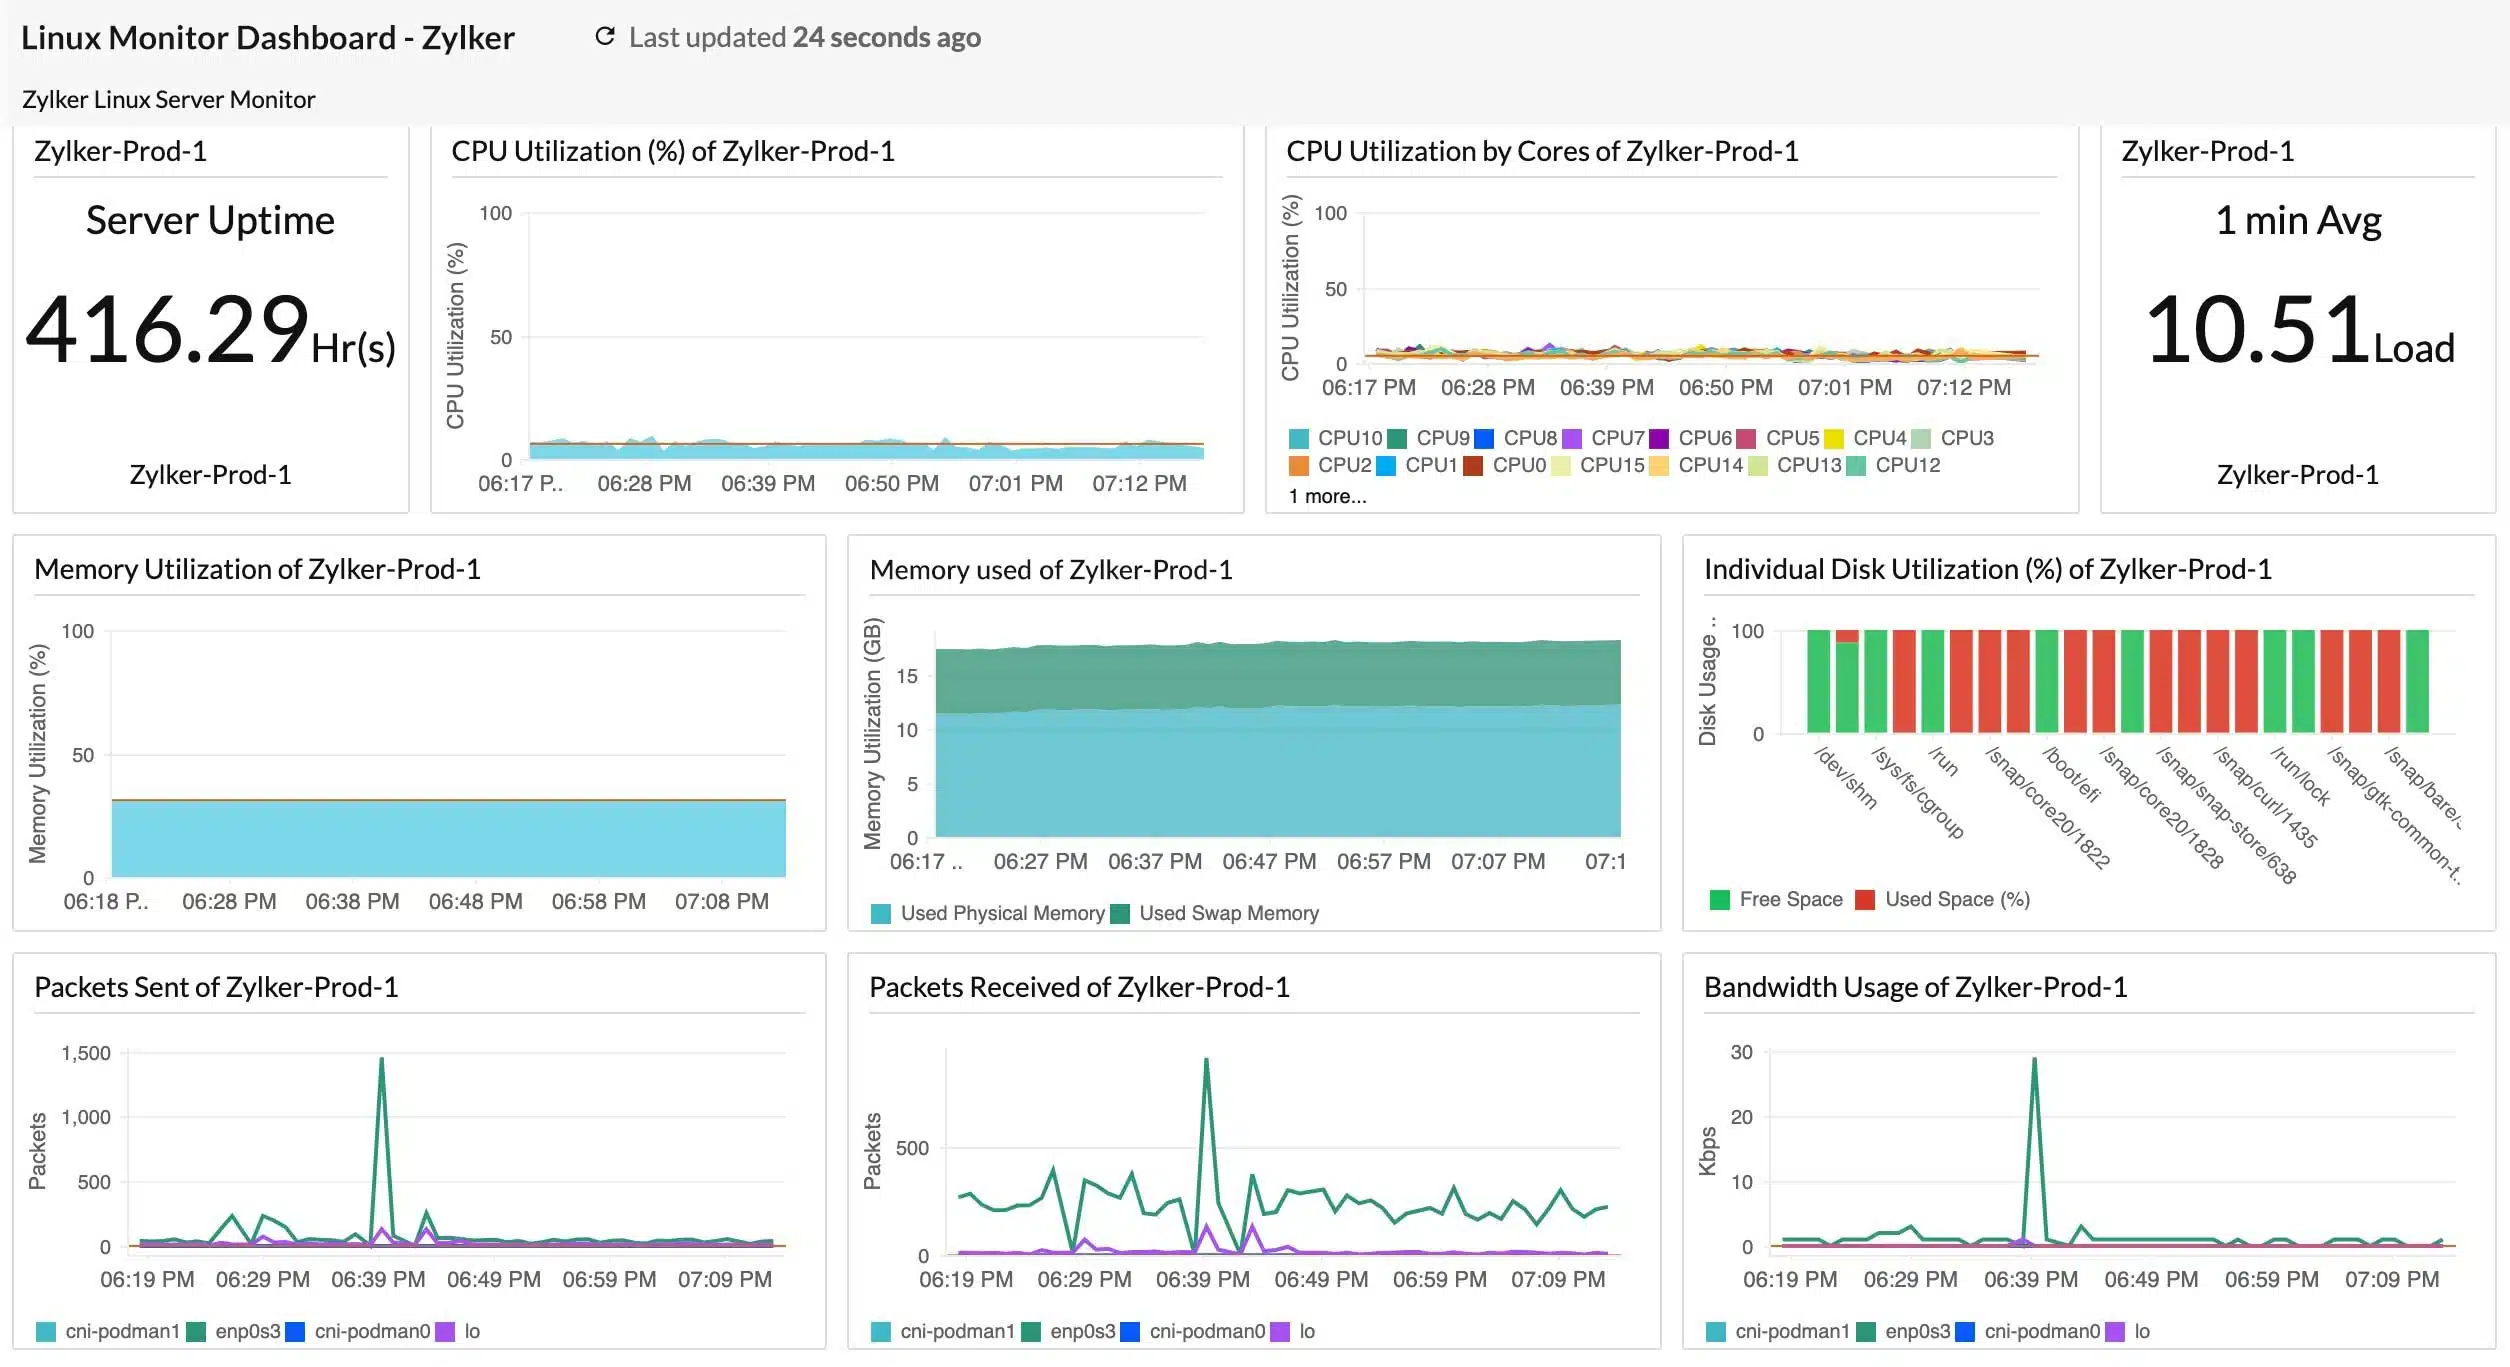
Site24x7 Linux Monitoring is a facility on a cloud platform of system monitoring and management tools. The Linux monitoring system is delivered from the cloud and implemented through the installation of an agent on one of your servers. That agent also gathers data from network and application monitoring.
Key Features:
- Real-Time Monitoring: Tracks CPU load, memory usage, disk activity, and live server processes, providing a real-time overview of your system’s health.
- Historical Data Collection: Records metrics over time for trend analysis, enabling you to identify potential issues before they become critical.
- Syslog Management: Centralizes and analyzes system logs, simplifying troubleshooting efforts.
- Container Monitoring: Extends monitoring capabilities to containerized environments, ensuring visibility into container health.
- Broad Distribution Support: Interfaces with all major Linux distributions, offering wide compatibility.
- Cloud-Based with On-Premise Agent: Operates from the cloud for centralized management, while using an on-site agent to gather data from your Linux servers.
- Resource Monitoring and Alerting: Measures CPU, memory, and disk activity, and triggers alerts when resource exhaustion is imminent.
- Root Cause Analysis: Assists in identifying the root cause of performance issues, streamlining troubleshooting processes.
Why do we recommend it?
Site25x7 Linux Monitoring is able to interface to just about every distribution of Linux, so it is able to implement the commands of the operating system right down to the specific syntax of the Linux flavor on your computer. The main focus of the Linux monitor is actually the computer and its resources rather than the operating system.
The Linux Monitoring feature is really a host monitor that is able to interface with the Linux operating system in order to extract performance statistics from the computer. The same platform offers Windows Monitoring.
The Linux Monitoring system includes Syslog management, which you can use to construct your own analysis system and also store Syslog records in files over time, which can be used for capacity planning and root cause analysis.

Who is it recommended for?
Any business that runs Linux on its computers will need the Linux Monitoring service of Site24x7. The platform provides Linux monitoring as part of its server monitoring feature and you can just as easily use the system’s Windows monitoring system on your PCs and computers running Windows Server.
Pros:
- Centralized Monitoring: Offers a central dashboard for monitoring multiple Linux servers, simplifying management.
- Real-Time and Historical Insights: Provides a combination of live system status and historical data for comprehensive analysis.
- In-Depth Monitoring Capabilities: Goes beyond basic metrics to include container monitoring, syslog management, and root cause analysis.
- Cloud-Based Convenience: Cloud-based operation offers easy access and scalability.
Cons:
- Not Standalone Service: Requires integration with the broader Site25x7 platform, potentially leading to additional costs.
- Reliance on On-Premise Agent: While the cloud offers convenience, the dependence on an on-site agent for data collection might add complexity for some users.
Site24x7 provides monitoring services for networks, servers, and applications and it bundles all of its services into plans. The Linux Monitoring unit is included in all plans. There is also an edition for managed service providers. You can examine the platform with a 30-day free trial.
EDITOR'S CHOICE
Site24x7 Linux Monitoring is our top pick for a Linux network troubleshooting tool because it is able to interact with all forms of Linux, including those used for cloud platforms. The package gathers Syslog messages, which can provide insights into the problems that network applications are experiencing. This tool is part of a wider package of monitoring tools that includes extensive network device and traffic monitoring.
Download: Get a 30-day free trial
Official Site: site24x7.com
OS: Cloud based
2. ManageEngine OpManager
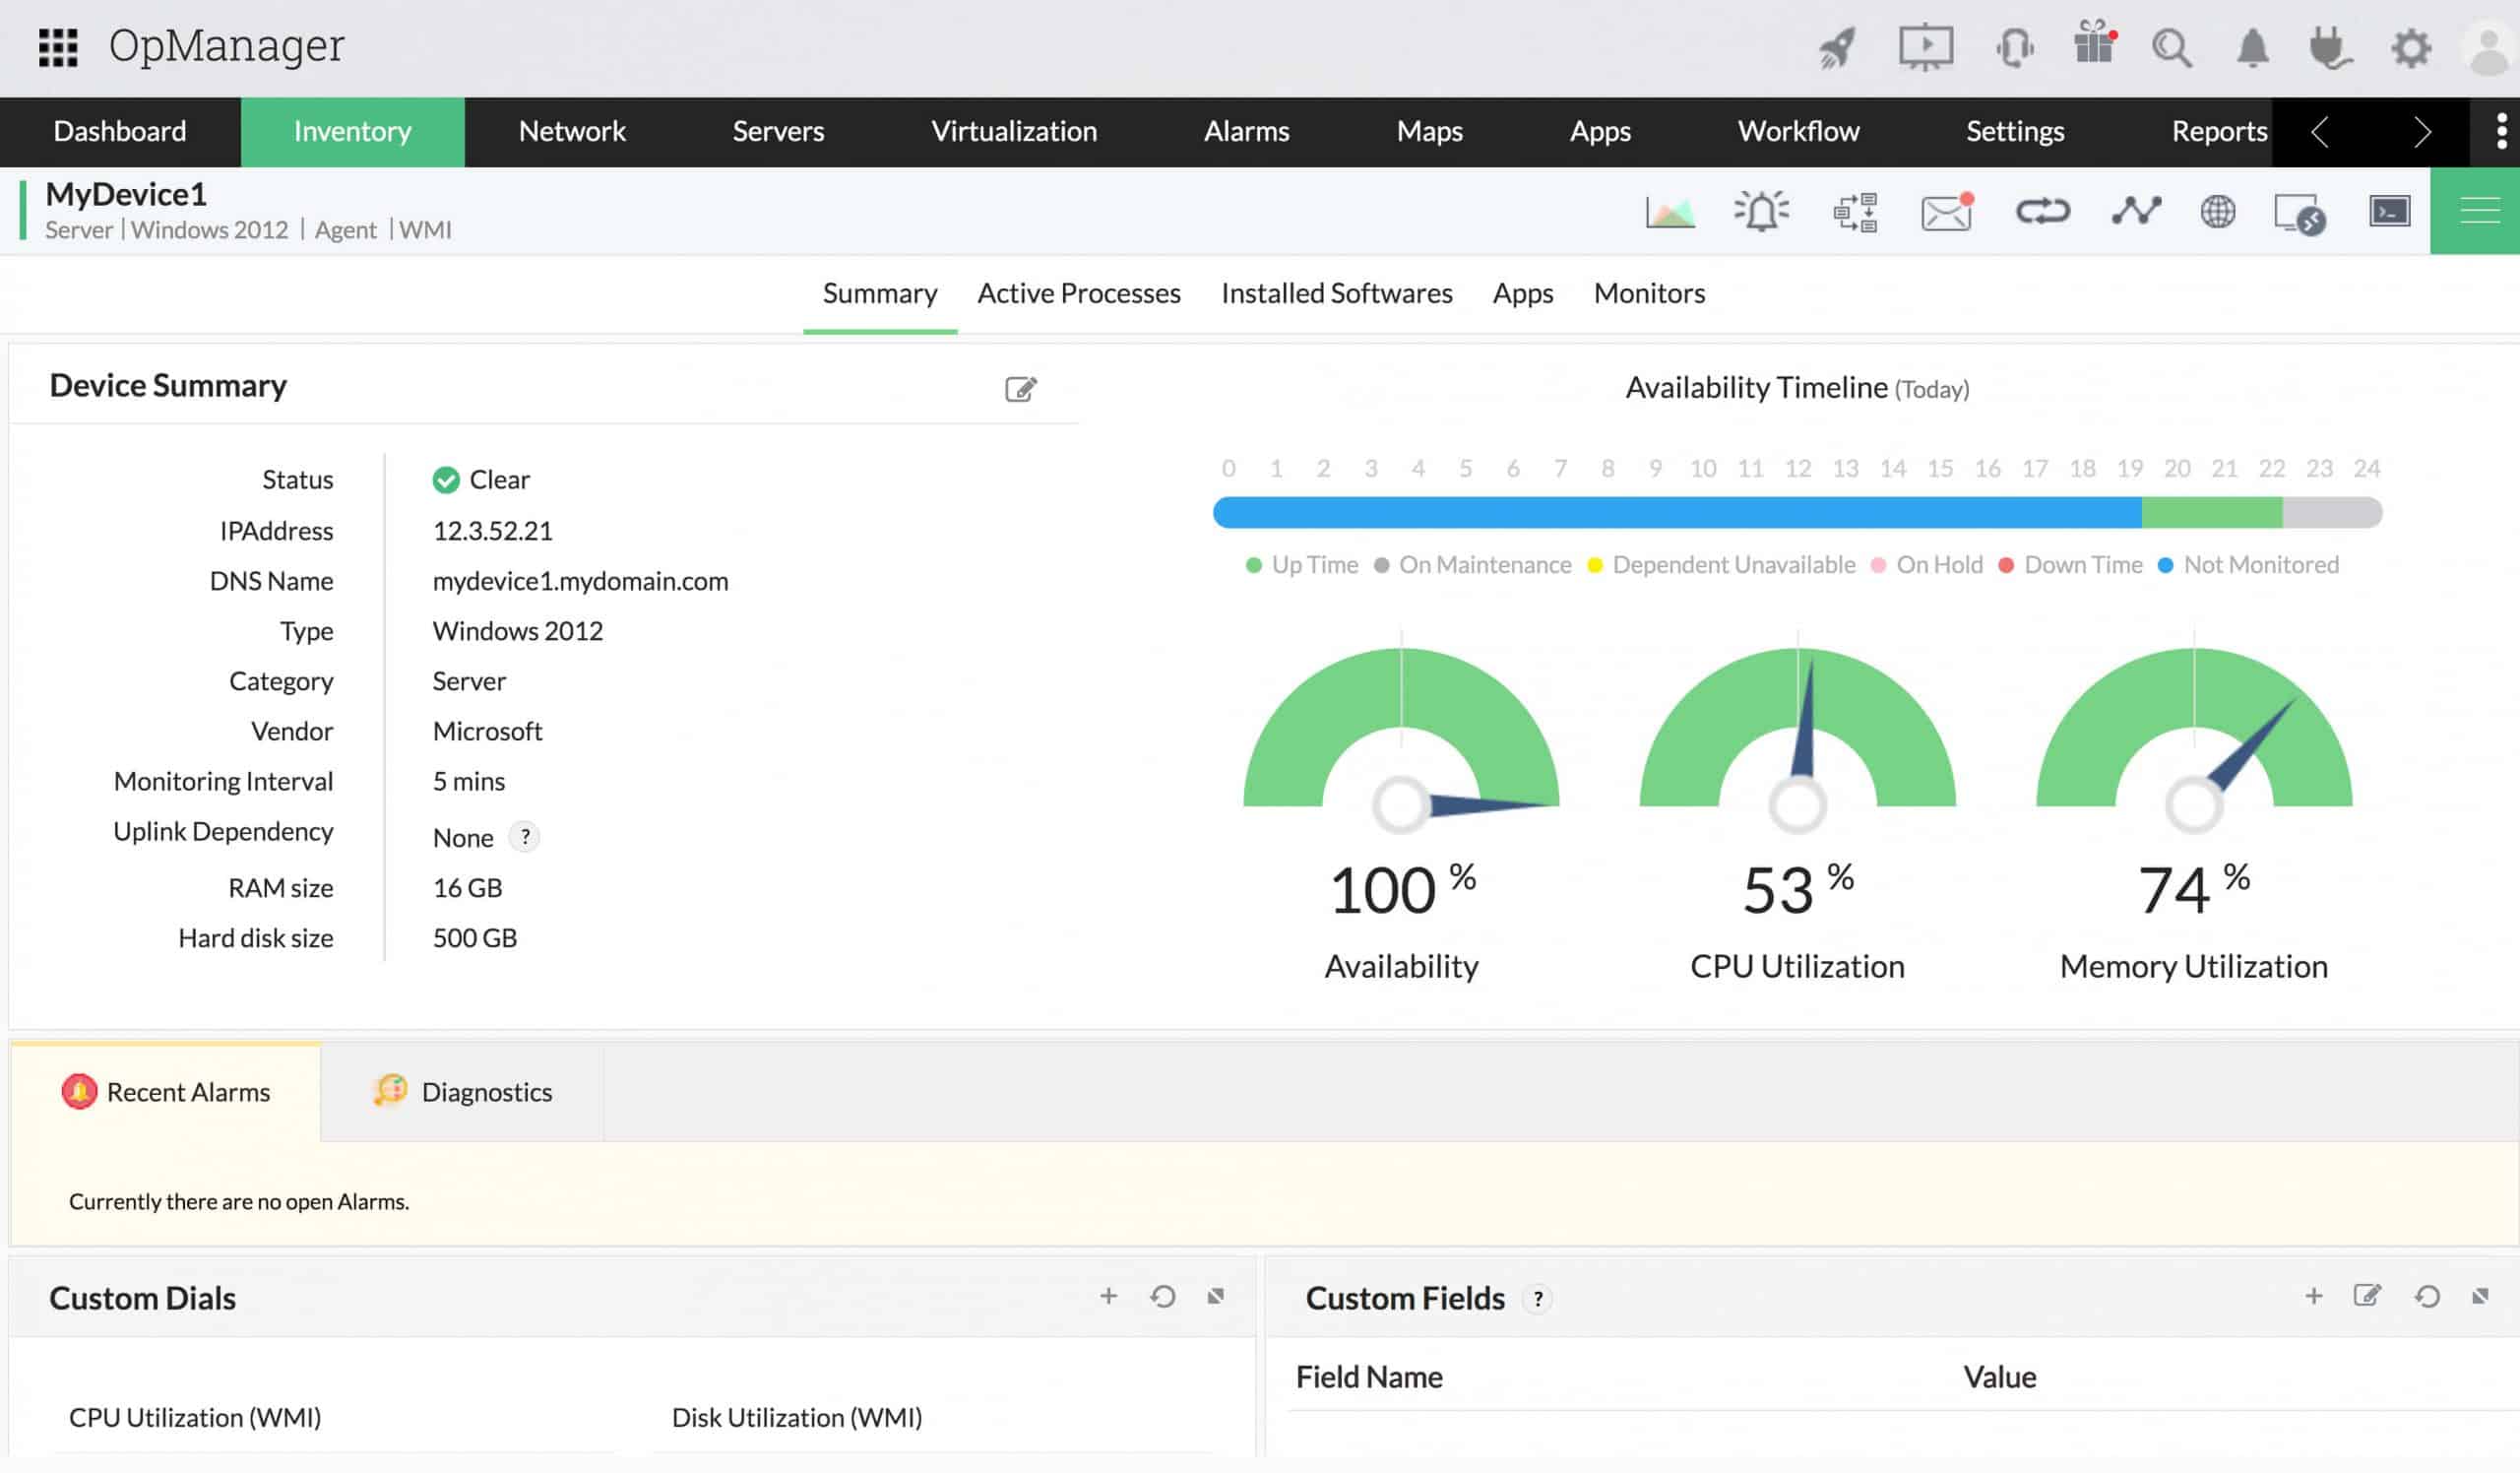
ManageEngine OpManager is a highly scalable Linux network monitoring tool. It can monitor Linux devices and traffic in your network for availability, health, and performance in real-time and generate network performance reports. These reports can be used to make a better purchase or upgrade decisions. In addition, with over 2,000 metrics for monitoring network device performance, OpManager can be used to monitor and identify faults in real-time, so performance issues can be fixed before they impact end-users.
Key Features:
- Real-Time Monitoring: Provides real-time monitoring of network performance metrics and server health for both physical and virtual Linux environments.
- Network Performance Reporting: Generates detailed reports on network performance, aiding in identifying trends and potential bottlenecks.
- Customizable Dashboards: Offers customizable dashboards allowing you to tailor the monitoring view to your specific needs.
- Alerting System: Supports email and SMS alerts for critical events and potential issues, ensuring timely notifications.
- IP Management: Automatically detects unused IP addresses, IP conflicts, and available addresses within your network subnets.
- Dual Protocol Monitoring: Leverages both ping and SNMP protocols for comprehensive network device uptime and performance monitoring.
- Automatic Network Mapping: Builds and maintains a real-time network topology map, providing a visual overview of your network infrastructure.
- Log Collection: Offers advanced log collection capabilities, enabling detailed analysis beyond basic monitoring data.
Why do we recommend it?
ManageEngine OpManager is a full network and server monitoring package that includes a number of troubleshooting and testing tools along site its automated, threshold-based monitoring routines. Typical connectivity tests start with Ping and Traceroute, which are built into the OpManager console. The service also provides root cause analysis for network device problems.
OpManager can provide alerts on the performance degradation of devices in a Linux network. In addition, it categorizes the alerts into Attention, Trouble, Critical, and Service Down. This helps to streamline and prioritize response efforts.

OpManager has many built-in Linux network troubleshooting tools such as Ping, Traceroute, CLI, SNMP, MAC Address Resolver, DNS Resolver, DHCP Scope Monitor, and Port Scanner. The software comes in different editions, which are tailored to suit your network and server monitoring requirements, as shown in Table 1.0 below:
| Features | Free | Standard | Professional | Enterprise | MSP |
|---|---|---|---|---|---|
| Targeted at | Small network | Small to medium networks | Mid to Large networks | Geographically distributed networks | MSPs managing multiple clients |
| Monitor up to | 3 devices | 1000 devices | 1000 devices | 10,000 devices | 10,000+ devices |
| Starting price | Free | $245 | $345 | $11,545 | Contact vendor |
Table 1.0 | Comparison of the different editions of OpManager
Who is it recommended for?
This tool is suitable for any business. It installs on Windows Server, Linux, AWS, and Azure. The package has a Free edition. However, this is limited to monitoring three devices and doesn’t include many features. The Standard edition’s base price caters to 10 devices, which is a good package for small businesses.
Pros:
- Comprehensive Monitoring: Offers a wide range of features for monitoring network performance, server health, and IP usage.
- Real-Time Insights: Provides real-time data and customizable dashboards for proactive network management.
- Alerting and Reporting: Ensures timely notification of potential issues through alerts and generates reports for further analysis.
- In-Depth Network Analysis: Automatic network mapping and log collection capabilities provide deeper insights into network health.
Cons:
- Complexity for Beginners: The extensive feature set and technical functionalities might be overwhelming for non-technical users or those new to network monitoring tools.
- Learning Curve: Mastering ManageEngine OpManager’s full potential might require a learning curve for users unfamiliar with network monitoring concepts.
OpManager license options depend on the number of devices to be monitored. The license is inclusive of all the interfaces, nodes, or sensors in the device. A device can have any number of interfaces, elements, or sensors. You can download the free version for evaluation or check out the 30-day fully-functional trial to confirm its capabilities and make sure it’s the right fit for your organization before purchase.
3. PING
Ping is a network troubleshooting tool used to test the reachability of a host on an Internet Protocol (IP) network. The ping command is one of the most used tools for troubleshooting, testing, and diagnosing network connectivity issues in Windows and Linux environments.
Key Features:
- Reachability Test: Sends ICMP Echo Request packets to a specified IP address, determining if a host on your network is reachable.
- Round-Trip Time (RTT) Measurement: Measures the time it takes for a data packet to travel from your computer to the destination and back, providing an indicator of network latency.
- Packet Loss Detection: Reports the percentage of packets that weren’t received by the destination, helping identify potential network congestion or connectivity issues.
- Packet Size Customization: Allows you to specify the size of the data packets being sent, enabling basic tests of network performance with different data loads.
- Protocol Support: Supports both IPv4 and IPv6 addressing, making it suitable for troubleshooting connectivity on modern networks.
With this tool, you can test if a server is up and running. Ping works by sending one or more ICMP (Internet Control Message Protocol) Echo Request packets to a specified destination IP on the network and waits for a reply. When the destination receives the packets, it responds with an ICMP echo reply. This helps to determine whether a remote host is reachable or not. It can also determine whether there is a packet loss by examining the round-trip delay in communicating with the destination.
Why do we recommend it?
Ping is the first call for any network manager to check on connectivity and device availability. This system is free and built into the operating system for Windows, macOS, and Linux. This system will emit test packets to a target and it operates at Internet Layer level.
Ping is part of the iputils (or iputils-ping) package, pre-installed on nearly all Linux distributions. Most Linux users are familiar with the tool and know how to use it in its basic form. However, there are many additional ping options and variations. The syntax for the ping command is as follows: ping [option] [hostname] or [IP address]
To better illustrate how the ping command works, let’s ping google.com. The output is as shown on the screenshot below:
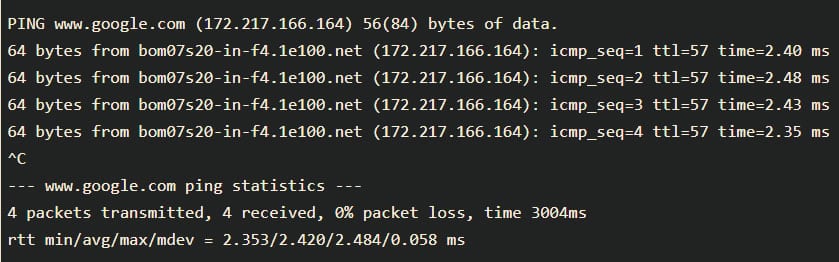
The ping command resolves the Google domain name into an IP address and starts sending ICMP packages to the destination IP. If the destination IP is reachable, it will respond, and the ping command prints a line that includes the following fields:
- The number of data bytes. This translates into 64 ICMP data bytes – 64 bytes.
- The IP address of the destination – from bom07s20-in-f4.1e100.net (172.217.166.164).
- The ICMP sequence number for each packet. icmp_seq=1.
- The Time to Live: This refers to the amount of time or “hops” that a packet is set to exist inside a network before being discarded by a router. – ttl=57.
- The ping time, measured in milliseconds, is the round trip time for the packet to reach the host and the response to return to the sender. – time=2.40 ms, etc.
Who is it recommended for?
Every network manager will use Ping. It doesn’t test Transport Layer ports, but it provides a good check to ensure that every device is running. Ping is central to nearly all automated network management tools but you don’t have to pay anything to use the standard tool at the command line.
Pros:
- Lightweight and Efficient: Extremely lightweight tool with minimal resource consumption, ideal for quick checks.
- Simple to Use: Offers a straightforward syntax with minimal commands to learn, making it accessible for users of all technical backgrounds.
- Native Availability: Pre-installed on most operating systems, including Linux, eliminating the need for additional downloads.
- Cost-Free: Completely free to use, readily available without any licensing fees.
Cons:
- Limited Functionality: Not ideal for long-term monitoring or in-depth network analysis. It lacks advanced features for comprehensive troubleshooting.
- Basic Output: Provides text-based output, lacking data visualization capabilities that can be helpful for identifying trends or patterns.
4. IP Command
The IP command tool in Linux is present in the net tools, which are used for performing several network administration tasks. For example, with the IP command, you can adjust how a Linux computer handles IP addresses, network interfaces controllers (NICs), and routing rules.
Key Features:
- Network Interface Information: Provides details about network interfaces, including their status (active/inactive), MAC addresses, and assigned IP addresses.
- Interface Control: Allows you to enable or disable specific network interfaces, offering control over network connectivity.
- IP Address Management: Enables assigning IP addresses to network interfaces, useful for configuring network settings.
- Routing Table Display: Shows the routing table, providing information about the default gateway and specific routes used for network traffic direction.
- ARP Table Visibility: Displays the Address Resolution Protocol (ARP) table, revealing the mapping between IP addresses and their corresponding MAC addresses on the network.
Why do we recommend it?
The IP command provides a number of system information options and also gives you a way to alter settings. An example of a useful command is the ip route show, which gives you IP address, interface name, subnet range, and gateway details for each interface. It works with IPv6 as well.
The tool is similar to the ifconfig command, but it is much more powerful and has more functions and facilities. Older Linux distributions used the now deprecated ifconfig command, which operates similarly. However, ifconfig has a limited range of capabilities compared to the IP command.
The syntax for the IP command is as follows: [OPTION] OBJECT {COMMAND | help}
Objects subcommands that you will use most often include:
- Link (l) – used to display and modify network interfaces.
- Address (addr/a) – used to display and modify protocol addresses (IPv4/IPv6).
- Route (r) – used to display and alter the routing table.
- Neigh (n) – used to display and manipulate neighbor objects (ARP table).
Who is it recommended for?
The IP command is very flexible and can implement network address and routing changes as well as providing a reconnaissance tool. The tool is free and is integrated into the Linux operating system. The command gives insights into all IP-related issues, so it is well worth getting to know.
Pros:
- Lightweight and Efficient: Extremely lightweight tool with minimal resource consumption, ideal for quick checks.
- Simple to Use: Offers a modular and user-friendly syntax with clear commands, making it accessible for users with some technical understanding.
- Modern and Powerful: Replaces the older ifconfig command, providing a more advanced feature set for network management.
- Native Availability: Pre-installed on all Linux distributions, eliminating the need for additional software installation.
- Cost-Free: Completely free to use, readily available without any licensing fees.
Cons:
- Limited to Linux: Not available on other operating systems like Windows or Mac.
- Limited Functionality: Not ideal for long-term monitoring or in-depth network analysis. It lacks advanced features for comprehensive troubleshooting.
- Text-Based Output: Provides text-based output, lacking data visualization capabilities that can be helpful for identifying trends or patterns.
5. Name Server Lookup (NSLookup)
NSLookup is a network administration command-line tool for querying the Domain Name System (DNS) to obtain the mapping between a domain name and IP address. It’s convenient when troubleshooting DNS issues on a Linux system.
Key Features:
- DNS Lookup: Performs standard forward DNS lookups, translating domain names (e.g. [invalid URL removed]) into their corresponding IP addresses.
- Reverse DNS Lookups: Conducts reverse DNS lookups, taking an IP address and returning the associated hostname, useful for identifying the device behind an IP.
- Interactive Mode: Offers an interactive mode where you can enter multiple DNS queries without restarting the tool each time, streamlining troubleshooting.
- Detailed Output: Provides detailed debugging information, including the authoritative DNS server that responded, the query type, and the response time, aiding in pinpointing DNS resolution issues.
- Custom DNS Server Queries: Allows you to query a specific DNS server, helping to verify how a particular server resolves a domain and identify potential issues.
Why do we recommend it?
Nslookup provides a name service lookup function. This tool is free to use and it is available on Windows, macOS, and Linux. This command reports on the domain name server entries for your network. It will also provide information from the global DNS system.
NSLookup queries the specified Linux DNS server and retrieves the requested records associated with the domain name you provided. Other DNS records that can be obtained include:
- A: The IPv4 address of the domain.
- AAAA: the IPv6 address of the domain.
- CNAME: the canonical name (CNAME) allows one domain name to map onto another. This enables multiple websites to point to a single IP or web server.
- MX: the server that handles email for the domain.
- NS: one or more authoritative name server records for the domain.
- TXT: a type of DNS record that contains text information for sources outside of your domain. This information is used for email spam prevention and domain ownership verification, among others.
Thenslookup tool comes bundled inside the bind-utils package in older Linux systems, while newer Linux systems ship the nslookup tool by default. The nslookup tool can operate in interactive or non-interactive mode. When used interactively, the user issues parameter configurations or requests when presented with the nslookup prompt (>). When no arguments are given, then the command queries the default server. In non-interactive mode, i.e., when the first argument is a name or Internet address of the host being searched, parameters and the query are specified as command-line arguments in the program’s invocation. The non-interactive mode searches the information for a specified host using the default name server.
Who is it recommended for?
This is a command line tool that is frequently used by network managers. The command is integrated into the operating system of Windows, macOS, and Linux. You don’t need to install it because the tool is already available.
Pros:
- Efficient Troubleshooting: Combined with ipconfig (or ip), NSLookup offers a quick and effective way to diagnose DNS resolution problems.
- CLI-Based Problem-Solving: Enables troubleshooting DNS issues directly through the command line, advantageous for remote troubleshooting scenarios where GUI access might be limited.
- DNS Server Insights: Reveals which DNS server has authority over a domain and its prioritization within the DNS hierarchy, providing valuable insights for advanced troubleshooting.
Cons:
- Limited Configuration: Cannot directly change or modify DNS settings for multiple machines within the tool itself. Additional configuration steps might be necessary.
- Learning Curve for Beginners: While the basic functionality is straightforward, understanding the detailed output and advanced features like querying specific DNS servers might require some familiarity with DNS concepts and command-line usage.
6. Domain Information Groper (Dig)
Dig is a network administration command-line tool for querying the DNS. Dig is useful for network troubleshooting and educational purposes. With dig, you can query DNS servers for information regarding various DNS records, including host addresses, mail exchanges, name servers, and related information. It was intended to be a tool for diagnosing DNS issues. However, you can use it to poke around and learn more about DNS, which is one of the central systems that keep the internet routing traffic.
Key Features:
- Advanced DNS Record Queries: Allows you to query for various DNS record types beyond basic A (IPv4 address) records. This includes AAAA (IPv6 address), MX (Mail Exchange), NS (Name Server), TXT (text), and more, offering a comprehensive view of DNS record information.
- Reverse DNS Lookups: Conducts reverse DNS lookups, similar to NSLookup, taking an IP address and returning the corresponding hostname.
- Custom DNS Server Targeting: Enables querying a specific DNS server, allowing you to verify how a particular server resolves a domain and diagnose potential issues within the DNS resolution chain.
- Detailed Results: Provides detailed information about the DNS query process, including the query time, the authoritative DNS server that responded, the response code (success or failure), and the response time.
- Extensive Debugging: With the +debug option, you can display additional debugging information, including the complete query and response messages sent and received during the DNS resolution process.
Why do we recommend it?
Dig is a Linux utility that provides a querying utility for the Domain Name System. It gives you details of domain name records for a particular domain, such as the related IP address. This tool was available before nslookup, which, since its creation has become more widely used.
Newer Linux systems ship dig utilities by default, but most older ones come bundled inside the bind-utils package. Thus, dig is usually installed by default on most Linux distributions, and you can access it from the command line with no additional installation. To confirm if dig is installed on your Linux system, run the # dig -v.
If the command returns anything other than dig’s version information, you may need to install dnsutils. For example, to install dnsutils on a Linux server, run the following commands:
For Debian/Ubuntu distribution, use the command: sudo apt-get install dnsutils
For RedHat/CentOS distribution, use the command: dnf install bind-utils
Once you’ve installed dnsutils, run the # dig -v command again to verify dig’s installation.
Who is it recommended for?
Dig can be used as an alternative to nslookup, The tool is available in Linux, macOS, and several Unix versions. This tool queries the DNS root zone.
Pros:
- Lightweight and Efficient: As a command-line tool, Dig is lightweight and consumes minimal resources, making it suitable for quick checks and troubleshooting on the go.
- Granular DNS Record Exploration: Offers advanced options to query for specific DNS record types, providing a deeper understanding of DNS configurations.
- Native Availability: Pre-installed on most newer Linux distributions, eliminating the need for additional software installation.
Cons:
- Limited Visualization: Lacks a graphical user interface (GUI) and relies solely on text-based output, which can be challenging to interpret for beginners or users who prefer visual representations of data.
- Command-Line Expertise Recommended: While the basic functionality can be grasped quickly, utilizing Dig’s full potential, including advanced record types, debugging options, and interpreting detailed output, might require some familiarity with DNS concepts and command-line usage.
7. Ethtool
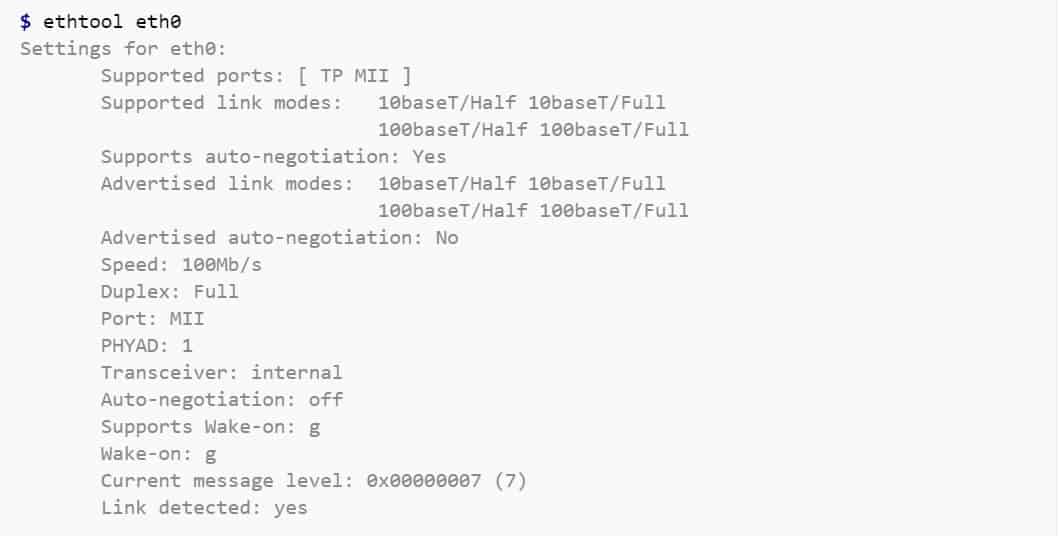
Ethtool is a tool used for troubleshooting in a Linux network. It is primarily used to query and control Ethernet devices, including driver and hardware settings on Linux systems.
Key Features:
- Auto-Negotiation Details: Displays the auto-negotiation settings of your network interface, revealing advertised capabilities (speed, duplex) by your device and the link partner (switch or router) it’s connected to.
- Manual Configuration: Allows you to manually set the speed and duplex mode (full-duplex, half-duplex) of your network interface, providing control over network communication settings in specific scenarios.
- Driver Information: Shows details about the network interface driver, including its version, firmware version, and bus information, which can be helpful for identifying compatibility issues or updating drivers.
- Flow Control Analysis: Displays the current pause parameters, such as usage of pause frames, auto-negotiation status for flow control, and asymmetric pause capabilities, aiding in troubleshooting congestion control mechanisms.
- Offload Feature Status: Provides information about the state of offload features supported by your network interface card (NIC), such as checksum offload and segmentation offload, which can improve network performance by offloading tasks from the CPU.
Why do we recommend it?
Ethtool is available for Linux kernel systems, which includes Android and Amazon’s FireOS. The tool provides a method to query data about the network interface controller of a computer and it also facilitates changes to its settings.
Ethtool can also be used to find important information about connected Ethernet devices on your Linux network. Other ways the tool can be used include:
- Control speed, duplex, auto-negotiation, and flow control for Ethernet devices
- Control checksum offload and other hardware offload features
- Control receive queue selection for multi-queue devices
- Control DMA ring sizes and interrupt moderation
- Identification and diagnosis of Ethernet devices
- Identification and diagnosis of Ethernet devices
- Extended Ethernet devices statistics
- Upgrade firmware in flash memory
Most Linux distributions provide a standard utility program called ethtool that can be used from a shell to control or gather information from NICs using the ethtool userspace API. The tool consists of the following key components:
- An API within the Linux kernel can send and receive parameters through their device driver software, through which NICs can send and receive parameters.
- A userspace API based on the Linux SIOCETHTOOL ioctl mechanism through which application programs can communicate with the kernel to send and receive NIC and NIC driver parameters.
Ethtool is installed by default in most Linux distributions. However, you can check whether ethtool is installed already with the following command: # sudo ethtool –version.
If you see an error, then ethtool may not be installed on your computer. However, you can install it via the official package repository of your favorite Linux distribution.
Who is it recommended for?
Ethtool is a free utility, however,r it is rarely used. You can use the command to make changes to the NIC’s settings. The service could be useful if integrated into a network management tool, which is possible because it is available as an API.
Pros:
- Driver and Hardware Management: Enables querying and managing network interface drivers and hardware details directly within the Linux environment.
- New Device Identification: Helps identify and diagnose issues with newly connected ethernet devices by revealing compatibility information and potential configuration mismatches.
- Lightweight and Efficient: As a command-line tool, Ethtool utilizes minimal system resources, making it suitable for quick checks and configuration adjustments.
- Native Availability: Pre-installed on many Linux distributions, eliminating the need for additional software installation.
Cons:
- Limited to Active Troubleshooting: Ethtool is primarily focused on actively querying and configuring network interface settings. It might not be ideal for passive troubleshooting methods like monitoring network traffic or identifying ongoing performance issues.
- Command-Line Expertise Recommended: Utilizing Ethtool’s full potential, especially for advanced settings and driver management, might require some familiarity with network interface concepts and command-line usage.
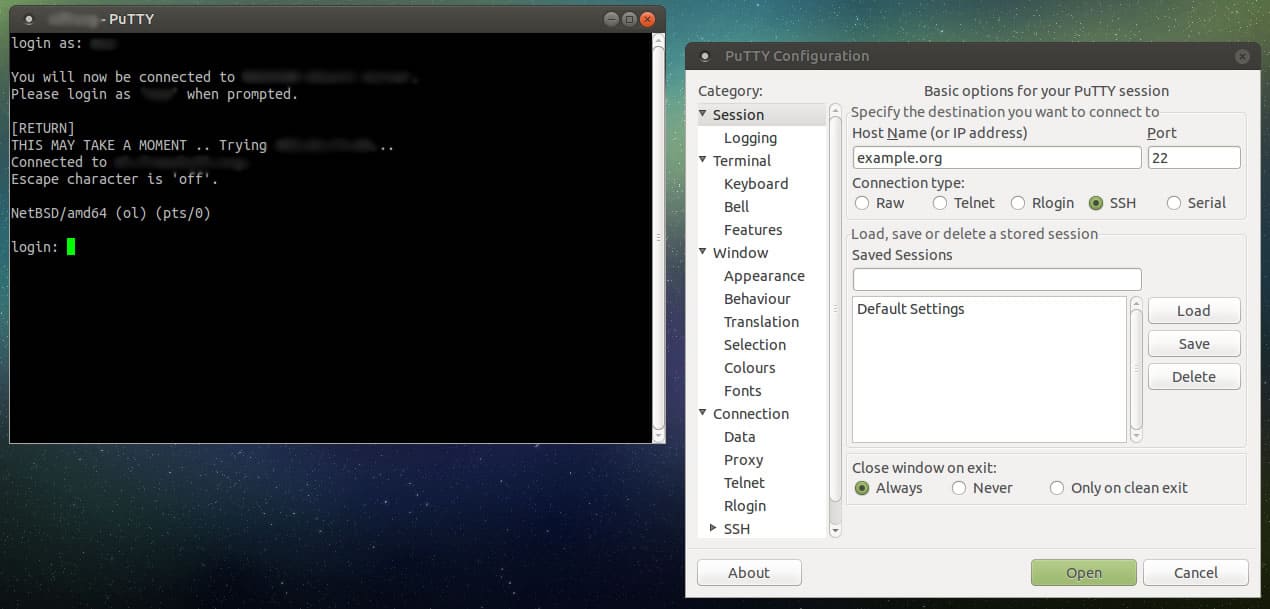
8. PuTTY
PuTTY is a free and open-source terminal emulator, serial console, and network file transfer application. It supports several network protocols, including SCP, SSH, Telnet, rlogin, and raw socket connection. PuTTY was originally written for Microsoft Windows, but it is now supported on Linux OS.
Key Features:
- Secure Remote Access: Supports the SSH protocol, enabling secure remote login and command-line access to servers and network devices over an encrypted connection.
- Serial Port Communication: Connects to serial ports for console access to networking equipment, potentially useful for troubleshooting devices that lack a standard network interface.
- Terminal Emulation: Emulates the behavior of the xterm terminal, providing a familiar command-line environment during remote sessions and supporting various terminal control sequences.
- Cross-Platform Compatibility: Runs primarily on Windows systems natively. However, with third-party tools like Wine, it can achieve some level of functionality on Linux and potentially other operating systems.
Why do we recommend it?
PuTTY is a terminal emulator that gives remote access to the command line of a computer across the internet or over a network. The name doesn’t mean anything but the “TTY” part stands for “teletype.” The system can implement encrypted communications by implementing a choice of protocols.
The Linux version of PuTTY is a graphical terminal program that supports the SSH, telnet, and rlogin protocols and connects to serial ports. It can also connect to raw sockets, typically for debugging purposes. Some Linux users may be wondering why anyone would use a separate SSH client on Linux when there’s already a pre-existing native Linux terminal?
There are several reasons why you would want to use Putty on Linux:
- Familiarity: You have used Putty for so long on Windows that you are more comfortable with it.
- Convenience: You find it difficult to manually edit SSH config files to save the various SSH sessions, so you prefer Putty’s graphical way of storing SSH connections.
- Troubleshooting: You want to debug by connecting to raw sockets and serial ports.
Putty is not installed by default on most Linux distributions. Instead, you have to manually install it from the default official repositories or package manager in your Linux distributions. Since most people would prefer to use the pre-installed OpenSSH in a terminal window on Linux for basic SSH access, the primary use of Putty on Linux is primarily for debugging: connecting to serial ports and raw sockets.
Who is it recommended for?
This service is a GUI package for Windows, macOS, and GNOME Linux distros. PutTTY is an old system but it is very widely copied. You are more likely to use the tool’s secure implementation that integrates SSH for encryption. PuTTY is a free utility.
Pros:
- Widespread Use: One of the most popular free SSH clients, offering familiarity and a large user base for troubleshooting and support.
- Open-Source and Free: Completely free and open-source software, readily available without licensing fees.
- Protocol Versatility: Supports both IPv4 and IPv6 addressing schemes, ensuring compatibility with modern and legacy network environments.
Cons:
- Not Native to Linux: Primarily designed for Windows systems. Functionality on Linux might require additional configuration or emulation tools, potentially hindering seamless integration.
- Limited Out-of-the-Box File Transfer: While SFTP is supported, the base PuTTY client itself might not offer a user-friendly interface for file transfer compared to dedicated FTP clients.
9. Traceroute and Tracepath
Traceroute is a tool in Linux that allows you to investigate the routes of network packets and identify the limiting factor in their journeys. Traceroute is also helpful for mapping local networks and troubleshooting sluggish connections. Insight into the topology and connections of the local network is found when running the tool.
Key Features:
- Hop Discovery: Displays the IP addresses of each router (hop) along the path packets take to reach the destination, providing a visual representation of the network route.
- Round-Trip Time (RTT) Measurement: Measures the round-trip time for each hop, indicating the delay packets experience at each router on the path. Analyzing these values can help pinpoint potential bottlenecks or congested network segments.
- Maximum Transmission Unit (MTU) Discovery: In some cases, Traceroute can discover the path MTU (Maximum Transmission Unit), which is the largest packet size that can be transmitted without fragmentation along the route.
- Protocol Support: Supports both IPv4 and IPv6 addressing schemes, making it suitable for troubleshooting modern and legacy networks.
- Hop Count: Displays the number of hops between you and the destination, offering a basic understanding of the network path length.
Why do we recommend it?
Traceroute is re second most widely used network diagnostic tool after Ping. This system is like Ping because it gives a report of elapsed time to each router on a path to a given target. The system is available for Windows, macOS, and Unix as well as Linux. The command is “tracert” on Windows.
Traceroute works by sending packets of data to the target computer, server, or website and recording any intermediate steps through which the packets travel. The output of a traceroute command will be the IP addresses and domain names through which the packets pass. These entries also show how long it takes for the packets to reach each destination. The information obtained may explain why some websites may take longer to load than others, as the number of traffic hops can vary.
On Linux or Unix-like operating systems, traceroute sends, by default, a sequence of User Datagram Protocol (UDP) packets, with destination port numbers ranging from 33434 to 33534. The implementations of traceroute shipped with Linux include an option to use ICMP Echo Request packets (-I) or any arbitrary protocol (-P) such as UDP, TCP using TCP SYN packets, or ICMP.
Tracepath is another utility similar to traceroute on Linux, with the primary difference of not requiring superuser privileges. Traceroute and tracepath are available for installation from the default official repositories or package manager in most Linux distributions.

Figure 5.0 | Screenshot showing the output of the tracepath command in Linux
Who is it recommended for?
Traceroute is a free utility that is integrated into the Linux operating system. Tracepath is a version of Traceroute that can be used by permission levels other than the root user. The tool can’t explain the route a previous transmission took but it can run a connection, which will likely take the same path as a previous connection to the same target.
Pros:
- Built-in Availability: Pre-installed on most Linux distributions and readily available in the command prompt, eliminating the need for additional software installation.
- Simple to Use: Offers a straightforward syntax with minimal commands to learn, making it accessible for users with basic technical knowledge.
- Gateway Visualization: Shows the gateways (routers) your network traffic traverses, providing insights into the network path.
- Bottleneck Identification: By analyzing round-trip times, you can potentially identify network segments or routers causing delays in packet transmission.
Cons:
- Limited Monitoring: Not a proactive monitoring tool. It provides a snapshot of the route at a specific point in time and doesn’t offer continuous monitoring capabilities.
- Basic Output: Output format might be limited for detailed reporting. Additional tools might be necessary for generating comprehensive reports.
10. Route
The route command is used to view and make changes to the kernel routing table on Linux, BSD, and other Unix-like systems. It sets up static routes to specific hosts or networks through an interface after it has been configured. Route command in Linux is primarily used when you want to work with or update the IP/kernel routing table.
Key Features:
- Static Route Configuration: Enables the creation and configuration of static routes to specific hosts or networks. This can be useful in scenarios where consistent routing is required.
- Troubleshooting Complex Issues: By examining the routing table and modifying routes as needed, Route can aid in troubleshooting complex network connectivity problems.
- Detailed Route Information: Displays various attributes of each route entry, including the gateway, destination network address, network mask, and other packet-related information.
- Simple Syntax: Offers a relatively simple syntax with clear commands for basic functionalities, making it accessible for users with some understanding of networking concepts.
Why do we recommend it?
Route is a command line tool for Unix and Unix-like operating systems, which includes Linux. The tool solves the problems faced by tracking a path with Traceroute, which is that routing is dynamic. Route quotes the routing table of the local computer and it can fix a route between two points so that it never changes.
Who is it recommended for?
The route command is only relevant for use on private networks. It isn’t possible to override routing autonomy on the internet. This utility isn’t always available in Linux and you might have to install it.
Pros:
- Precise Control: Provides granular control over network routing by allowing static route configuration. This can be beneficial for specific network setups or troubleshooting scenarios where dynamic routing might be unpredictable.
- In-Depth Visibility: Grants detailed insights into the routing table, revealing information about configured routes, gateways, and packet attributes, aiding in diagnosing routing-related problems.
- Straightforward Usage: The basic commands for viewing and modifying the routing table have a relatively simple syntax, making it learnable for users with some technical background.
Cons:
- Static Route Management: Static routes require manual configuration and maintenance, which can become cumbersome for complex networks or frequent changes.
- Potential for Misconfiguration: Making mistakes when modifying the routing table can lead to unintended consequences and network connectivity problems. It’s crucial to understand routing concepts before using Route for advanced configurations.
Many Linux distributions do not have route commands pre-installed. To install it on your favourite Linux distribution, use the following commands: On Debian/Ubuntu distribution use the command: # sudo apt-get install net-tools. On RedHat/CentOS distribution use the command: # sudo yum install net-tools. The syntax for the route command is as follows:
route [-nNvee] [-FC] [<AF>]           List kernel routing tables

route [-v] [-FC] {add|del|flush} ...  Modify routing table for AF.

route {-h|--help} [<AF>]              Detailed usage syntax for specified AF.

route {-V|--version}                  Display version/author and exit.
When the add or delete options are used, route modifies the routing tables. Without these options, the route displays only the current contents of the routing tables.
11. NETCAT and NCAT
Netcat is a tool for reading from and writing to network connections using TCP or UDP. It is a feature-rich network troubleshooting and investigation tool. Netcat can be used directly or indirectly as a backdoor tool into other networked systems, allowing you to remotely carry out port scanning, port listening, and file transfer. Other common uses include shell-script-based HTTP clients and servers, network daemon testing, and simple TCP proxies.
Key Features:
- Connection Flexibility: Establishes outbound or inbound connections, supporting both TCP and UDP protocols. It can connect to any port on any host, offering broad functionality.
- Programmatic Connections: Allows other programs to service connections established by Netcat, potentially enabling custom network applications.
- DNS Lookups: Performs full DNS forward and reverse lookups, resolving hostnames to IP addresses and vice versa, providing additional context during connection attempts.
- Source Address Control: Enables the use of any locally configured network source address, allowing for flexibility in spoofing (not recommended) or specifying desired network interfaces.
- Command-Line Integration: Can read command-line arguments from standard input, facilitating integration with scripts for automated tasks.
- Port Scanning: Provides built-in port scanning capabilities with randomization, allowing for basic network reconnaissance (use responsibly and ethically).
- Data Transmission Control: Offers a slow-send mode for transmitting data at a specified rate and supports hex dumps of transmitted and received data, aiding in debugging data exchange.
- Advanced Routing: Includes loose source-routing capability, a feature used in specific network scenarios (use with caution due to security implications).
- Dynamic Source Port Selection: Allows for the use of any local source port, potentially helpful for avoiding conflicts with other running applications.
- Telnet Emulation: Provides an optional Telnet-options responder, enabling basic Telnet functionality for specific use cases.
Why do we recommend it?
Netcat is a flexible tool for sending text or commands to remote devices. This command is a security weakness and so it should be checked out as a possible exploit. The command can be set up to run commands remotely, enabling a backdoor to be opened.
A modern reinvention of the Netcat tool is called Ncat. Ncat was developed for the Nmap Project; it combines the best capabilities of the various Netcat variants into a single, sophisticated tool.
In addition, it includes several new features not available in the original Netcat tool, such as:
- Proxy connections via SOCKS4/SOCKS5 or HTTP proxies
- SSL connect/listen support and IP address/connection filtering
- Ability to “Chain” Ncat processes
- Connection brokering
- TCP/UDP redirection
Netcat can be installed on Debian/Ubuntu Linux distribution using the # sudo apt-get install netcat. Or on RedHat/CentOS distribution using the command: # yum install nc. On the other hand, Ncat comes with the standard Nmap download packages, which saves you the hassle of downloading it differently.

Figure 6.0 | Netcat port scanning examples
Who is it recommended for?
This command is used by hackers and penetration testers. It can also be used within a communications script but that might get flagged as a liability by vulnerability scanners. The tool can also be used for network testing, such as port scanning or DNS querying.
Pros:
- Cross-Platform Compatibility: Available on various platforms, including Windows, Linux, and Unix operating systems, offering broad usability.
- Beginner-Friendly Syntax: Offers a relatively simple syntax with clear commands for basic functionalities, making it approachable for users with some technical understanding.
- Security Testing (Double-Edged Sword): While not its intended purpose, Netcat can be used for security testing by probing endpoints and potentially creating backdoors.
- File Transfer: Can be used for basic file transfer between a host and client, although dedicated file transfer tools might be more user-friendly.
Cons:
- Overly Complex for Simple Needs: Netcat’s versatility can be overwhelming for users simply looking for a basic IP scanner or a network troubleshooting tool. Other tools might be better suited for these scenarios.
- Security Concerns: Several features, like port scanning and loose source routing, can be misused for malicious purposes. It’s crucial to understand the security implications before using Netcat.
- Limited User Interface: Relies solely on the command line, lacking a graphical user interface (GUI) which might be less intuitive for some users.
Linux network troubleshooting FAQs
How do I run a network diagnostic on Linux?
Use two utilities that are built into Linux to test your network. These are:
- Ping – Gives the roundtrip time to a destination IP address. This tool also tells you the variability in delivery rates (jitter) and the packet loss rate.
- TraceRoute – tracks each router that a connection passes through and shows the journey time to that device.
What is the use of netstat command in Linux?
The netstat command gives you information about the network and its configuration. This is a great troubleshooting tool that is free to use and already available at the Linux command line. The tool lists all of the devices on the network and each port on each device. Each line in the output displays which other computer that port is currently connected to.
What is nslookup used for?
The nslookup command gives you the hostname for a given IP address or the IP address for a given hostname. Enter netstat followed by a domain name or an IP address to query the DNS lookup table.
