

Networks are formed by switches and routers, which are threaded together with cables. The only working parts on the cable that can go wrong are the connectors, so all of your network monitoring efforts need to be focused on switches and routers.
Here is our list of the best network device monitoring tools:
- Auvik EDITOR’S CHOICE This package provides network discovery, constant device status monitoring, traffic analysis, and network configuration management from a cloud platform. Start a 14-day free trial.
- Paessler PRTG Network Monitor (FREE TRIAL) This package of monitoring systems includes an SNMP system plus options for traffic monitoring. It installs on Windows Server. Access a 30-day free trial.
- ManageEngine OpManager (FREE TRIAL) This on-premises system monitors networks and servers with SNMP processes at its heart. It runs on Windows Server and Linux. Start a 30-day free trial.
- Site24x7 (FREE TRIAL) This platform offers a package of tools that provide a mix of system monitoring facilities including network, server, and application performance trackers. Start a 30-day free trial.
- Obkio This cloud-based service provides network discovery and testing of both devices and connections, raising alerts if problems arise.
- Datadog Network Device Monitor This cloud-based system is part of a wider platform of system monitoring tools that also includes a traffic monitor.
- Atera This cloud-based platform offers tailored SaaS packages with per-technician pricing for use by managed service providers and IT departments.
- SolarWinds Network Performance Monitor This is the leading network performance monitoring tool and it uses SNMP to discover all network devices, create an asset inventory, and automatically draw up a network map. Runs on Windows Server.
Network devices are complicated pieces of devices and many issues can arise that will impair the entire network. Not only do you need to be sure that nothing on the device breaks spontaneously, but you also need to be sure that you are not overloading it with too much traffic volume. Statistics need to be gathered per port and also for the entire device.
Monitoring network devices
Every switch and router has a management console that you can access across the network. This includes screens of statistics on current activity and also notifications on problems. However, you would have to connect to each device in turn and navigate through its console menu to see the data for each device in turn. This just isn’t practical.
Fortunately, there are some very good network device monitoring tools available that do all of the queryings for you and present statistics from every device in one dashboard. Typically, these network monitors will also check for physical problems with all devices, so you can be sure that there are no issues building that is suddenly going to bring the network to a standstill.
The Simple Network Management Protocol
Most of the technology behind remote monitoring for network devices is provided by the Simple Network Monitoring Protocol (SNMP). This protocol is a universal standard that is maintained by the Internet Engineering Taskforce. The system has been adopted by all manufacturers of network devices.
The SNMP system requires a central SNMP Manager and an agent on each device. The agent constantly scans the device and compiles a file-based database of status and statistics. This is called a Management Information Base (MIB).
The SNMP Manager periodically broadcasts a request for reports over the network. The fact that the request is broadcasted means that the SNMP Manager doesn’t need to know exactly what devices are on the network or their addresses. When the device agent hears the request, it immediately sends out its MIB to the return address on the request. If the agent detects a problem, it sends out its MIB with the problem information in it without waiting for a request. This is called a Trap message.
All manufacturers of network devices include an SNMP agent on the equipment as part of the firmware. All that is missing to implement the SNMP system is the manager. Network device monitoring tools perform this role.
The MIB includes information about the device, such as make, model, year of manufacture, and operating system version. It also includes current throughput activity, CPU and memory capacity, and current CPU and memory usage. The MIB contains all of the identifiers assigned to the device and lists all physical ports that are currently in use, together with the identifiers of the device at the other ends of the connection.
Automated network device monitoring
Network device monitoring tools can increase productivity in several ways. First of all, the ability of the tool to centralize reporting on any number of devices saves time that you would otherwise have to spend logging into each device.
The grouping of live performance information also means that information on all devices can be shown on one screen. So, a monitoring tool with an overview on its home page is a big timesaver.
The biggest benefit that you will get from a network device monitoring tool lies with an alerting mechanism. Network device monitors are also known as network performance monitors and they enable thresholds to be placed on any metric that is gathered. For example, you could place a threshold on CPU utilization at 75 percent.
If a threshold is crossed, the monitor will raise an alert. It is possible to set up the system so that it will forward alerts to members of the technical support team by SMS or email. That means that no one needs to sit and watch the dashboard of the monitor waiting for problems to arise. Instead, the team can get on with other tasks, knowing that they will be drawn back to the network device monitoring dashboard by a notification.
Thresholds need to be set at levels that allow the team enough time to take action to lead off disaster. For example, setting the alert threshold on CPU utilization at 100 percent would mean there would already be performance impairment occurring before anyone can do anything about the traffic surge.
SNMP Trap messages also get interpreted into alerts by network device monitors.
Related Post: The Ultimate Network Device Monitoring Guide
The best network device monitoring tools
There are several very good network performance monitors on the market. These all monitor network devices. However, it can take you a long time to read up on all of the available systems. This is why we have drawn up this shortlist.
Our methodology for selecting a network device monitoring tool
We have examined the market for network performance monitoring systems and analyzed the available packages based on the following requirements.
- A package that can act as an SNMP Manager
- A system to process MIBs into an asset inventory
- Automated network mapping
- Alerts for SNMP Traps
- The facility to generate alerts from performance thresholds
- A free trial or a demo system for a cost-free assessment opportunity
- Value for money represented by a comprehensive tool at a fair price
There are some exciting providers in the network performance monitoring field right now that build on the solid ground of SNMP with innovations that expand the capabilities of the traditional device monitoring task.
1. Auvik (FREE TRIAL)
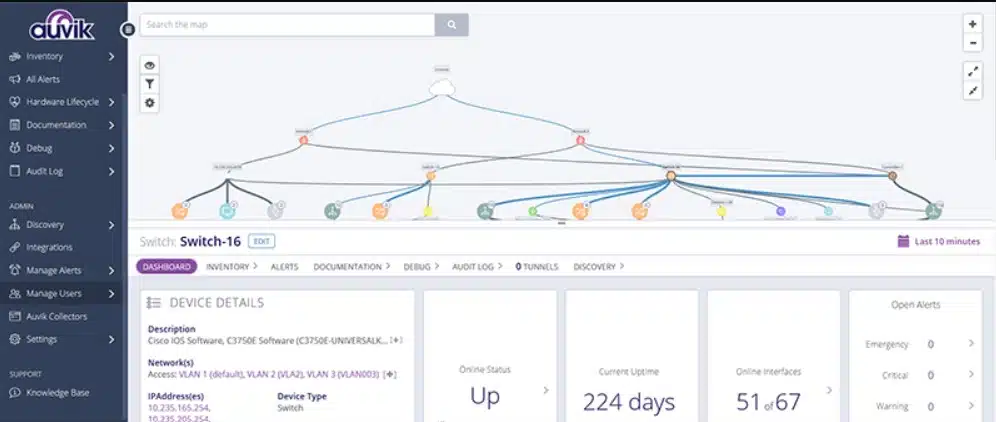
Auvik is a SaaS package that is delivered from the cloud. It is a network monitoring and management package that is centered on an SNMP-based network device monitoring service. This platform also gives you WAN monitoring, connection testing, traffic analysis, and network configuration management.
Key Features:
- Network Discovery: Repeats continuously to spot network changes
- Automatic System Documentation: A hardware inventory
- Network Topology Map: Refreshes automatically with network changes
Why do we recommend it?
Auvik provides all of the tools that a network support team needs to do its work. This includes system documentation that is constantly re-checked, device status checking, network traffic analysis, and network configuration management. The tool maps your LAN and updates that plan automatically when the network changes.
When enrolling your network into the monitoring service, the Auvik cloud platform installs a collector on one of your servers. This acts as the SNMP manager and broadcasts a status request to all device agents installed on your network hardware.
The device agents send back reports that are uploaded to the Auvik cloud server. This data provides information for a hardware inventory and that is the basis for a network topology map. Every report request broadcast brings in a new set of data and if the network layout has changed, the inventory and the map will be automatically updated.
An SNMP device agent will send out a report without waiting for a request if it encounters a component problem in the constant scans of its hosting device. This is called a “trap” and the Auvik server interprets it into an alert. The tool will also generate alerts if it deduces other problems, such as slowing throughput.
Who is it recommended for?
This cloud-based system offers an appealing package for any business because it provides all of the monitoring systems that you will need to keep your network on track. The package also includes a network configuration management unit to guard the settings of your switches and routers.
Pros:
- Alerts for Device Component Failure: Notified by SNMP Traps
- Spots Rogue Devices: Part of the SNMP sweep
- Network Traffic Analysis: Uses IPFIX, NetFlow, sFlow, and J-Flow
Cons:
- No Price List: Ask for a quote
Auvik offers a 14-day free trial to potential customers.
EDITOR'S CHOICE
The Auvik package is our first choice because it also communicates with switches and routers to extract traffic data. Different manufacturers use different protocols for traffic analysis data. So, Auvik is able to use multiple flow protocols just in case it is operating on a site that has devices from multiple providers. The tool communicates with IPFIX, NetFlow, sFlow, and J-Flow.
Download: Access a 14-day FREE Trial
Official Site: https://www.auvik.com/#trial
OS: Cloud-based
2. Paessler PRTG Network Monitor (FREE TRIAL)
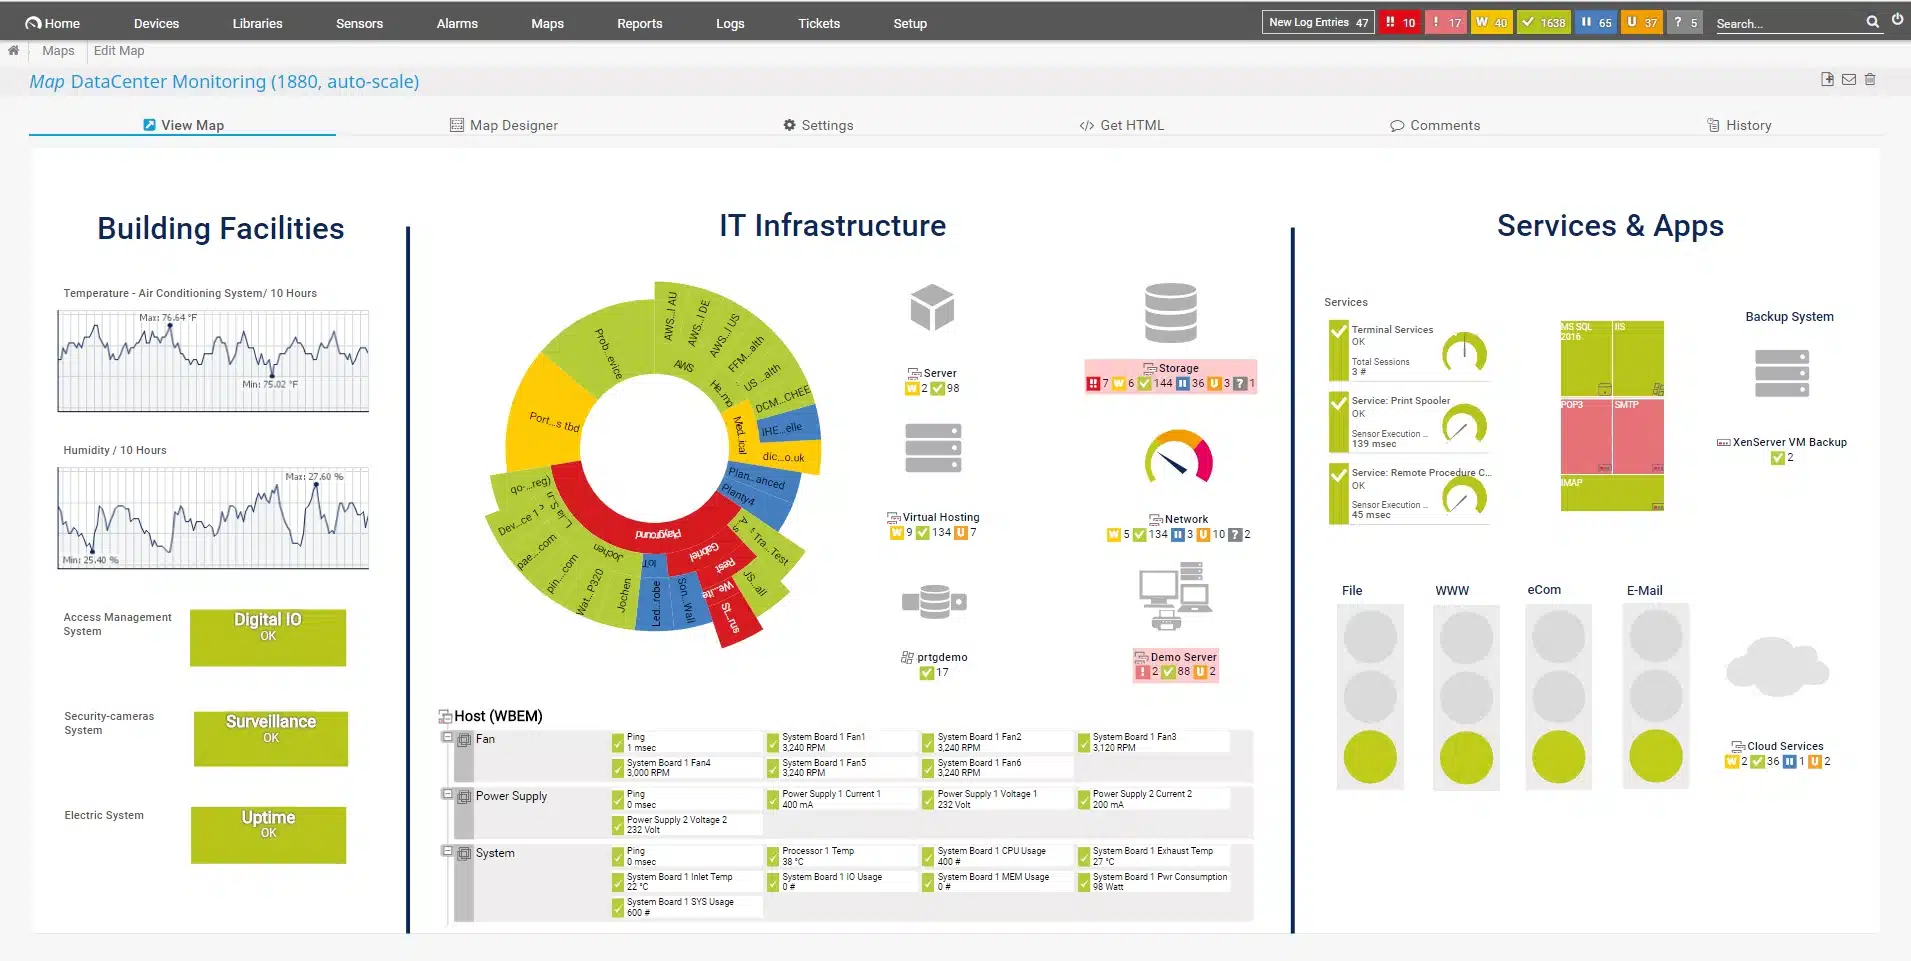
Paessler PRTG Network Monitor is a customizable package of monitors. Each monitor is called a “sensor” and there are many, many of them in the bundle. You choose which of them to turn on. They cover many aspects of network, server, and application monitoring.
Key Features:
- Automatic Discovery: Feeds inventory creation and network mapping
- SNMP-Device Polling: Constant status reports
- Free for Small Networks: For up to 100 sensors
Why do we recommend it?
Paessler PRTG Network Monitor also covers servers and applications. The network monitor starts by discovering all devices on the network. It then compiles a hardware inventory. The discovery process repeats, so the inventory is automatically kept up to date. The system also provides an automatically drawn network topology map.
The network monitoring sensors include an SNMP system. This will automatically discover all of your devices and start polling. Among the service in this package are an asset inventory and a dynamically generated network topology map.
If you activate sensors for server and application monitoring as well as the network device monitoring tool, it will create a great dependency map, which is known as the Sunburst View. The package also has sensors for wireless networks, virtual systems, and network traffic monitoring. All of the metrics that the service tracks can have thresholds set on them and the PRTG system will also process SNMP Trap messages.
The PRTG system installs on Windows Server. The pricing of the package depends on the number of sensors that you want to activate. Everyone receives the same software bundle that contains the coding of all sensors. You can activate your purchased number of sensors.
Who is it recommended for?
Like the SolarWinds system, PRTG relies on SNMP for device status polling. That provides alerts for discovered problems. So, this is a good choice for large businesses that need to keep technician timesheets under control. However, this package is also good for small businesses because there is a Free edition that will provide 100 sensors.
Pros:
- Deployment options: Run it on Windows Server or access the SaaS version on the cloud
- Wireless network mapping: Discovers all APs
- Expandable to server and application monitoring: Choose which sensors to turn on
Cons:
- Doesn’t include any network management functions: No network configuration management
If you only want to use 100 sensors, the PRTG system is free to use. You can get a 30-day free trial of PRTG with all sensors active.
3. ManageEngine OpManager (FREE TRIAL)

ManageEngine OpManager is an on-premises package that tracks the performance of network devices and servers. The tool uses SNMP to identify all devices and compile a network asset inventory. The mapping functions of this tool are extensive and offer a range of formats, including floorplan and rack layouts.
Key Features:
- SNMP-Based: Discovers all devices on the networks
- Alerts for Performance Issues: Drawn from SNMP Traps and load problems
- Includes Server Monitoring: Activate SNMP in the operating system
Why do we recommend it?
ManageEngine OpManager is a package of network device and endpoint monitoring services. You don’t get network traffic monitoring with this unit – you need the NetFlow Analyzer for that. However, you do get SNMP-based device discovery and status checking. The package will raise an alert if problems are detected.
The OpManager tool includes an alerting mechanism with notifications that can be sent out by email, SMS, Slack, or web alarms. Alerts can be custom-built on combinations of conditions and it is also possible to set up remediation playbooks for automated responses.
OpManager can monitor virtual systems and wireless networks as well as LANs. The tool includes the ability to examine specific links or play through performance end-to-end between two points on a network.
Who is it recommended for?
ManageEngine offers a Free edition, which only monitors three devices. The smallest paid package covers 10 devices and it won’t break the bank, so that is the plan that small businesses would go for. Two higher plans cater to mid-sized and large businesses and there is also an edition for MSPs.
Pros:
- System Documentation: An inventory and a network topology map
- Network Testing Utilities: Ping and Traceroute
- Options for WAN Monitoring: In the top plan
Cons:
- Needs to be Hosted: Runs on Windows Server, Linux, AWS, and Azure
The OpManager system is offered in several editions. One of these is free but it will only cover three devices. There is also an edition for monitoring WANs and a multi-tenant package for MSPs. The software installs on Windows Server and Linux. You can experience OpManager with a 30-day free trial.
4. Site24x7 (FREE TRIAL)

Key Features:
- SaaS Platform: Based in the cloud
- SNMP-Based: Autodiscovery, asset inventory, and network mapping
- Bundled with Network Traffic Monitoring: Also server and application monitoring
Why do we recommend it?
Site24x7 is a similar platform to the Datadog system. The big difference between the two is that Site24x7 offers packages of modules rather than charging for each unit individually. The platform includes both network device monitoring and traffic analysis tools. You also get server and application monitoring in each plan.
The cloud-based system is flexible. The base account gives you a limited number of network credits and if you need to monitor more, you buy add-on credits for more network interfaces. The network monitor gives you an SNMP system, which includes autodiscovery, asset inventory creation, and network mapping. The typical package also offers NetFlow analysis to track traffic flows on each link of the network, examining the load on each switch or router.
Who is it recommended for?
This system is suitable for any type or size of business. The plans are sized and priced to be suitable for small businesses and larger companies pay a supplement for more capacity. A Site24x7 supplies all of the monitoring tools to cover an entire IT system, including cloud services.
Pros:
- Network Testing Tools: Troubleshoot device problems
- Alerts for Unattended Monitoring: Generated from SNMP Traps and performance statistics
- Cloud-Hosted Console: Accessed through any standard Web browser
Cons:
- Base Packages Don’t Offer Much Capacity: Pay extra for more
Site24x7 is structured in packages that combine network monitoring with server, application, and Web services monitors. You can try the system with a 30-day free trial.
5. Obkio

Obkio is a SaaS platform that implements network discovery and continuous network activity monitoring. The device monitoring service in the package is based on the Simple Network Management Protocol (SNMP).
Key Features:
- Real-Time Monitoring: Assesses traffic flows.
- Network Device Monitoring: Based on SNMP.
- Distributed Agents: Identifies activity on multiple sites and across the internet.
Why do we recommend it?
Obkio provides both network device monitoring and network traffic analysis. Often these two perspectives record different consequences of a single event. For example, an overloaded switch interface leads to dropped packets and jitter, which are two of the factors that the traffic analyzer detects. This system is able to monitor internet connections as well.
Obkio’s live performance data and alerting mechanism should head off traffic irregularities by catching the device faults that cause them. The system will raise an alert if a problem is detected and the tool can be set up to forward those warnings to technicians by email, Teams, Slack, or Pagerduty.
The Obkio system is able to measure the performance of connections across the internet. These can be links to other sites or to cloud services. This means that the Obkio system is a good choice for managing WANs, enabling SASE and SD-WAN configurations to be run successfully.
Who is it recommended for?
Businesses that rely on regular network performance, such as those that use VoIP or video streaming applications particularly need this tool. The internet monitoring services in the package are going to appeal to businesses that have multiple sites and also those that use cloud-based services extensively.
Pros:
- Real-Time Alerts: Get notifications by email, Slack, Teams, or Pagerduty.
- Cloud and On-Premise Monitoring: Suitable for multi-site businesses and hybrid environments.
- Historical Data Insights: Implement trend analysis.
Cons:
- Focused on Monitoring: Lacks in-depth automation or remediation features.
Obkio provides four plan levels: Starter, Basic, Premium, and Enterprise. Obkio offers a 14-day free trial of the Premium edition.
6. Datadog Network Device Monitor
Datadog Network Device Monitor is a cloud-based service that is part of a wider platform of monitoring tools. There is also a Network Performance Monitoring package available, which is a bandwidth tracking service.
Key Features:
- Hosted on the Cloud: A SaaS package
- Can Monitoring Multiple Networks: Uses SNMP
- Includes Live Network Topology Map: Requires discovery from the Infrastructure module
Why do we recommend it?
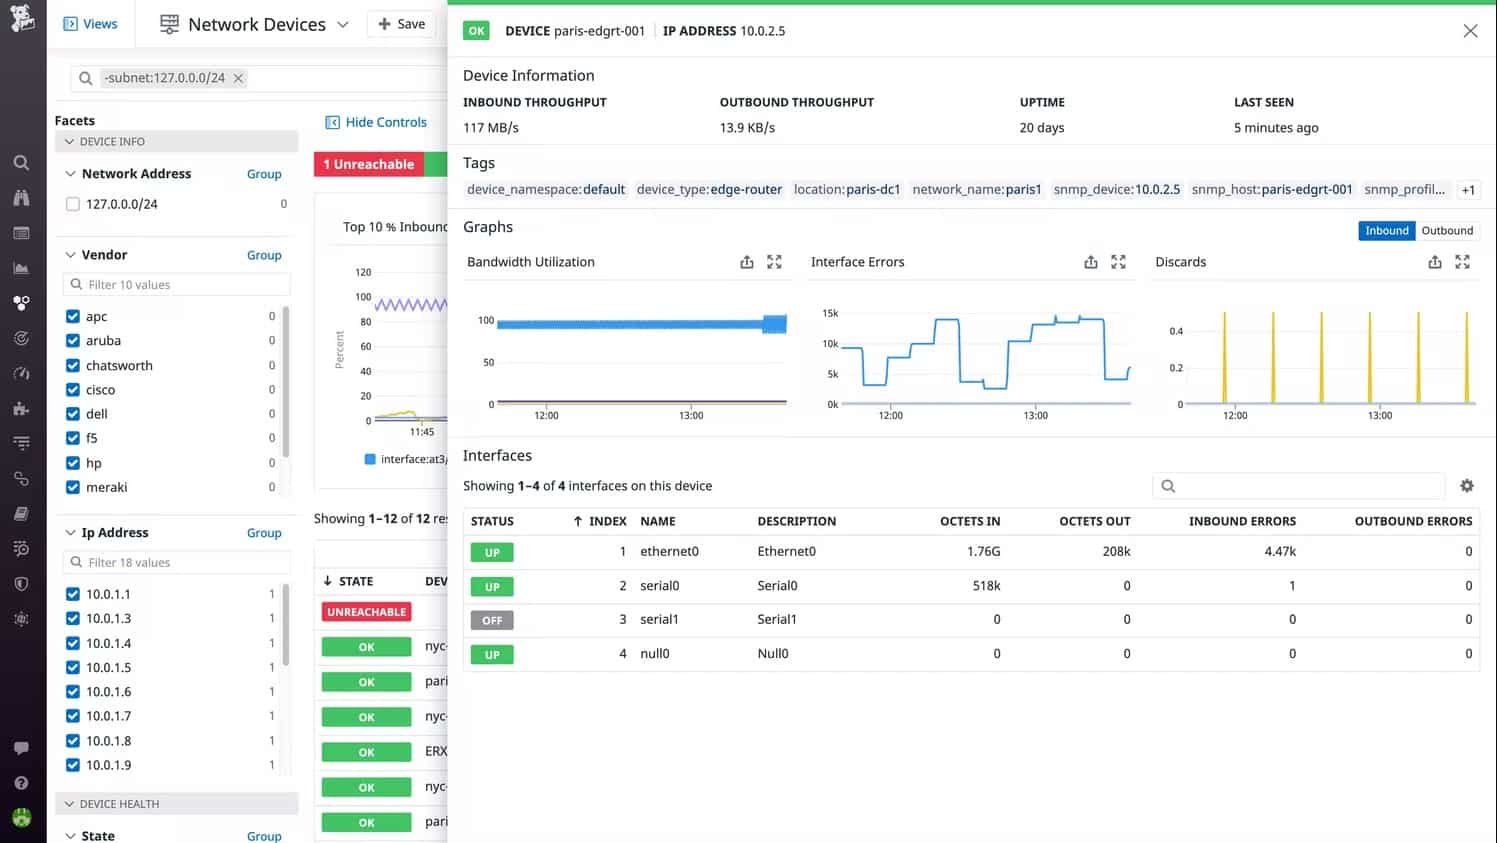
The Datadog Network Device Monitor is one of two network monitoring options on the Datadog cloud platform – the other is the Network Performance Monitor. The package provides device discovery, inventory management, and automatic topology mapping. This system records any network device status issues. Combine the two network monitoring units for full observability.
The Network Device Monitor reaches out to any network and it is possible to monitor multiple sites within one account. Each LAN’s data is channeled through an on-site agent, which acts as the SNMP Manager. The service creates an overview for all enrolled networks, which means you can take a single glance at all of your network devices. Network discovery, asset inventory creation, and mapping are all automated.
The service also includes a system of thresholds that you can specify on any of the metrics to generate alerts and it also gives you alerts if any Traps are received.
The Network Device Monitor’s screens can be customized and the service also covers wireless networks.
Who is it recommended for?
This package is suitable for any business that has more than a single-room office. The package is particularly powerful when combined with the Network Performance Monitor, which gives you a view of traffic patterns. You also need to subscribe to the Infrastructure Monitoring module in order to use the Network Device Monitor.
Pros:
- Alerting System: Generated from SNMP Traps and performance metrics
- Customizable Dashboards: Access it through a Web browser
- Will Exchange Data with Other Datadog Monitoring Modules: Works alongside the Network Performance Monitoring unit
Cons:
- Requires the Infrastructure Monitoring module: Provides network discovery
You can access the Datadog Network Device Monitor for assessment with a 14-day free trial. Datadog also offers an application performance monitoring system and Web applications synthetic and real user monitoring. All of these are offered on a free trial.
7. Αtera

Atera is designed to support managed service providers. The SaaS platform offers both PSA tools for managing the MSP and RMM tools for use by technicians. This is a multi-tenant service that deploys an agent on each monitored site.
Key Features:
- Remote Monitoring and Management (RMM): A package of tools
- Multi-Tenant Architecture: Suitable for managed service providers
- Plans for IT Departments: Different contents to the MSP plans
- Automated Monitoring: Networks, endpoints, and applications
- Network Discovery: As an add-on
Why do we recommend it?
Atera is a cloud-based package of remote monitoring and management (RMM) systems. The platform includes a network monitoring service that focuses on the statuses on network devices. This is an SNMP-based system and it will raise an alert if device agents report problems. This is a great cost saver for support team managers.
The Atera network monitor uses SNMP to detect network devices and compile an inventory. It also has a network mapping system. Alerts are included so each technician can cover multiple clients simultaneously and there are also remote access and patch management tools in the bundle.
Who is it recommended for?
Atera produces two versions of its platform. One of these contains all of the RMM systems plus team management tools and this is designed for use by IT support departments. The other includes professional services automation (PSA) tools as well as the RMM and this is for use by managed service providers (MSPs).
Pros:
- Multi-Site and Multi-Client Monitoring: Monitors the networks of multiple businesses in one account
- SNMP-Based Network Device Scanning: Receives continuous status reports
- Generates Alerts: Based on SNMP Traps or network performance issues
- Network Device Troubleshooting: Availability tests with Ping
- Software Management: Discovery and patch management
Cons:
- Network Discovery Costs Extra: Not a core component of any plan
There are three plans for Atera that make the platform accessible for freelance support operators, medium-sized businesses, and large organizations. Pricing starts at $129/month per technician. You can get the system on a free trial.
8. SolarWinds Network Performance Monitor
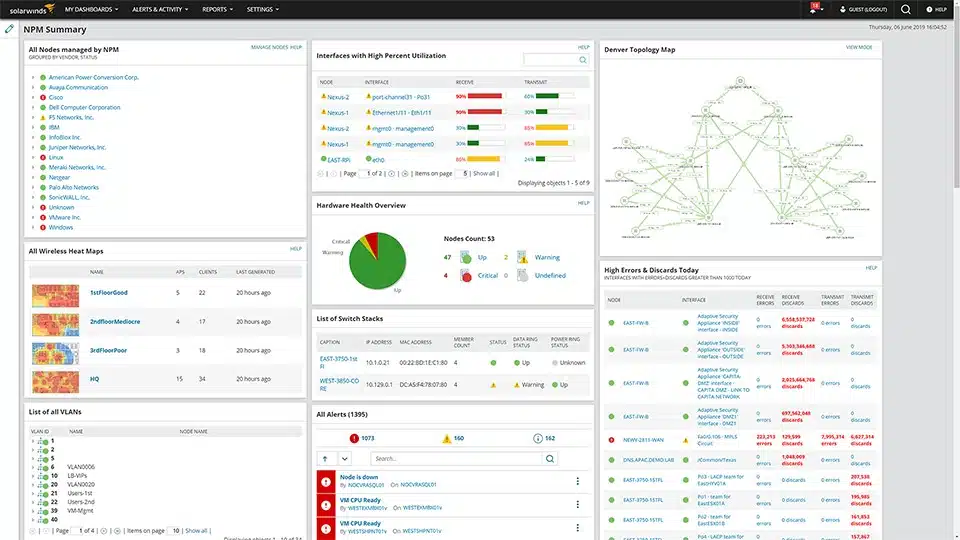
SolarWinds Network Performance Monitor is a downloadable software package that installs itself and searches through the network to populate its screens. The secret behind all of this automation is the SNMP system. Once the initial network sweep has been completed, you get details about all of your network devices listed in a network inventory and you can switch over to the network map straightaway.
Key Features:
- Network Discovery: Repeats to keep information current
- Network Asset Inventory: Also network topology mapping
- Live Performance Monitoring: SNMP-based
Why do we recommend it?
SolarWinds Network Performance Monitor provides device discovery and inventory creation. The network inventory forms the basis of a network topology map and re-scans of the network update the inventory and automatically re-configures the map. The service uses SNMP to gather device status information and will raise an alert if a problem arises.
The SNMP cycle provides live network performance data and those polls also update the inventory and the map, so if you add, move, or remove any device, that change is automatically accounted for in the Network Performance Monitor.
The Home screen for the system provides summaries for all of your devices. This also includes a panel for current alerts. The tool can be calibrated to filter out low-priority alerts, such as warnings and you can also set up forwarding rules to get emails sent out if problems arise. The system can also channel alerts through SolarWinds Help Desk as tickets.
SolarWinds Network Performance Monitor also covers wireless networks and has a great wireless signal heatmap feature. SolarWinds produces other tools on the same platform as the Network Performance Monitor and they all interact if you buy several of them.
SolarWinds Network Performance Monitor is a long-established system, which means that it is very stable and bug-free. This is an on-premises package that runs on Windows Server and it can automatically scan, document, and map any network by polling devices for live data through SNMP processes. The Network Performance Monitor will also track the activity on wireless networks and virtual systems.
Who is it recommended for?
This package provides network monitoring automation and so cuts out a lot of work for technicians managing the network. Larger businesses will get more value for money out of this package than smaller businesses by freeing up human resources for other tasks. The software package runs on Windows Server.
Pros:
- Multi-Channel: Monitors wireless networks as well as LANs
- NetPath: A path analysis utility
- Includes Alerts as an Early Warning System: Generated from SNMP Traps and performance statistics
Cons:
- No SaaS Version: Only available for Windows Server
The software for SolarWinds Network Performance Monitor runs on Windows Server and you can examine it with a 30-day free trial.
Network device monitoring FAQs
What is the network monitoring tools?
Network monitoring tools scan network devices from problems and also extract performance statistics, such as total capacity and throughput for interfaces, memory, and CPU. These tools can then compile the data about network devices into a network asset inventory, a topology map, and live traffic analysis. When stored, the statistics about network activity allow demand trend analysis for capacity planning. Knowing the capacity of each device enables network monitoring tools to raise alerts when the load approaches that level. This gives technicians time to head off a serious impact on delivery speeds by rerouting, prioritizing, or blocking certain types of traffic.
What are the four 4 categories of network monitoring?
Four types of network monitoring are:
- Availability monitoring to check that all devices connected to the network are functioning
- Network performance monitoring to identify status problems that can slow traffic down
- Security monitoring to ensure that devices have not been tampered with to enable intrusion
- Internet connection monitoring for traffic that needs to leave the local network to reach cloud services, remote workers, or other sites.
Is Ping a network monitoring tool?
Ping is a network utility that operates as an active network monitoring system. Most of the commercial network monitoring packages that you can buy – and also free network monitoring tools – have Ping at the core of their systems to check on IP address allocations and keep constant checks on network speeds and device availability.
