
Ping monitoring is one of the go-to techniques that an administrator uses to check the availability and responsiveness of network devices. But what is it?
How Ping Monitoring Tools Work
Ping monitoring is where a user pings a device and waits for a response. The monitor then assesses the connection strength based on the response time.
Ping monitoring tools automate the process of sending ICMP echo requests (pings) to multiple devices at regular intervals, typically in real-time or at predetermined intervals (e.g., every minute). These tools collect and analyze the ping responses to provide information about the status and performance of the monitored devices.
Here is our list of the best ping monitoring software tools:
- ManageEngine Applications Manager – Best for multi-site/cloud app monitoring (free for small).
- SolarWinds Ping Sweep (Engineer’s Toolset) – Best for network admins managing medium+ LANs.
- Domotz – Best for multi-site businesses and MSPs.
- Nagios XI – Best for all but smallest networks (multi-site options).
- Pingdom – Best for global website/service availability checks.
- EMCO Ping Monitor – Best for small businesses tracking availability/response.
- PingInfoView – Best for occasional Windows troubleshooting.
- Power Admin Server Monitor – Best for multi-site technicians with in-house needs.
Primary Functions of Ping Monitoring Tools
The main purpose of a ping monitoring tool is to track the uptime and responsiveness of network devices. It can detect when a device becomes unreachable or experiences increased response times. The tool may generate alerts or notifications when certain thresholds, such as packet loss or high latency, are exceeded, allowing network administrators to promptly address any issues.
The best ping monitoring software tools
Our methodology for selecting ping monitoring tools
We reviewed the ping monitoring tools market and analyzed the options based on the following criteria:
- The ability to sweep a network periodically on a schedule
- The option to target one device of a range of IP addresses
- Availability results in graphical format
- Alerts for contact attempt failure
- Ping results storage for long-term performance analysis
- A free tool or a free trial period for no-cost assessment
- Utilities that add value to a network administrators toolkit at a fair price
We also looked at the robustness of the tool in terms of diverse industry use cases, reliability, documentation and support, ease of use, and software updates and maintenance.
Feature Comparison Table:
| Product/Features | Paessler PRTG | Site24x7 | ManageEngine OpManager | ManageEngine Applications Manager | SolarWinds Ping Sweep | Domotz | Nagios XI | MCO Ping Monitor | PingInfoView | Power Admin |
|---|---|---|---|---|---|---|---|---|---|---|
| Real-time monitoring | Yes | Yes | Yes | Yes | Yes | Yes | Yes | Yes | Yes | Yes |
| Alerts and Notifications | Yes | Yes | Yes | Yes | Yes | Yes | Yes | Yes | No | Yes |
| Reports | Yes | Yes | Yes | Yes | Yes | Yes | Yes | Yes | No | Yes |
| Traceroute | Yes | No | No | No | No | No | Yes | No | No | No |
| Multi-protocol | Yes | No | Yes | No | No | No | Yes | No | No | No |
| IPv6 Support | Yes | No | No | No | No | No | Yes | No | No | No |
| Customizable intervals | Yes | Yes | Yes | No | Yes | No | Yes | Yes | Yes | Yes |
| Ease of setup | Medium | Medium | Medium | High | High | High | Low | High | High | Medium |
| Multi-Platform | Windows | Web-based | Windows, Linux | Windows Server, Linux, AWS, Azure | Windows | Cloud-based | Windows, Linux | Windows | Windows | Windows |
| Free trial or free version | 30-day | 30-day | 30-day | 30-day and Free edition | Yes | Yes | No | Yes (Limited) | Full version is free | Yes (Limited) |
1. Paessler PRTG Network Monitor (FREE TRIAL)
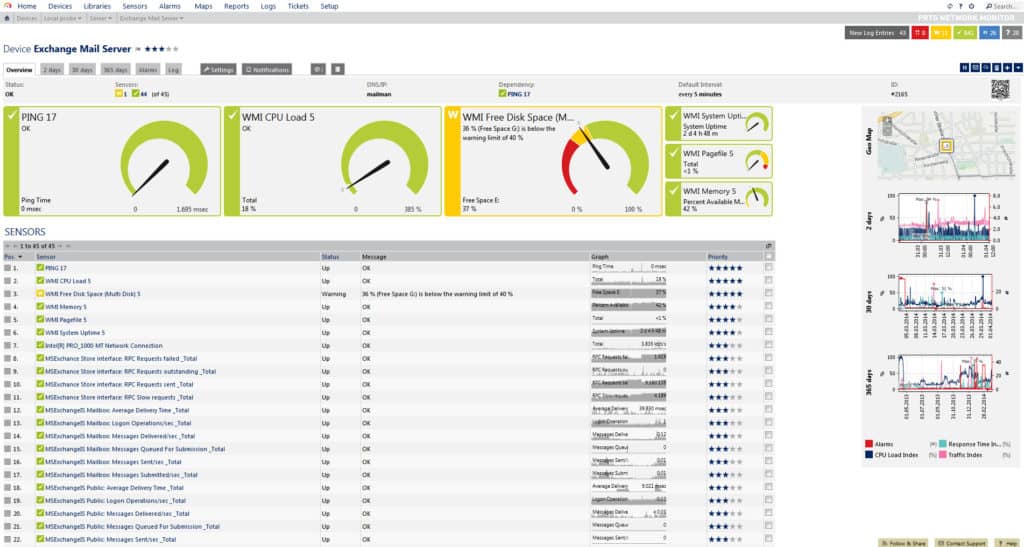
Paessler PRTG Network Monitor is a very popular network monitoring tool that delivers a first-class ping monitoring experience. PRTG Network Monitor pings devices in your network to measure their availability. With this tool, you can scan for devices to scan by IP range. PRTG Network Monitor offers many different sensors that can be used for ping monitoring; these include the Ping Sensor, Ping Jitter Sensor and Cloud Ping Sensor.
When we tested Network Monitor we found the following key features.
Key Features:
- Centralized Management: Provides a central console for monitoring ping results from various devices on your network.
- Jitter Statistics: Measures and reports jitter, which is crucial for maintaining quality in VoIP (Voice over Internet Protocol) services.
- Transmission Speed Reports: Provides reports on transmission speeds to assess network performance.
- Jitter Detection: Capable of detecting jitter, which is beneficial for monitoring and optimizing VoIP services.
- Live Status Graphs: Displays real-time status graphs for easy monitoring and analysis.
Why do we recommend it?
Paessler PRTG offers a number of Ping tools within its bundle that are suitable for testing local networks and for checking on the speed and reliability of internet connections between sites.
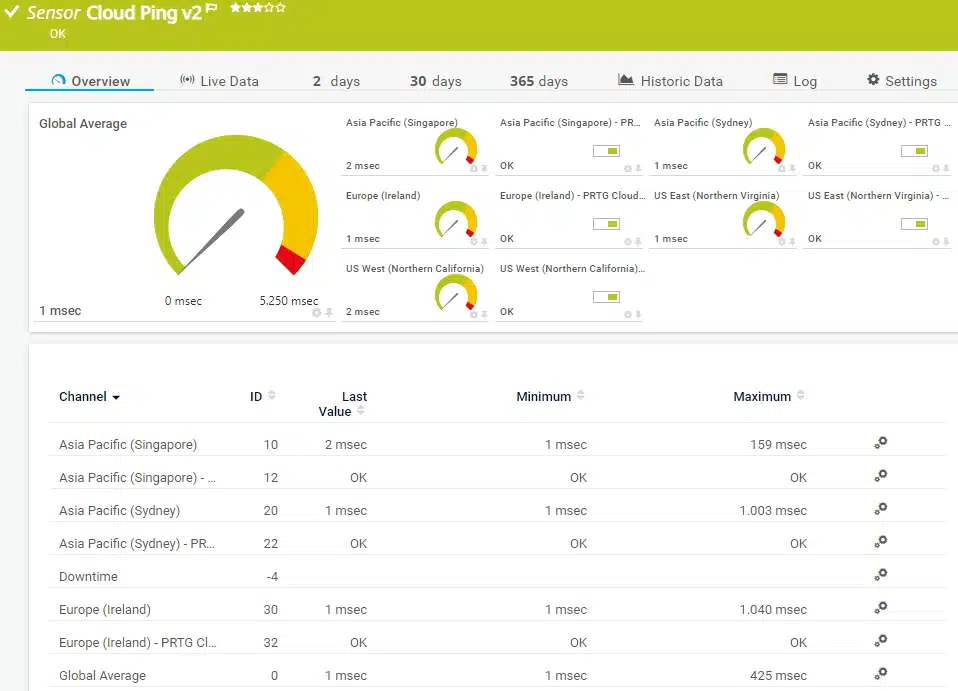
The advantage of this sensor model of network monitoring is that it provides you with lots of detailed information. Each sensor has its own pane where you can choose between live and historic data before viewing the results on the dial displays. The Ping Sensor provides you with the basics such as ping time, minimum ping time, maximum ping time, and the percentage of packet loss. This provides you with the basic information you need to see if there’s a problem with a device.
However, Paessler PRTG Network Monitor also allows you to monitor for more advanced ping concerns like jitter. The Ping Jitter Sensor allows you to measure how much network jitter there is on your network. This sensor shows the statistical jitter value and the execution time of requests. Monitoring for jitter is especially important in environments with important services like VoIP phones. Of course, PRTG Network Monitor also has notifications to alert you if any particular thresholds are exceeded.
Who is it recommended for?
PRTG is suitable for businesses of all sizes because you can choose which of its services to turn on. With local and remote Ping options, the service is useful for both single-site and multi-site businesses. The free version means that even very small businesses can benefit from this tool.
During our testing, we identified the following pros and cons related to PRTG.
Pros:
- Flexible Sensor Usage: Utilizes flexible sensors to monitor various metrics such as ping, network performance, application health, and server status.
- Customizable Sensors: Allows customization and tailoring of sensors to specific applications or network requirements.
- Scalable Pricing Model: Pricing is based on the number of sensors used, enabling both large enterprises and small businesses to scale their monitoring needs effectively within the PRTG ecosystem.
Cons:
- Learning Curve: The platform is feature-rich, requiring time to learn and fully utilize all its features and functionalities effectively.
PRTG Network Monitor is also available for free for your first 100 sensors. However, those with larger networks will need to purchase one of the paid versions. The paid versions of PRTG Network Monitor range from $1,750 (£1,380) for 500 sensors to $15,500 (£12,200) for unlimited sensors. There is also a 30-day free trial of PRTG Network Monitor.
EDITOR'S CHOICE
Paessler PRTG Network Monitor is our top pick for a Ping monitoring tool because it uses Ping in a number of ways. The core of the PRTG system is its network discovery service and inventory documentation system. This routine uses both SNMP and Ping. Once SNMP discovers a list of devices, Ping checks through periodically to ensure that all of those devices are online – if a device develops a fault that stops it from communicating, SNMP just won’t see it. The Ping test confirms that a previously known device has gone and records that issue. Ping is also available as a troubleshooting tool. Use it to test a route across the network or to probe a remote device across the internet. The downloadable software package is only available for Windows Server, which might prove a problem for companies that only have Linux servers. However, Paessler provides an alternative deployment option, which is its SaaS platform.
Download: Download a 30-day FREE Trial
Official Site: https://www.paessler.com/download/prtg-download
OS: Windows Server and cloud
2. Site24x7 Website Monitoring (FREE TRIAL)
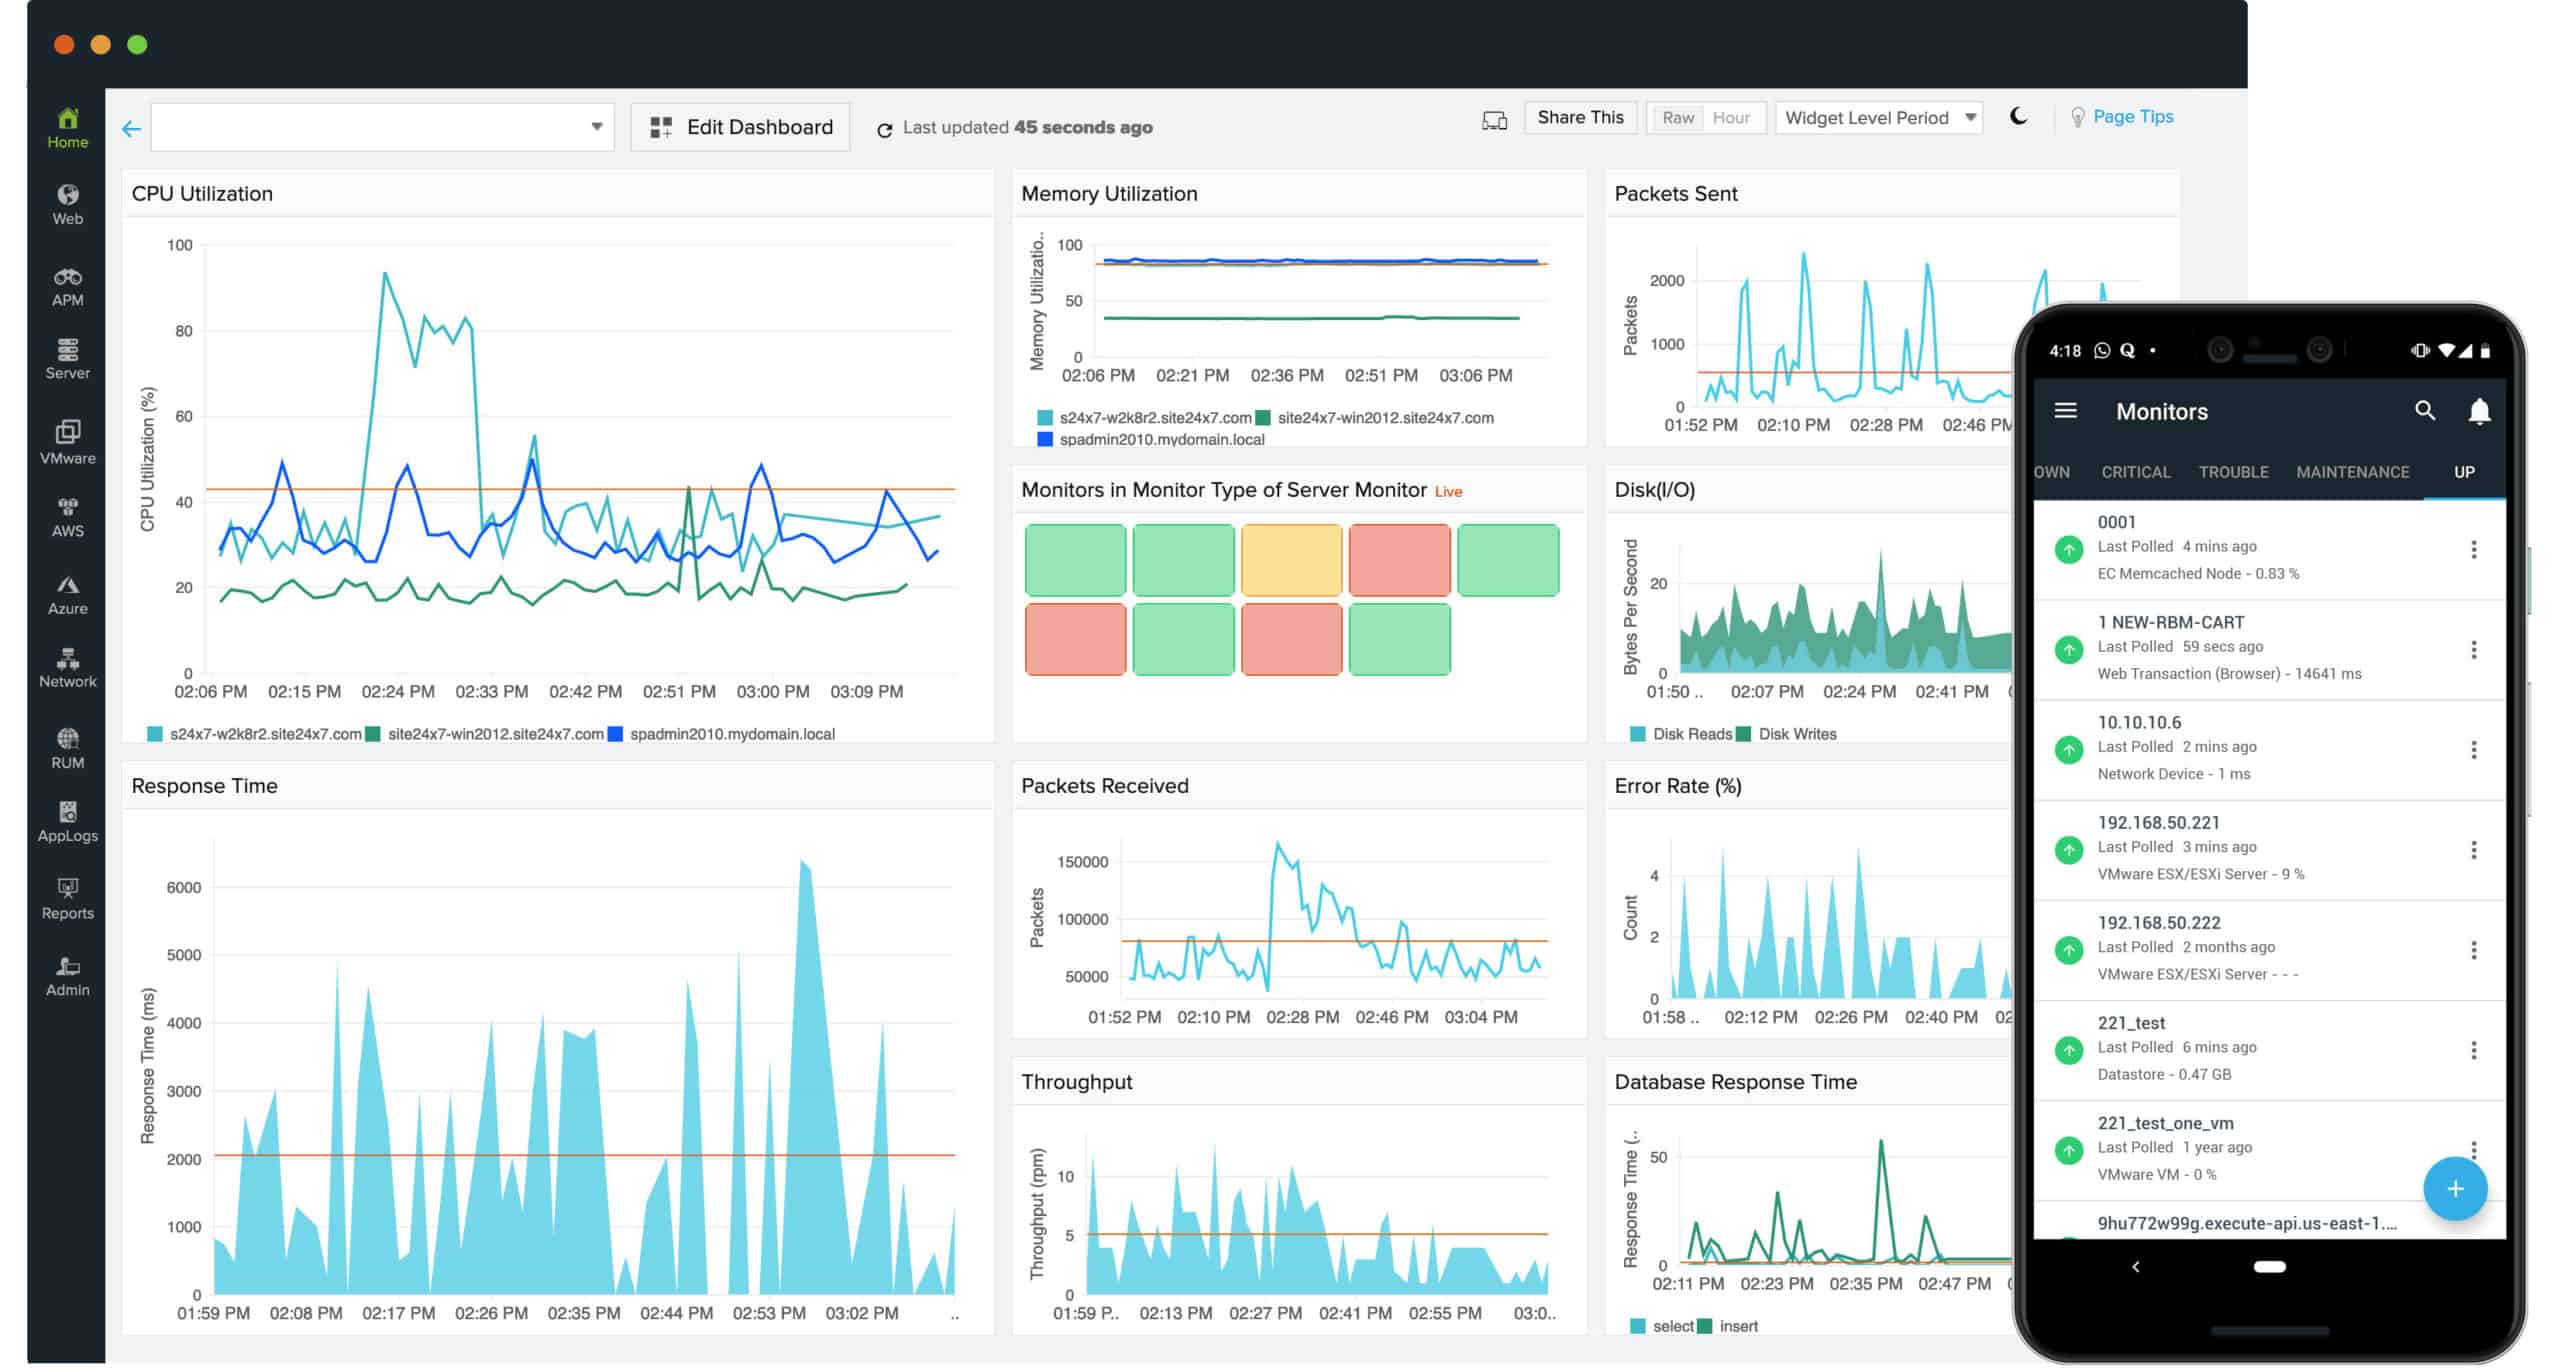
Site24x7 is a cloud-based service that monitors IT infrastructure, applications, and website performance, user behavior. The focus of this tool is the performance of all IT services. The multiple layers of services needed to support a website mean a failure in one element will impact on the performance of the public-facing web presence.
When we tested Site24x7 Website Monitoring we found the following key features.
Key Features:
- Comprehensive Performance Measurement: Capable of measuring latency, jitter, and performance trends over time, making it suitable for long-term monitoring needs.
- DNS Resolution Monitoring: Can differentiate between DNS resolution and IP address queries, providing insights into network performance.
- Multiple Testing Locations: Conducts tests from more than 110 locations worldwide, providing a global perspective on website performance.
- Excellent User Interface: Boasts one of the best user interfaces among ping monitoring tools, enhancing usability and navigation.
Why do we recommend it?
The Site24x7 Website Monitoring service is offered as part of a bundle of different services, so you get network, server, and application monitoring tools as well. This combination allows you to keep automated checks on the availability and performance of all of the infrastructure that supports your websites while getting availability reports on the sites themselves.
The speed that data travels around a network and across the internet is a very important factor in the successful delivery of a web page. Ping measures the roundtrip time from one point to another over a connection.
Site24x7 operates from 110 locations around the globe, which gives customers of the service a view of the speed of delivery of their sites to all corners of the earth. The speed statistics delivered by Site24x7 include DNS time, connection time, first-byte time, download time, and SSL handshake time.
Apart from checking on internet speeds, the Site24x7 makes sure that systems administrators get early warnings when equipment problems are likely to impact on the delivery of websites. The service constantly scans the statuses of servers, the network, and supporting applications. These checks, together with security protection of website coding, enable web enterprises to continue to successfully deliver information, services, and goods to site visitors.
Who is it recommended for?
If you run multiple websites and you are constantly stretched for time, you would benefit most from the Site24x7 service. This is because its concurrent infrastructure monitoring provides alerts that warn of evolving performance issues. So, you can head off disaster before it happens and keep your sites available.
During our testing, we identified the following pros and cons related to Site24x7 Ping Monitoring.
Pros:
- Cloud-Based: Operates in the cloud, allowing for easy access and management from anywhere.
- Mobile App Support: Provides a mobile app for both Android and iOS platforms, enabling monitoring on the go.
- Free Version: The free version supports up to five websites, making it an attractive option for smaller businesses to get started with monitoring.
Cons:
- Feature Complexity: Due to its feature-rich nature, Site24x7 may require time to explore all customization options and features thoroughly.
There is a free version of Site24x7 which is limited to monitoring five websites or servers. Four paid editions give potential subscribers a choice of modules. All of the paid editions of Site24x7 can be tested on a 30-day free trial.
Further Reading: Site24x7 – Full Review
3. ManageEngine OpManager (FREE TRIAL)

ManageEngine OpManager uses Ping and the Simple Network Management Protocol (SNMP) to track down network devices, test their response times, and log their statuses. The system shows live performance data on its dashboard and raises alerts if issues arise on the network. Those alerts can be set up to forward notifications to the operations staff when problems occur.
When we tested OpManager we found the following key features.
Key Features:
- Device Monitoring: Regularly checks for device availability to ensure continuous monitoring.
- Ping and SNMP Monitoring: Leverages both ping and SNMP protocols for comprehensive uptime and performance monitoring.
- Topology Mapping: Builds an automatic network topology map, aiding in identifying new devices and potential security threats like rogue access points.
- Automatic Network Topology Mapping: Creates network topology maps automatically to visualize device connections and relationships.
- Server Monitoring: Extends monitoring capabilities to include servers in addition to network devices.
Why do we recommend it?
ManageEngine OpManager is a general system availability monitor that integrates Ping into its network discovery and availability tests. The system is mainly based on SNMP for device checks but those reports are supplemented by information from continuous Ping sweeps.
The OpManager system operates an autodiscovery process, which identifies all connected devices and logs them in a network inventory. The system also automatically draws up a network topology map from the discovery data. Both the network inventory and topology map are live and so get automatically updated whenever you make changes to the network.
This monitoring service is able to identify and map virtual services as well as physical resources. It discovers all virtualizations and watches their resource usage. It will also monitor server resources. All of these monitoring systems operate simultaneously, while network monitoring is also going on. These constant performance checks lighten the load of operation staff, making the IT data center more efficient and cost-effective.
The OpManager service will track the performance of key application servers, such as Web server, Active Directory, mail servers, and VoIP systems. It acts as a Syslog server and collects Windows Events messages, consolidating log files to enhance performance and security monitoring.
Who is it recommended for?
OpManager is an automated device monitoring service that covers servers as well as network devices. As such, it is suitable for all types of business except for the very smallest. The Free edition would appeal to those very small businesses. However, anyone with just three devices wouldn’t need all of the functionality of this monitoring system.
During our testing, we identified the following pros and cons related to OpManager.
Pros:
- Autodiscovery Functionality: Utilizes autodiscovery to detect new devices for monitoring and manages inventory effectively.
- Real-Time Network Performance Tracking: Monitors network performance metrics in real-time to identify issues promptly.
- Log Collection: Capable of collecting logs, providing detailed information beyond basic ping monitoring tools.
- Provides Insights: Offers detailed insights into device and network performance, suitable for IT professionals managing complex environments.
Cons:
- Technical Focus: Designed for IT professionals and may not be as user-friendly for non-technical users or those unfamiliar with network monitoring tools.
ManageEngine OpManager is available in four editions: Free, Standard, Professional, and Enterprise. The Free edition is limited to monitoring only three devices but you can monitor 10 with the Standard and Professional plans and 250 with the Enterprise plan. The Enterprise edition extends the capabilities of the monitoring package to cover multiple sites. The software for OpManager installs on Windows Server and Linux and you can get it on a 30-day free trial.
Related post: How to Fix Packet Loss
4. ManageEngine Application Manager (FREE TRIAL)
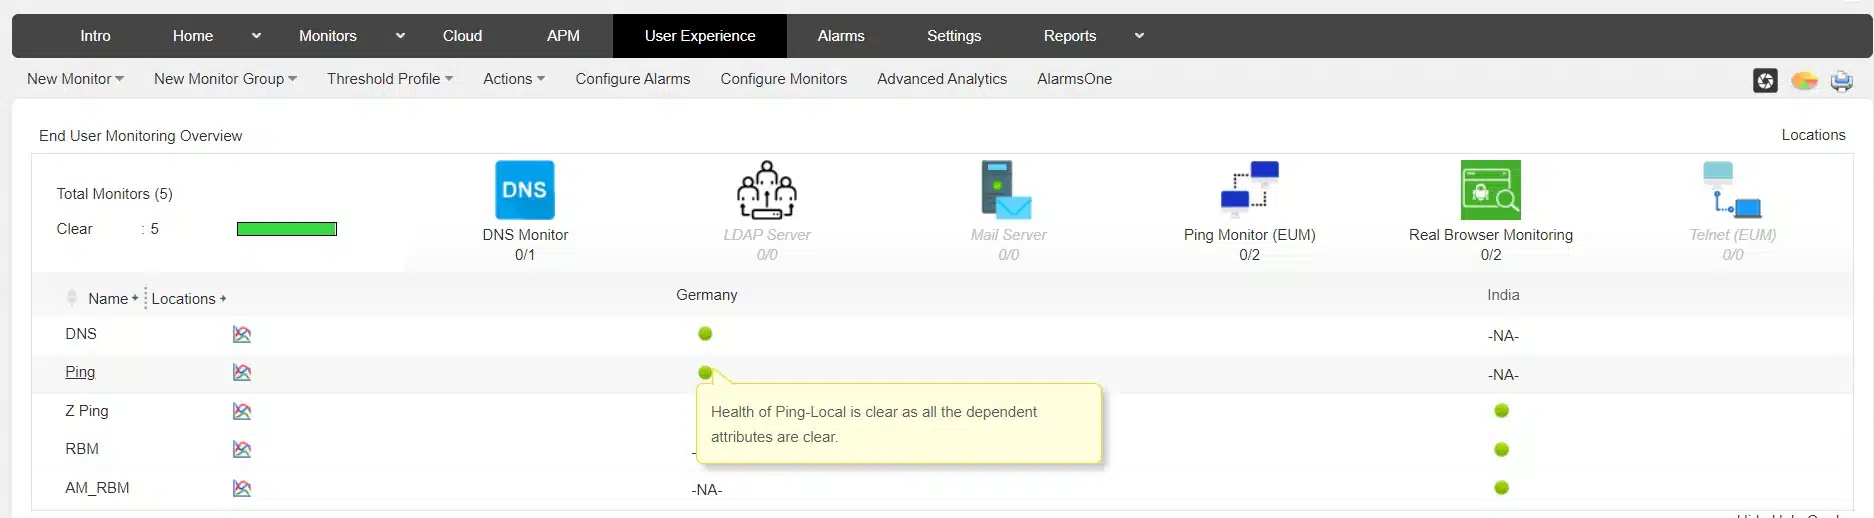
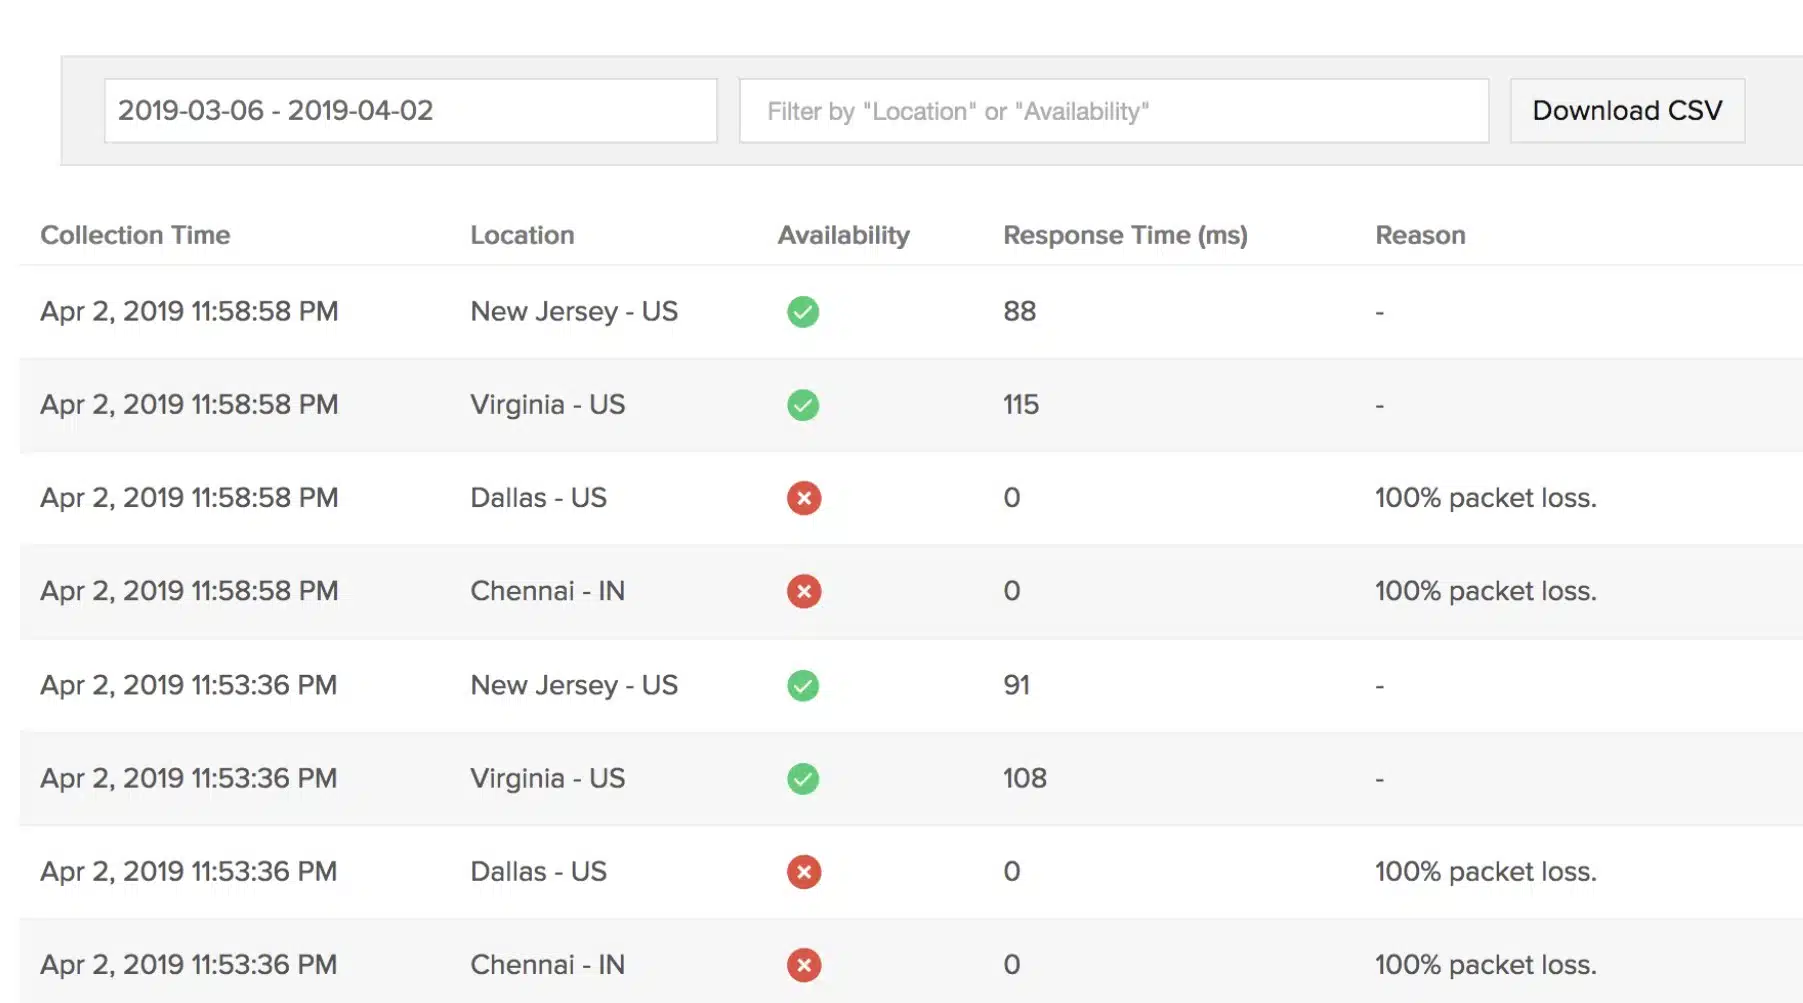
ManageEngine Applications Manager provides a monitoring system for servers, services, applications, and software. One of its screens examines general system performance statistics, which is called the User Experience monitor. The page lists overall system health metrics and includes Ping.
When we tested Application Manager we found the following key features.
Key Features:
- Ping Summary: Provides a summary of ping test results, indicating network connectivity status.
- Detailed Ping Report Page: Offers detailed reports on ping tests, including response times and packet loss.
- Availability Alerts: Sends alerts when there are issues with application availability or network connectivity.
Why do we recommend it?
ManageEngine Applications Manager provides many automated monitoring utilities and they include a Ping monitor. This service presents an availability status that is calculated by Ping. Drill down further to get a detailed view of Ping tests. The tool can be set up to constantly test connections to specific locations.
The system administrator needs to set up the Ping monitor to test connections to specific locations, such as branch offices. The Ping tests run continuously and it is possible to set up an alert to raise if the Ping tests fail. The administrator can specify that the connection should be tried a couple of times more to confirm a broken connection before raising the alert.
The Ping alert and all of the other performance alerts in the Applications Manager package can be set up as notifications that can be sent to specific technicians by email, SMS, or Slack message. This frees up staff for other tasks and improves productivity.
Who is it recommended for?
The Applications Manager can monitor software running on multiple sites and also on cloud platforms. The tool is also able to monitor serverless microservices through distributed tracing. So, it is suitable for use by any business and there is a Free edition for small businesses to monitor five assets.
During our testing, we identified the following pros and cons related to Applications Manager.
Pros:
- Constant Ping Tests: Conducts ongoing ping tests to specific locations, ensuring continuous monitoring of network performance.
- Connection Quality Overview: Provides an overview of connection quality, helping to identify and troubleshoot network issues.
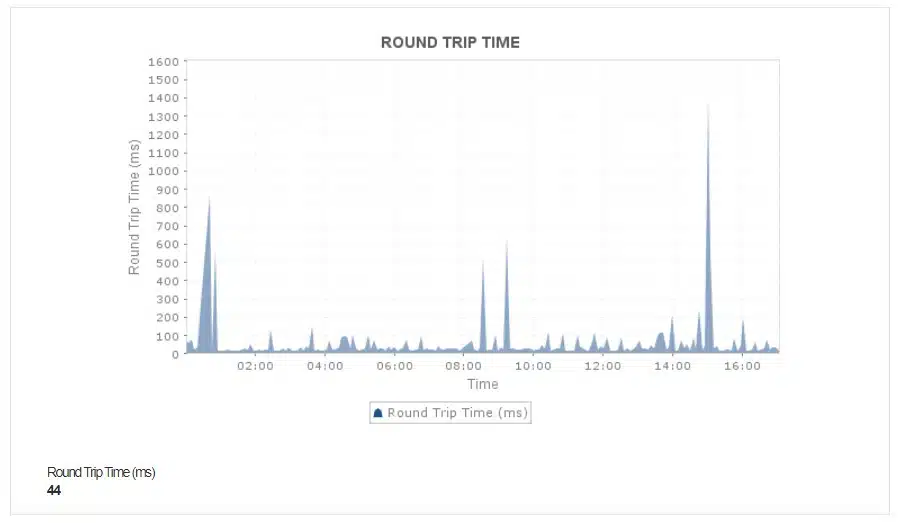
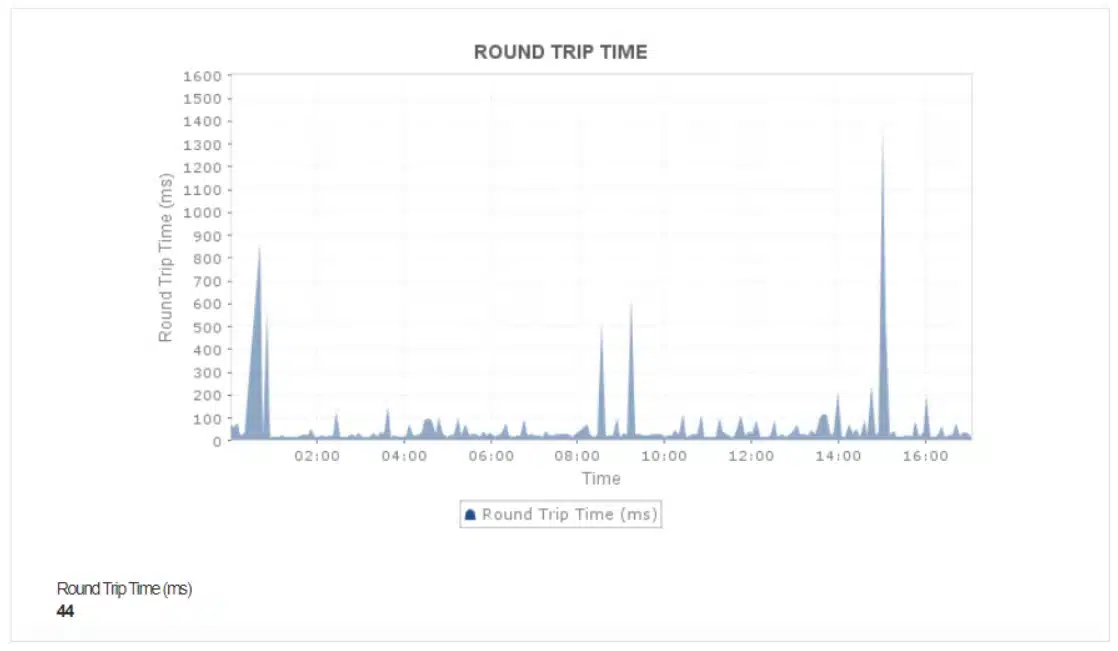
- Detailed Graphs and Charts: Presents data in detailed graphs and charts for comprehensive time-series analysis, aiding in performance assessment and trend identification.
Cons:
- Dashboard Placement: The ping summary feature might be located on a back page of the dashboard, potentially leading to it being overlooked or missed by users.
ManageEngine provides three editions for the Applications Manager with a Free edition that will monitor five assets. The Professional edition will monitor a single network and the Enterprise edition provides multi-site coverage. The software package will install on Windows Server or Linux or you can get the tool on AWS Marketplace or Azure Marketplace. You can examine Applications Manager with a 30-day free trial.
Related post: Ping Sweep Tools
5. SolarWinds Ping Sweep tool with Engineer’s Toolset
The SolarWinds Ping Sweep tool performs a recursive Ping routine on a list or range of IP addresses. The information pulled back from this ping utility gives you insights into the devices on your network and the performance of your DHCP and DNS servers as well as reporting on the transfer speeds to all of your network’s endpoints.
When we tested Ping Sweep we found the following key features.
Key Features:
- Ping Sweeping: Sends ping requests to a range of IP addresses or a subnet to identify active devices on your network.
- Real-Time Results: Displays results in real-time, showing which IP addresses are reachable and their response times.
- Network Autodiscovery: Automatically discovers devices on the network, aiding in network mapping and inventory creation.
- DNS and DHCP Verification: Helps verify DNS (Domain Name System) and DHCP (Dynamic Host Configuration Protocol) functionality across different devices on the network.
- Performance Alerts: Alerts users about performance issues or anomalies detected on the network.
- Comprehensive Toolset: Includes a suite of other tools designed to assist network administrators and technicians in managing and troubleshooting networks effectively.
Why do we recommend it?
SolarWinds Ping Sweep is a great utility to have for ad-hoc tests of device availability. It will also let you see very easily if there are gaps in the allocation of IP addresses. This service also performs DNS resolution, which lets you know if your DNS server is functioning properly.
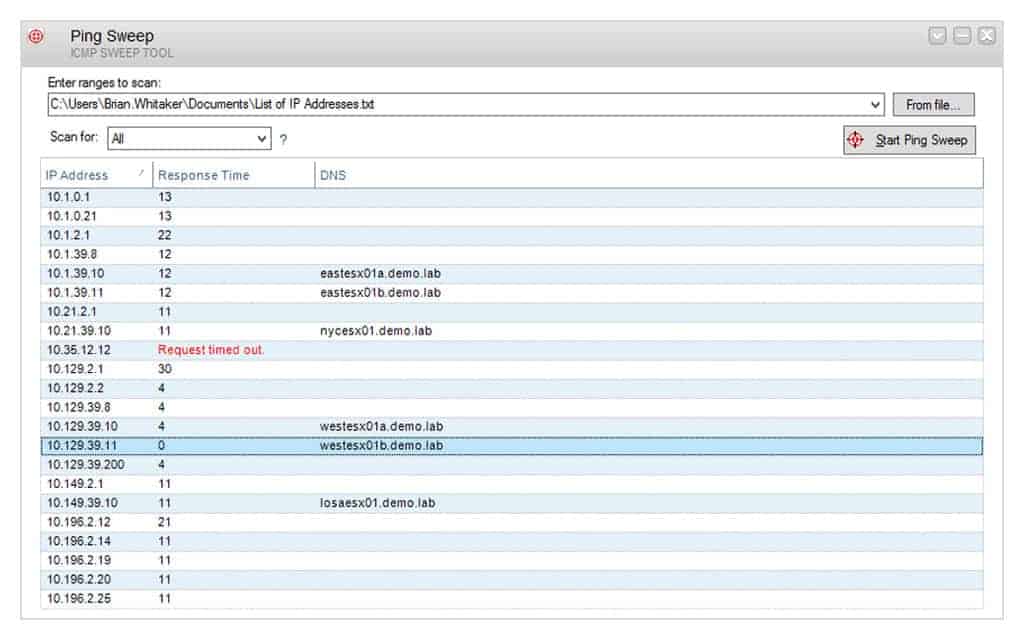
The tool requires a list of IP addresses as a parameter. However, it is possible to load these in from a text file or you could enter a range that goes from the lowest possible IP address up to the highest possible IP address. This won’t result in an endless list because you can specify to filter out non-responsive addresses from the results table.
The Ping Sweep lists all IP addresses in the scan or just those that responded. In each record, the results screen shows the response time to the node and its hostname, which gets referenced out of the DNS server. This simple report tells you where there might be problems. For example, a blank hostname shows that the address is missing from your DNS server.
The results can be exported out to a CSV, TXT, or XLS file so that you can import them into other utilities for analysis and comparison with data from other sources.
Who is it recommended for?
Any network administrator for all but the smallest networks will benefit from using this tool. It is specifically used for testing LANs, so if you operate a virtual office with no local resources, you won’t benefit from this tool.
During our testing, we identified the following pros and cons related to Ping Sweep.
Pros:
- Simple and Easy to Use: The interface is straightforward, making it easy to set up and run ping sweeps even for non-technical users.
- Real-time Insights: Provides immediate information on active devices and their response times.
- Live Status Reports: Generates real-time status reports for network devices, helping to monitor their health and connectivity.
Cons:
- Short Trial Period: The 14-day trial period may be insufficient for users to fully explore and evaluate all features and functionalities.
The Ping Sweep tool is part of the SolarWinds Engineer’s Toolset. This is a bundle of more than 60 useful network management and monitoring tools. The SolarWinds Engineer’s Toolset starts at a price of $1,585 (£1,197). SolarWinds offers the entire network bundle on a 14-day free trial, so you can get a look at the Ping Sweep tool and try it out on your network.
6. Domotz
Domotz is a cloud platform that implements automated network monitoring. The system performs constant checks on network devices through SNMP data collection. Each site needs an agent installed on one of its servers to get included in Domotz monitoring. One of the tools in the Domotz package is a Ping service that tests all devices for response times.
When we tested Domotz we found the following key features.
Key Features:
- Ping Monitoring: Allows users to ping one or multiple devices to check their availability.
- Ping Burst or Limited Pings: Provides options to perform ping bursts or limit the number of pings for monitoring.
- Historical Results: Stores historical ping results for analysis and tracking.
Why do we recommend it?
Domotz is able to access a local network from its cloud-based through a local agent. The tool provides network discovery and constant status checks on network devices with SNMP but its availability checks are supplemented by a continuous Ping.
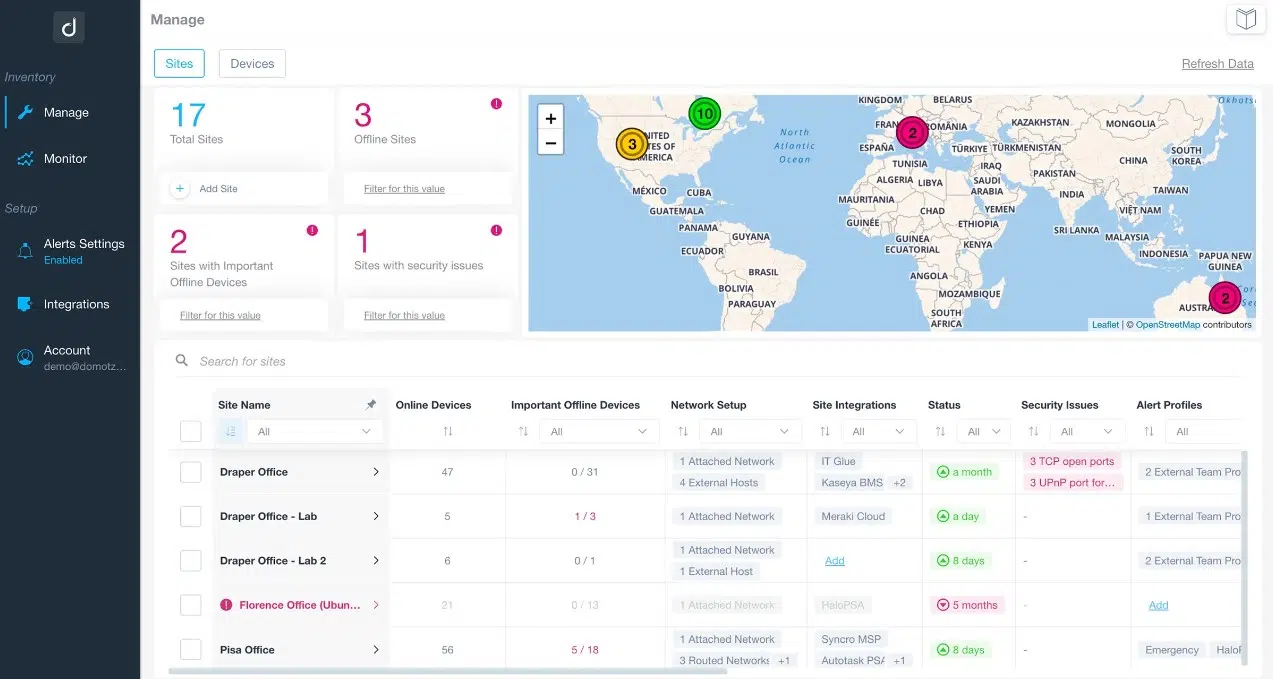
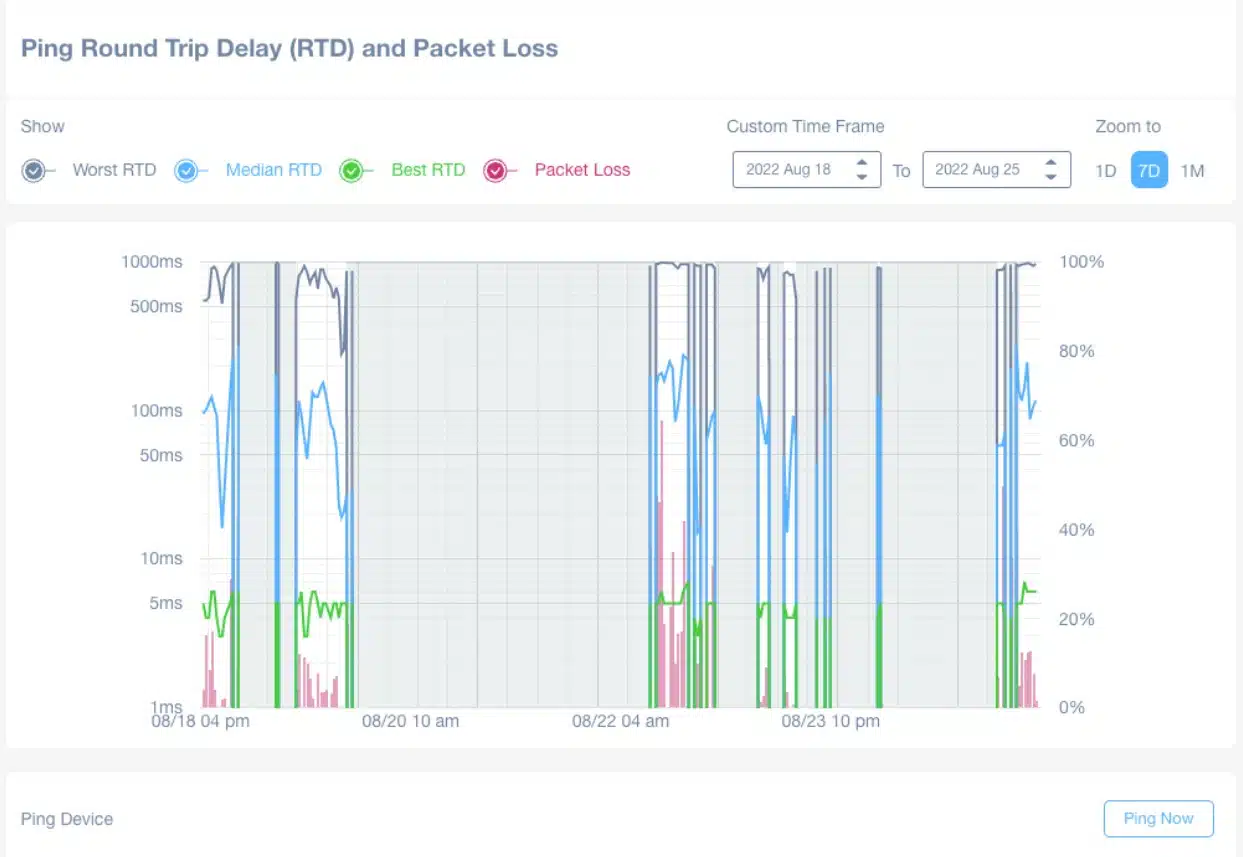
You can enroll multiple sites in one account with Domotz and the service is also available in a multi-tenanted architecture for use by managed service providers. You can even enroll multiple networks in each sub-account. The cloud platform downloads an agent and then starts a discovery phase. It compiles a network inventory and draws up a topology map. These two services are constantly updated.
The Ping monitor in the Domotz platform is an on-demand service. However, it is also possible to launch the test on a repeating schedule. Options include a limited number of Pings or a Ping burst. You can get the service to Ping every single device or just target one of them. The report gives you the response time (roundtrip time) and packet loss. You can specify threshold conditions that will trigger an alert if Ping results are worrying.
Who is it recommended for?
Domotz is one of a number of cloud-based system monitoring tools on this list that perform more or less the same service. So, that group of network monitoring systems should be compared together if that is the type of service that you seek. However, this is a very good choice for multi-site businesses.
During our testing, we identified the following pros and cons related to Domotz.
Pros:
- Fixed Pricing: Offers a fixed price per site regardless of the number of devices, making it cost-effective for monitoring multiple devices.
- Automated Network Monitoring: Provides automated network monitoring capabilities, reducing manual effort for network management.
- Remote Network Management: Enables remote management of networks, allowing administrators to monitor and manage devices from anywhere.
Cons:
- Trial Period: Users may prefer a longer trial period to fully explore the platform’s capabilities before making a purchase decision.
The Domotz system runs on a cloud server and it includes storage space for network data, including Ping statistics, which can be examined in the analysis tools of the platform. You can assess Domotz with a 14-day free trial.
7. Nagios XI
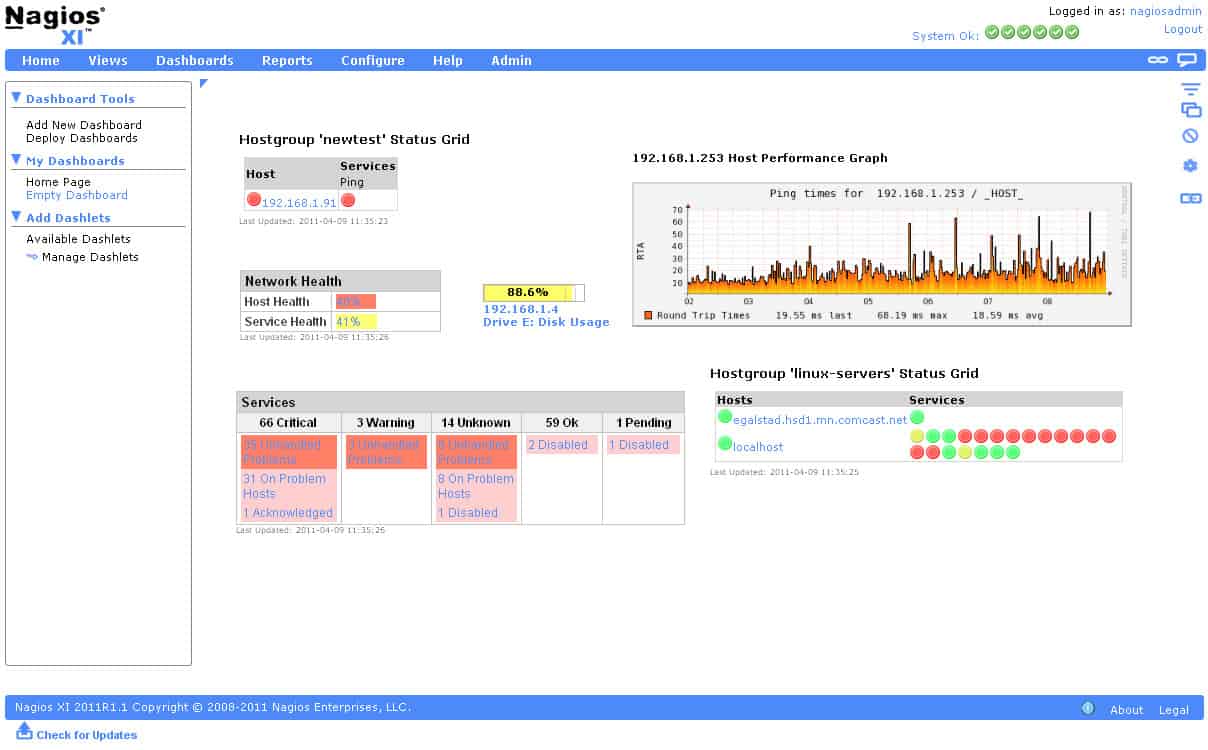
Nagios XI is widely regarded as one of the best network monitoring tools in the world. Yet Nagios XI offers an excellent ping monitoring experience in isolation as well. With Nagios XI you can view the availability of your devices and see how prevalent packet loss is while your network is in transition. This allows you to cut to the nuts and bolts of how well your network devices are performing.
When we tested Nagios XI we found the following key features.
Key Features:
- Network Autodiscovery: Automatically discovers devices on the network, saving time and effort in manual setup.
- Extendible with Plugins: Offers a wide range of plugins to extend functionality and customize monitoring capabilities.
- Constant Availability Checks: Conducts continuous checks to ensure the availability and performance of network resources.
In the course of our testing we found a unique feature with Nagios XI.
The standout feature of Nagios XI is its system of plug-ins. There are thousands of free plug-ins available on Nagios Exchange and these extend the capabilities of the monitoring tool to provide extra functions or monitoring capabilities for specific products.
Why do we recommend it?
Nagios XI is one of a number of on-site network monitors on this list. It provides network discovery, network mapping, and constant device health checks with SNMP. It includes built-in availability tests with Ping that operate constantly and are also available for on-demand troubleshooting.
As a ping monitoring tool, Nagios XI offers a blend of modern network monitoring alongside more classic visual displays, and more advanced displays like network topology maps have also been incorporated. However, if the user design isn’t to your taste then you can customize the layout for each user. This ensures that users have complete control over how to monitor their network.

For smaller organizations, Nagios XI can be downloaded for free on RHEL Linux and CentOS. You can also use Nagios XI on Microsoft but you will have to do so through the use of a VMware workstation or alternative service. As a result, Nagios XI is most simple when deployed within a Linux environment.
Who is it recommended for?
Nagios XI is recommended for all but the smallest networks. Choose the Standard Edition for a single network or the Enterprise Edition if you have multiple sites to monitor.
During our testing, we identified the following pros and cons related to Nagios XI.
Pros:
- Centralized Monitoring: Offers a central platform to monitor the reachability and response times of your devices through ping checks. This eliminates the need to check individual devices
- Monitor Ping Response Times: This allows you to identify potential network performance issues like latency or congestion before they significantly impact your users or applications.
- Customization: You can set thresholds for response times, define schedules for checks, and customize alerts based on severity or specific devices.
- Linux/RHEL Compatibility: Well-suited for environments using Linux or Red Hat Enterprise Linux.
Cons:
- Antiquated Interface: Some users may find the user interface outdated compared to modern monitoring tools.
- Windows Virtualization Requirement: Requires virtualization to run on a Windows operating system, which can add complexity.
- High Enterprise Pricing: The enterprise version may have high pricing compared to similar products in the market.
There are two paid versions of Nagios XI; Standard Edition and Enterprise Edition. The Standard Edition is the cheaper of the two at $1,955 (£1,550). The Standard Edition provides you with all the basic monitoring capabilities, but if you want to schedule reports and create capacity planning reports, you need to buy the Enterprise Edition. The Enterprise Edition can be purchased for a price of $3,495 (£2,770). You can download Nagios XI on a 30-day free trial.
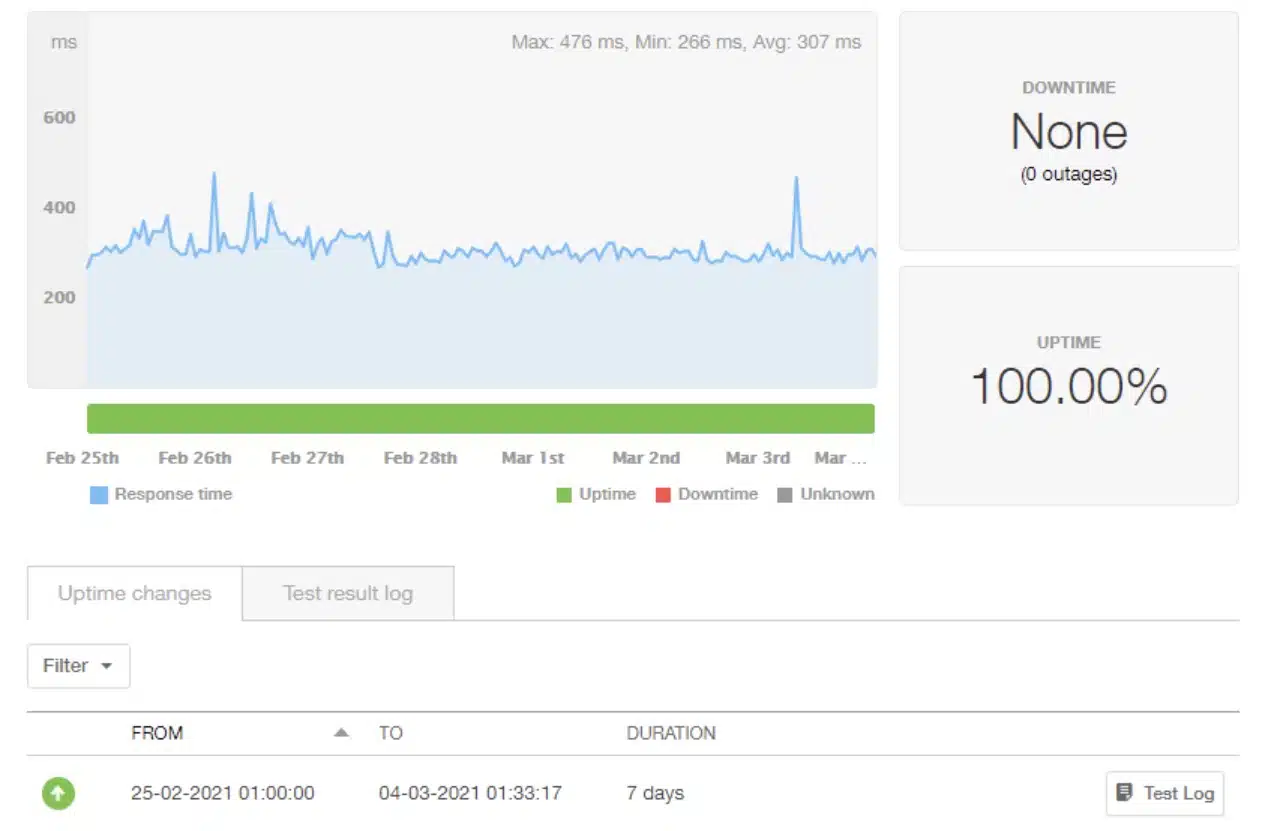
8. Pingdom
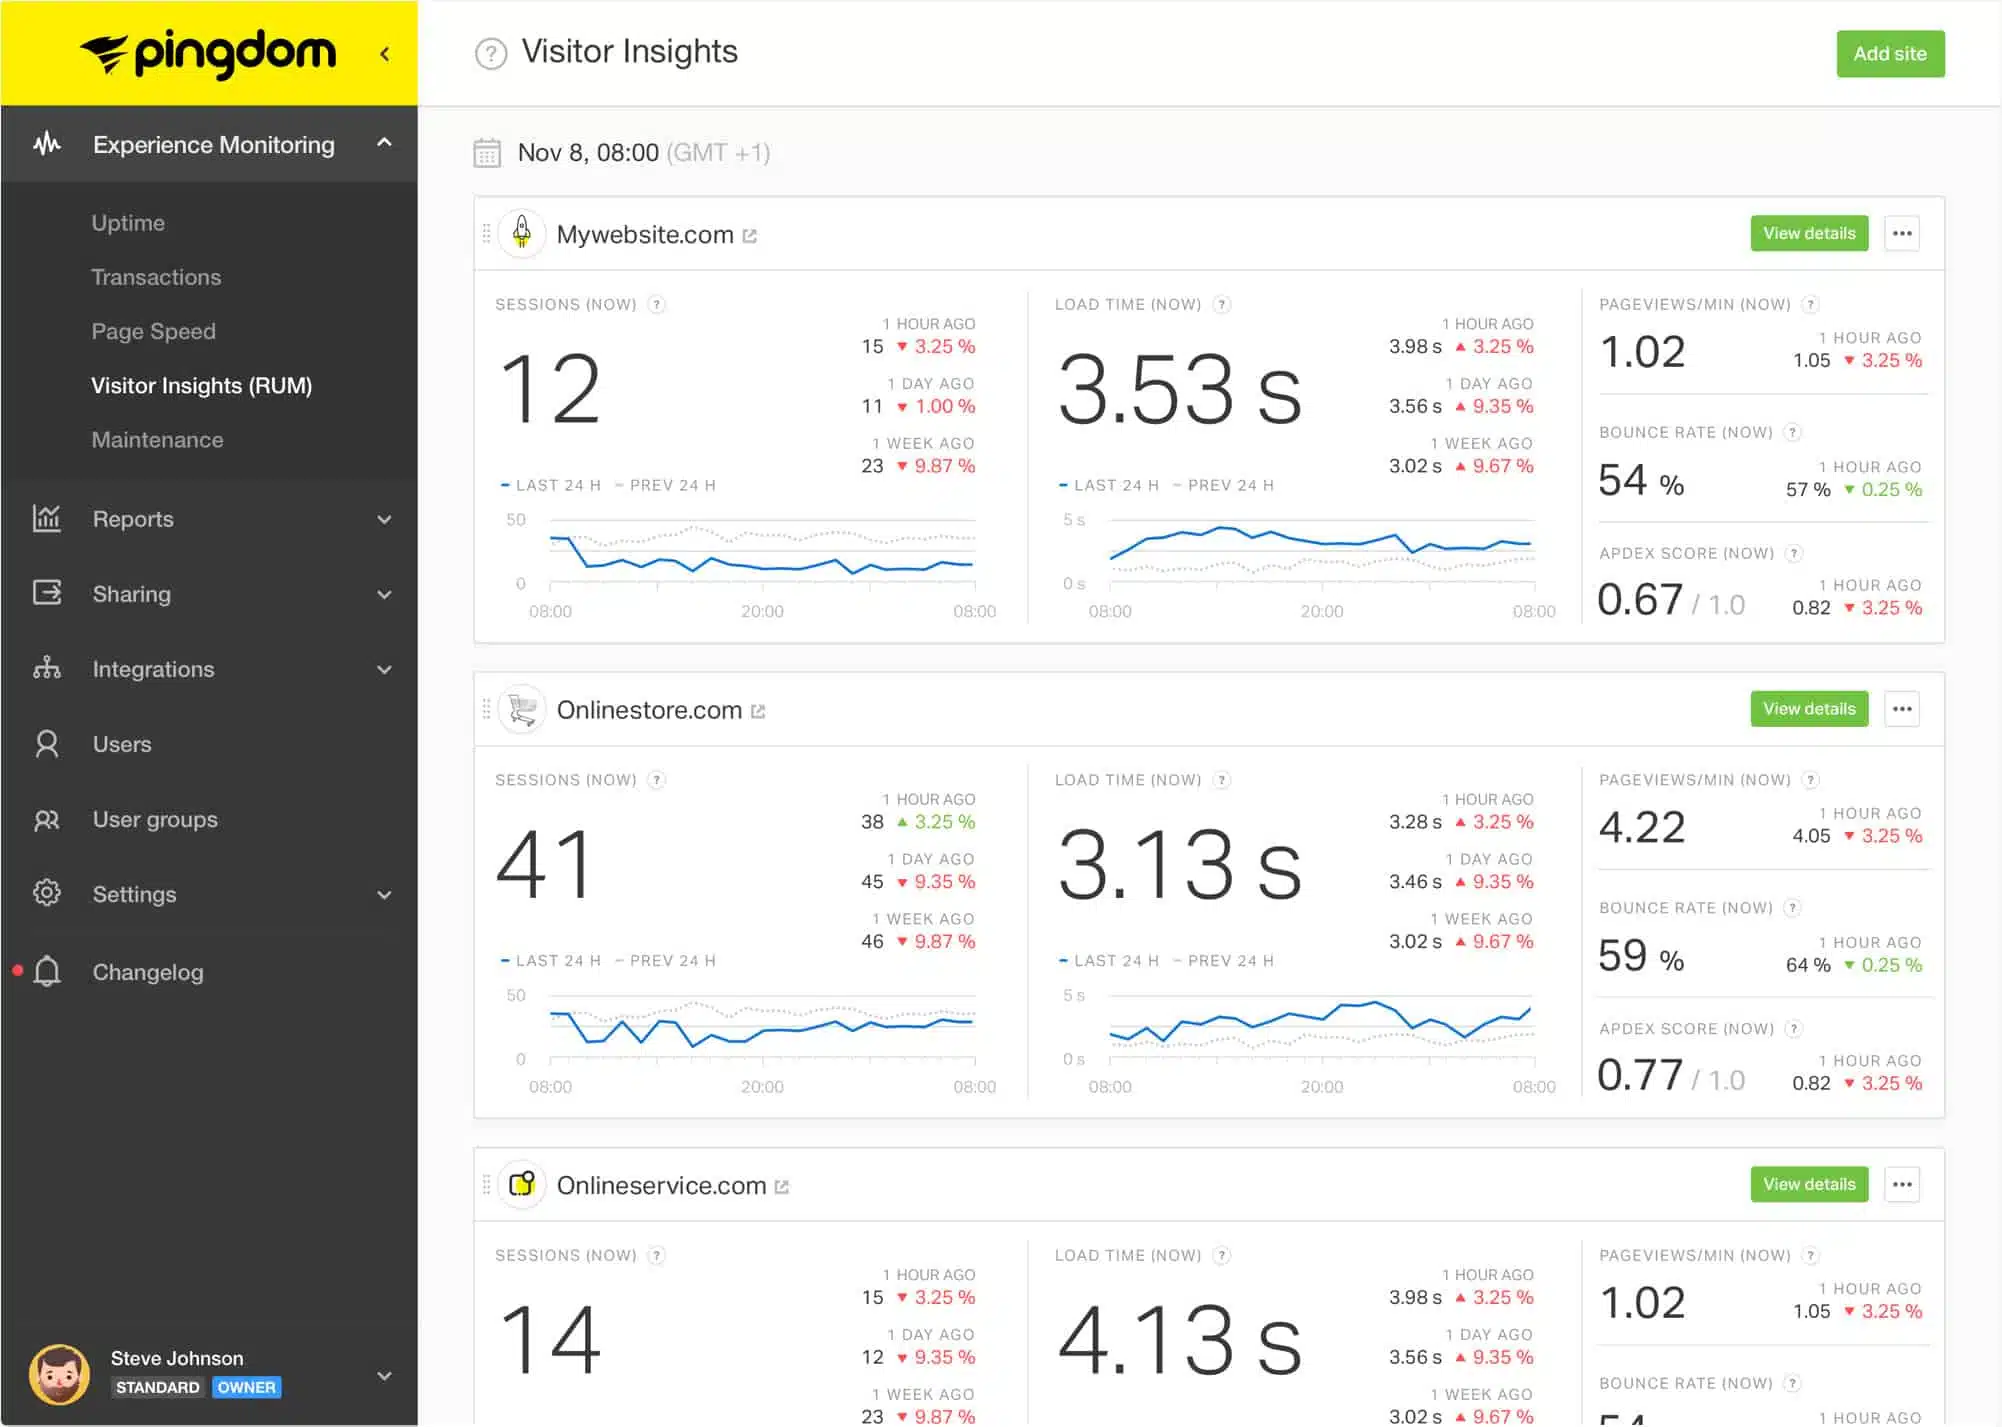
Pingdom is a ping monitor for websites. The only way to be sure that everyone everywhere can get to your site is to test access regularly from many locations around the world. Pingdom is the ideal tool for performing these checks.
When we tested Pingdom we found the following key features.
Key Features:
- External Source Monitoring: Enables monitoring from external locations to simulate user experience from various geographical locations.
- Website Testing: Specifically designed to test and monitor websites for performance and availability.
- Performance Alerts: Generates alerts based on performance thresholds and issues detected during monitoring.
- Global Monitoring: Capable of monitoring from over 1,000 locations globally, making it suitable for applications and services with a worldwide audience.
Why do we recommend it?
Pingdom is a great service for testing your Web assets from different locations around the world. It is very common for administrators to check a site and see that everything is working fine without realizing the website is inaccessible in other parts of the world.
The Pingdom system operates on servers in more than 1,000 locations around the world. As a cloud service, the system doesn’t take up any space on your servers or use up CPU power on your site. Even the dashboard is hosted on the cloud. The service is a little more sophisticated than just a recursive ping execution. It judges response times for sites that are still accessible, so you can get a range of performance metrics out of the service.
The system includes alerts that arise when response times drop or when a testing location is unable to get through to the site. As well as displaying the alert, Pingdom will send out a notification by SMS or email. Pingdom also has an API that funnels alerts, so you can integrate those notifications into any custom application.
Once a problem is detected, the Root Cause Analysis module will perform tests, such as traceroute to work out exactly why the site is unavailable or slow.
Who is it recommended for?
The Pingdom service is aimed at businesses that operate websites or any other service that allows access to users from all over the world. Content Delivery Networks (CDN) and local caching can mean that one relay in the delivery of a network has gone down without anyone realizing it. This can make your website unavailable for an entire continent on the other side of the world without you knowing. Pingdom lets you check availability from 1,000 locations.
During our testing, we identified the following pros and cons related to Pingdom.
Pros:
- Cloud-Based: Operates in the cloud, eliminating the need for complex setup or onboarding processes.
- Accessible Dashboard: Allows access to the monitoring dashboard from anywhere with an internet connection.
- Alerting Options: Provides flexibility in alerting by supporting email, SMS, and integration with custom solutions through APIs.
- Root Cause Analysis: Utilizes root cause analysis to help administrators identify and resolve issues efficiently.
Cons:
- No Self-Hosting Option: Lacks the option for self-hosting, which may be a preference for some organizations with specific security or compliance requirements.
Pingdom is a subscription service and the price is set on a menu with a rate for the number of Synthetic Monitoring actions that you select plus a price for the number of Real User Monitoring credits that you choose. The standard plan doesn’t allow you to choose just Synthetic Monitoring or just Real User Monitoring. However, there is an Enterprise plan available, which is a customized package and that would enable you to subscribe to just one of those two services.
9. EMCO Ping Monitor
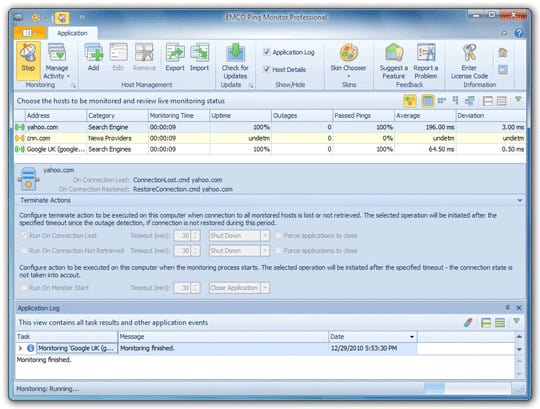
Next up on this list, we have EMCO Ping Monitor which provides one of the most underrated ping monitoring solutions available right now. From the Host Status Overview you can see hosts across your network, their status, ping response rates, and outages information. You can monitor each host in real-time with the help of a color-coded graph to see how your connection changes over time. This provides you with a snapshot perspective so that you can see if there are any pressing issues that you need to deal with.
When we tested EMCO Ping Monitor we found the following key features.
Key Features:
- Ping Monitoring: Sends ping requests to specific IP addresses or hostnames at regular intervals to check reachability and response times.
- Alerting: Generates alerts for failed ping attempts or response times exceeding predefined thresholds, notifying you of potential network issues.
- Host Discovery: Enables the discovery of hosts on the network, aiding in network mapping and monitoring setup.
- Network Performance Reports: Provides real-time reports on network performance metrics such as latency, packet loss, and uptime.
- Automation Scripts: Allows users to create custom automation scripts and scheduled tasks for efficient network monitoring.

Why do we recommend it?
EMCO Ping Monitor provides extensive network monitoring and device checking by using Ping rather than the SNMP service that most of the other network performance monitoring tools that you will encounter.
If you want to look at your network from another perspective then you can look at your historic host data. You simply select the time period that you want to go back to for monitoring. Once you’ve retrieved this information you can create reports to send to other team members in PDF or HTML format. This simple setup keeps you close to what is going on so that you don’t get distracted by more elaborate displays.
One particularly interesting feature offered by EMCO Ping Monitor is the ability to configure scripts. You can configure scripts to run once a network event happens. This is good because it allows you to incorporate a little automation into your monitoring experience. This is supported by the use of alerts that send you email notifications when something changes. EMCO Ping Monitor is available as both a Windows program and Windows service.
Who is it recommended for?
This tool is probably a better choice for small businesses than large organizations. While Ping is able to track availability and response times, it doesn’t provide the device internal status reports that you would get from an SNMP-based monitor.
During our testing, we identified the following pros and cons related to EMCO Ping Monitor.
Pros:
- Report Generation: Offers the ability to generate detailed reports in PDF or HTML format, facilitating analysis and documentation.
- Custom Automation: Users can leverage automation scripts and scheduled tasks to streamline monitoring processes and response actions.
- Flexible Deployment: Can be deployed as either a service or application based on user preferences and system requirements.
Cons:
- Cluttered Interface: The interface may feel cluttered and outdated, potentially leading to a steep learning curve for new users.
- Target Audience: Geared more towards network professionals and users with technical expertise, which may limit its accessibility for less experienced users.
- Windows Compatibility: Available only for Windows operating systems, restricting usage for users on other platforms.
EMCO Ping Monitor is available as a freeware version for up to five hosts. In terms of paid versions, you can purchase the Professional Edition or the Enterprise Edition. The Professional Edition can monitor up to 250 hosts for $199 (£150) per copy or $455 (£343) for unlimited copies. The Enterprise Edition offers unlimited monitoring of hosts and costs $445 (£336) for a single copy and $995 (£751) for unlimited copies. You can also download the free trial version of EMCO Ping Monitor.
10. PingInfoView
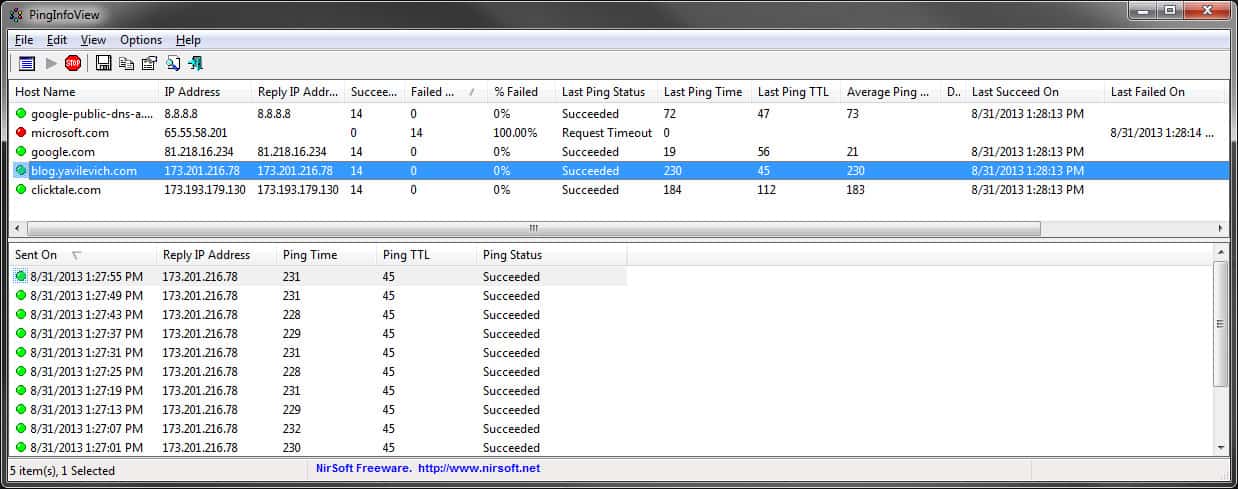
PingInfoView is a ping monitoring tool for those occasions where you just want to conduct basic ping scans. With this lightweight utility, you can ping multiple host names and IP addresses at once to see whether the connection was successful or not. This information is shown in the main table view which shows you whether the connection succeeded or failed and the final ping time.
When we tested PingInfoView we found the following key features.
Key Features:
- Basic Ping Monitoring: Sends ping requests to specific IP addresses or hostnames and displays results in a table format, including response times, packet loss, and minimum/maximum response times.
- Real-Time Monitoring: Provides continuous monitoring, updating ping results in real-time, allowing you to observe network performance fluctuations.
- Exporting Results: Allows exporting monitoring results in various formats like TXT, CSV, and HTML for further analysis or record-keeping.
- Filtering and Sorting: Enables filtering and sorting of ping results based on various criteria (IP address, response time, etc.) for easier analysis of specific devices or trends.
Why do we recommend it?
PingInfoView is a nice free tool that implements the standard Ping function through a GUI for Windows. This is useful as an easy-to-use troubleshooting tool.
Devices that are up are signified by a green button whereas those which have gone down can be identified by a red button. Even though this is a basic tool you can still schedule regular ping scans to keep your monitoring data up-to-date. You can configure PingInfoView to ping devices at regular intervals of your choosing. This ensures that your ping scan data is accurate and up to the minute. After you’re done pinging hostnames and IP addresses you can save the results in text, HTML, or XML file formats.
Who is it recommended for?
It is worth anyone’s time to just download PingInfoView and have it on your PC for occasional use in troubleshooting. If all of your computers run Linux and you don’t have any Windows endpoints, you can’t use this tool.
During our testing, we identified the following pros and cons related to PingInfoView.
Pros:
- Lightweight: Has minimal resource requirements, making it suitable for even low-powered devices.
- Free and Portable: No licensing costs and easy to use on any device without installation.
- Simple and User-Friendly Interface: Easy to understand and navigate, even for non-technical users.
- Export Options: Supports exporting reports in XML and HTML formats, enabling users to share and analyze ping data easily.
Cons:
- Limited Functionality: Lacks advanced features like performance graphing, customizable alerting options, or integrations with other tools.
- Not Centralized: Monitoring is limited to the device it’s running on, not offering a central view of a larger network.
- No Historical Data Storage: Does not store historical data by default, making it less useful for trend analysis over time.
While this tool won’t be suited to those looking for a more visual product, PingInfoView does a good job of providing the user with the basic data. PingInfoView is available for free on Windows 2000, Windows XP, Windows Server 2003, Windows Server 2008, Windows Server 2012, Windows Server 2016, Windows Vista, Windows 7, Windows 8, Windows 10, and Windows 11. You can download PingInfoView for free.
Further reading: What is ICMP?
11. Power Admin Server Monitor
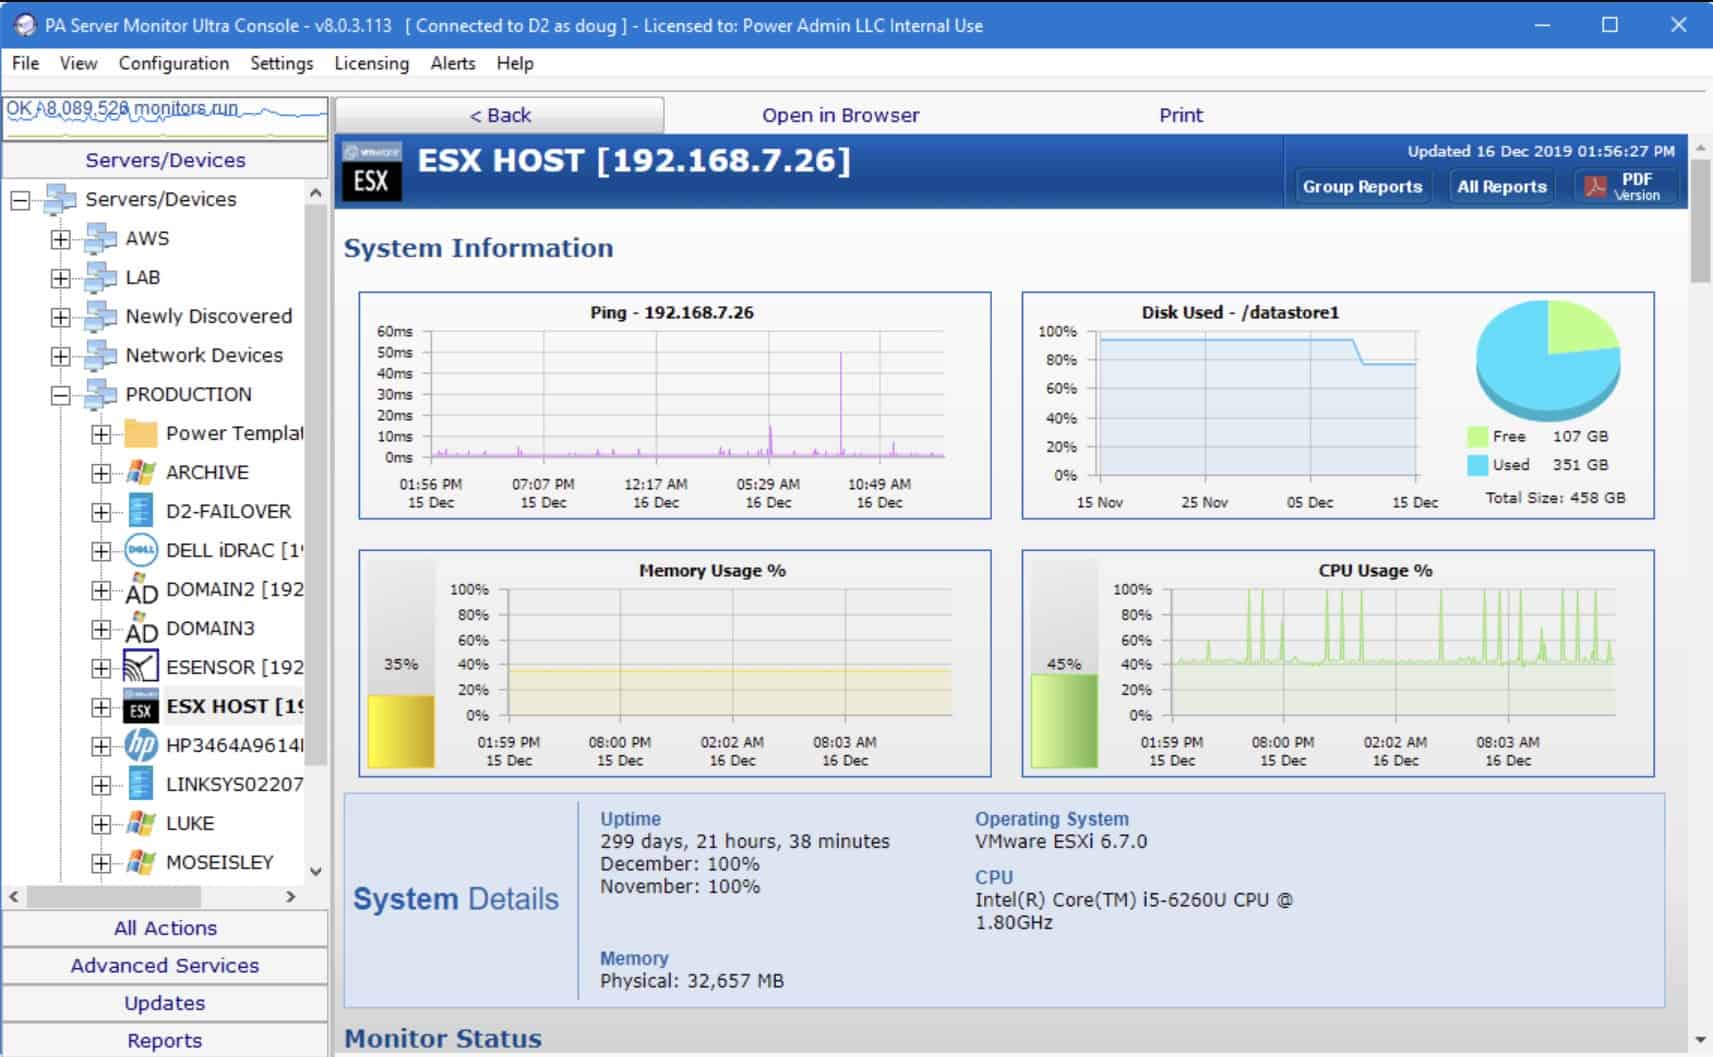
Power Admin Server Monitor also monitors network devices. It is able to reach across the internet and monitor remote networks as well. With Power Admin you can ping multiple IP addresses simultaneously. In addition, you can keep track of data on Ping tests, CPU, memory, and disk usage. This provides you with the basics needed to monitor effectively.
When we tested Power Admin Server Monitor we found the following key features.
Key Features:
- Ping Monitoring: Sends ping requests to specified IP addresses or hostnames and displays results, including response times, packet loss, and availability statistics.
- Real-Time Monitoring: Provides continuous monitoring, updating ping results in real-time for immediate insights into network performance.
- Alerting: Offers customizable alerting options for failed ping attempts, exceeding response time thresholds, or exceeding packet loss thresholds.
- Multi-Host Ping: Capable of conducting ping tests on multiple hosts simultaneously, aiding in comprehensive network monitoring.
- Speed Tests: Provides speed tests to assess network performance and identify potential bottlenecks.
Why do we recommend it?
Power Admin Server Monitor is a good choice if you want an availability tester for remote assets, which as Web servers, but you don’t want to use a cloud service, such as Pingdom. This tool installs on Windows and it can test connections across your LAN as well as across the internet.
Power Admin has its own alerts system that aims to minimize the number of alerts you receive. For instance, you only receive ping alerts if two or more ping responses haven’t been received. The alerts system also allows you to enter a variety of additional configurations. For instance, you can select the maximum response time for a successful ping, and limit alerts to events where an error has been detected for a specific period of time.
Configuring alerts in this way stops you from being bombarded with notifications every time a ping request has failed! When a notification is raised you know that it is something serious that needs to be addressed. Power Admin is available on Windows.

Who is it recommended for?
This is a good tool for technicians who have to manage multiple sites and/or Web assets and want in-house tools. You can set up continuous tests that will alert you if a device goes offline.
During our testing, we identified the following pros and cons related to Power Admin.
Pros:
- Customizable Alerting: Allows configuration of alerts based on specific thresholds, enabling proactive identification of network issues.
- Lightweight Tool: Occupies minimal space and system resources, making it suitable for systems with limited capacity.
- Multi-Host Testing: Supports testing multiple hosts concurrently, enhancing efficiency in network monitoring.
- Threshold-Based Alerting: Utilizes threshold-based alerting to minimize repeated alarms and focus on critical issues.
Cons:
- Limited Focus on Ping Monitoring: PA Server Monitor offers broader server monitoring functionalities, so ping monitoring might not be as feature-rich as dedicated ping monitoring tools.
- Limited Reporting: Reporting capabilities are limited, potentially hindering in-depth analysis and reporting on network performance.
- Opaque Pricing: Requires reaching out to sales for pricing information, lacking transparent pricing details upfront.
Overall we recommend Power Admin to those users who need a lean ping monitoring platform through which to ping multiple IP addresses. If you’d like to purchase a copy of Power Admin, then you’ll need to contact the company directly and fill out a short email form. There is also a 30-day free trial of Power Admin Server Monitor.
Choosing a Ping Monitoring Tool Verdict
In today’s world of fast-moving networking, ping monitoring has become a prerequisite for managing network devices. Pinging devices is one of the best ways to see if they are experiencing network performance issues. In many cases, you can spot problems before they start to result in downtime if you’re looking carefully enough. However, in the event that a device goes down, you’ll be able to tell immediately by using a tool with alerts like Domotz.
Ping Monitoring FAQs
How do I ping multiple devices at once?
You can ping multiple devices at once from the command line by writing a one-line for loop around the Ping command. However, it is much easier to use a graphical Ping tool that will automatically scan the entire network, a range of IP addresses, or work through a list of IP addresses fed into the Ping too via a file.
How do I ping my application server?
You can Ping your application server from anywhere as long as you know its IP address. From within your network, find the network IP address of the application server. Just give that IP address with the Ping command, for example, ping 192.168.0.20. If you have a Ping tool just enter your application server’s IP address into it and execute the search.
What is the command for continuous ping?
The Ping command includes switches that modify its behavior. The switch to use on a command for a continuous Ping is -t. So, try
ping -t comparitech.com
at a command prompt in Windows. Press Control-C to break out of the routine. On Macs and Linux computers continuous mode is the default for Ping, so just enter:
ping comparitech.com
Related post: What is Matt’s TraceRoute?

I have been using BS Ping for years.
It’s different in interface, but it’s definitely made by someone who knows network security issues in detail.
No other product gives me this kind of information.
“Spiceworks Network Monitor” is no longer available.
https://www.spiceworks.com/download/monitor/ -> “Uh oh, the page you’re looking for can’t be found.”
Thanks for letting us know. The list has been updated now.
Spiceworks looks to have re-enabled access to the free tool: https://www.spiceworks.com/free-network-monitoring-management-software/
I suggest adding Mars as a tool equipped with a map of devices in the company.
I made a simple terminal graphing app called pingg: https://gitlab.com/thann/pingg
It’s less of a long-term monitor and more of a quick debugging tool, and works easily through ssh =]