With no way of detecting and addressing your code bugs, the debugging step can soon become frustrating. Thankfully, there are many tools out there to help you rigorously debug your Python code.
With no way of detecting and addressing your code bugs, the debugging step can soon become frustrating. Python has a few basic functions that can help with debugging (see the print() process below). Still, you might require third-party tools to help you improve your debugging skills.
Here is our list of the best tools to Debug Python:
- Site24x7 APM Insight EDITOR’S CHOICE This cloud-based system focuses on tracking the performance of Web applications, including those written in Python. The tool creates an application dependency map and tracks those systems with which your Python code interacts. Get a 30-day free trial.
- Sentry A robust bug tracking and performance monitoring tool with excellent options for obtaining granular feedback on problem reports as well as actionable insights that are directly linked to your development environment.
- Pycharm One of the best Python debugging tools for the core development process because it is a Python-specific IDE with outstanding debugging facilities.
- Rollbar Another approach for bug reporting and error aggregation. Rollbar offers a variety of notification control and tracking options to help you increase your debugging productivity.
- Instabug A bug-reporting solution with VCS connectors that focuses on mobile user testing and feedback aggregation.
- Visual Studio Microsoft offers one of the greatest debugging IDEs on the market, with a professional package that includes many bug diagnosis features.
- Raygun This solution contains a suite of mitigation tools for integrated issue diagnosis and treatment, and it was built for crash reporting and bug monitoring.
- Glitchtip An open-source bug-reporting option. Glitchtip offers all of the basic features of premium products while remaining completely free and adaptable.
- Komodo IDE An open-source IDE with great debugging features and VCS integration that supports numerous languages (including Python).
You’re probably already familiar with the print() function if you’re seeking tools to help you debug Python. If not, this function can help with debugging because it outputs a defined parameter. While many of the solutions on this list use third-party debugging technologies, the print() function may always be relied on to detect flaws during development.
This article covers several distinct tools for debugging Python, including both diagnosing and resolving errors. The functions of the tools differ, but they can be divided into two categories: IDEs and Bug Reporting Tools.
IDEs
Upgrading your IDE is one of the most effective ways to increase your debugging abilities. This is because your coding abilities are influenced by your development environment in a subtle but significant way. While most premium IDEs work similarly, we’ve included a handful on this list that are specifically designed for debugging.
Bug Reporting Tools
While debugging during development is vital, the majority of your faults will be discovered during testing and post-deployment. Furthermore, throughout their hands-on time with your product, your QA team, external testers, and end-users will find flaws.
Bug reporting and aggregation tools are available to help with this since they provide a platform for errors to be registered and your bug-handling developers to be notified. To make debugging easier, these tools interface directly with your development environment or workflow systems. On our list, we’ve included a few of these tools for you to check out.
Open Source
A number of the solutions in this article are open source. While open source presents a variety of benefits across the board, debugging it is particularly useful. This is because of technical issues that might arise as a result of incompatibility with newer or differing systems.
Browser updates, new industry standards, and other such issues might cause problems when debugging with 3rd party solutions since you are reliant on those solutions to update their parameters. Open source can circumvent many of those issues by putting the onus on updating those parameters on the public user base.
The Best Tools to Debug Python
Our methodology for selecting Python debug tools
We reviewed the market for debugging systems for Python code and assessed the options based on the following criteria:
- Code checkers that are built into development editors
- A code verification system that enables debug messaging to write status codes
- A system to collect debug messages
- Integration with issue trackers
- Automated testing systems that integrate into the CI/CD pipeline
- A free trial or a demo to enable a pre-purchase assessment
- Value for money from a debugger that can be used for other languages as well as Python and so provide full development verification for one price
1. Site24x7 APM Insight (FREE TRIAL)
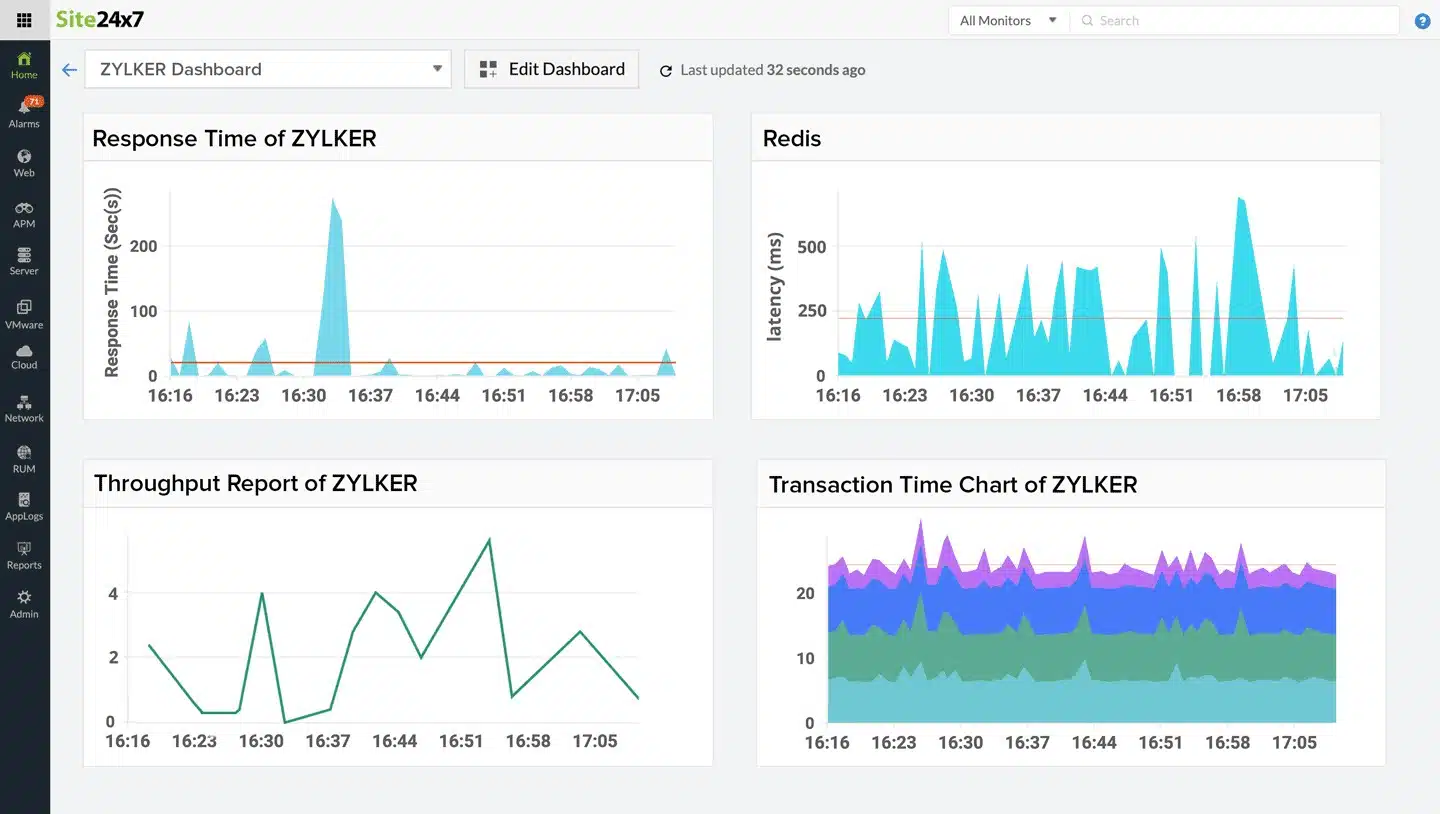
Site24x7 APM Insight tracks the performance of Web applications, including those written in Python. The APM doesn’t just examine each component in isolation, it also links together all related systems into an application dependency map. This extends to the services and resources that the application uses, such as databases and server memory.
Key Features:
- Comprehensive Python Monitoring: Tracks Python application performance thoroughly.
- Application Dependency Mapping: Links all related systems for in-depth insight.
- Resource Usage Tracking: Monitors server memory and database usage.
- Advanced Code Profiling: Helps in identifying performance bottlenecks.
- Python Log Analysis: Collects and analyzes Python logs for better troubleshooting.
Why do we recommend it?
Sight24x7 APM Insight is a good choice for Python monitoring because it tracks the resource usage of Python programs as well as the progress of the program itself. Many Web applications are written in a mix of languages and integrate external libraries and APIs. The Insight APM can track all of these elements.
Web applications are complicated and so difficult to monitor. This is because they can be composed of many functions that are sourced from different locations. Some components can be supplied by third parties and are hidden behind APIs, which slot into a program with a single line of code.
Tracking all of the elements in a Web application, such as a Python program requires a mix of monitoring services and the Site24x7 APM Insight provides all of them. You might need distributed tracing to track the activity of elements that you can’t break into and code profiling for programs that you host and can open. These tools are included in the APM Insight package.
Site24x7 makes its modules available as a package, marketed in plans that are charged for by subscription. So, you also get network, server, and infrastructure monitoring in with your APM. Other useful tools are real user monitoring and synthetic monitoring for Web applications, which provide extra insights into your Python code performance. Another useful module for Python users is the log management unit, which will collect Python logs and allow you to see and analyze them.
Who is it recommended for?
This package is suitable for use by businesses that develop applications in Python and also those that rely on applications provided by third parties that might be written in Python or in another Web scripting language. The APM helps you track Python performance whether or not you own or host it.
Pros:
- Holistic Python Tracking: Simultaneously monitors Python code and resource access.
- Interconnected System Analysis: Identifies impacts across collaborating functions.
- Predictive Resource Management: Forecasts potential resource shortages.
- Extensive Monitoring Suite: Includes server, network, and infrastructure monitoring.
- User-Friendly Interface: Simplifies tracking and analysis of Python applications.
Cons:
- Lack of On-Premises Version: May limit organizations preferring local deployments.
- Bundled Service Packages: Could overwhelm users needing only specific modules.
You get APM Insight in a plan that also includes other services, for example, there is an APM plan and a Website monitoring plan, both of which provide Python monitoring. There is also the MSP edition for managed service providers. You can examine the entire Site24x7 platform with a 30-day free trial.
EDITOR'S CHOICE
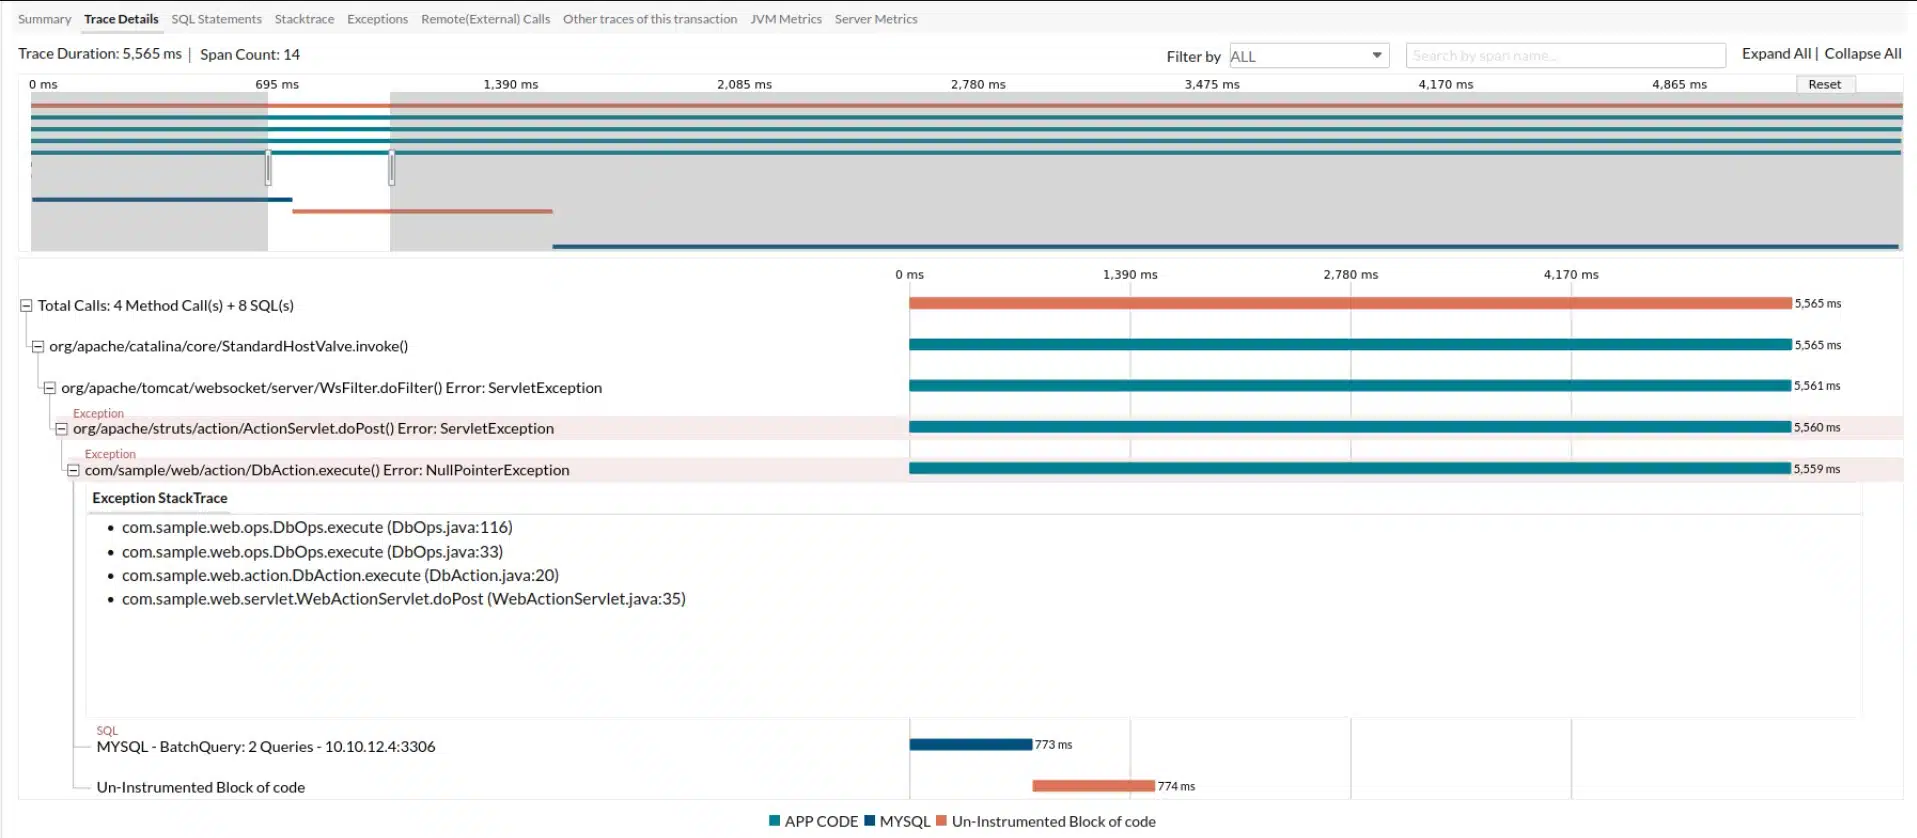
Site24x7 APM Insight is our top pick for a Python debug tool because it combines extensive application performance monitoring (APM) with powerful debugging capabilities. This system is tailored to help developers efficiently identify and resolve issues in Python-based applications. Its real-time monitoring provides detailed insights into application performance, highlighting slow transactions, bottlenecks, and errors that can be difficult to pinpoint with traditional debugging tools. Site24x7 can trace requests across the full application stack, including the Python code, database queries, and external services, allowing developers to quickly locate performance issues or failures. The transaction tracing feature allows for a deep dive into specific requests and their execution paths, identifying inefficient code segments or problematic third-party integrations. The tool’s error tracking feature automatically collects detailed stack traces for exceptions in Python applications, helping developers understand the root cause of failures. Site24x7 also supports automatic deployment tracking and performance baselining, which makes it easier to spot regressions or performance degradation after code updates. Site24x7’s dashboard aggregates performance metrics and error logs, presenting them in a clear format. This visibility allows teams to prioritize debugging efforts more effectively.
Download: Get a 30-day free trial
Official Site: https://www.site24x7.com
OS: Cloud based
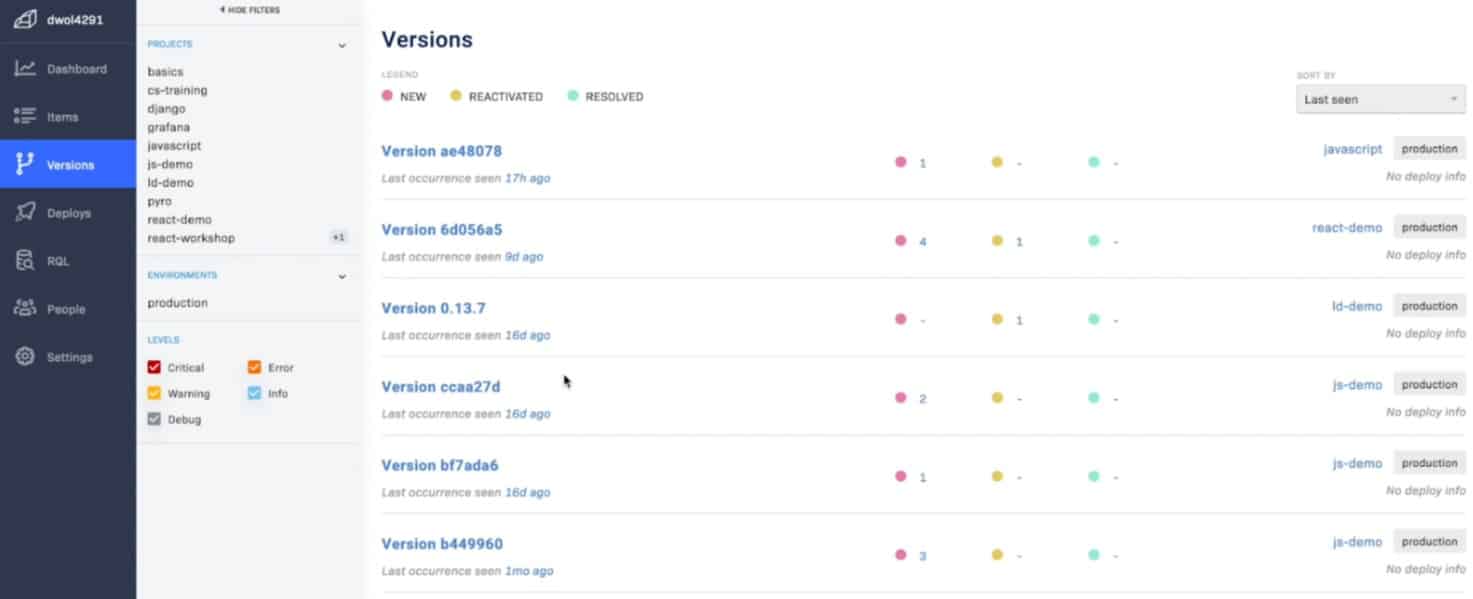
2. Sentry
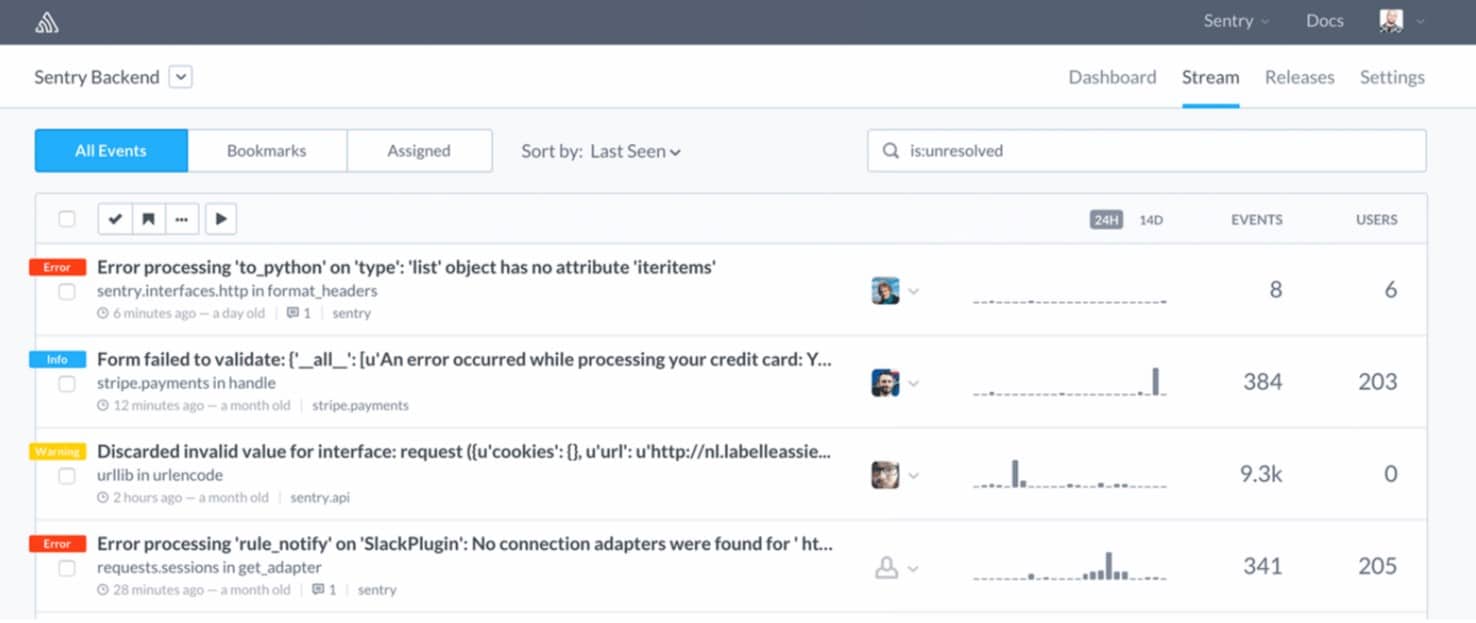
Sentry is an error-tracking and performance-monitoring tool that can diagnose and resolve Python problems. A stack trace feature simulates your development environment, allowing you to break down reported problems and gain a better understanding of where bugs occur in the code.
Key Features:
- Robust Error Detection: Efficiently identifies performance issues in Python.
- Comprehensive Performance Monitoring: Tracks application performance in detail.
- Advanced Stack Tracing: Offers deeper insights into error sources.
- Event Logging: Aggregates logs for easier analysis.
- Free Base Version: Accessible with limited features at no cost.
Why do we recommend it?
Sentry specializes in monitoring Web applications. These are frequently written in Python. The tool can scan through code to identify reasons for poor performance or even errors. It can also scan through JavaScript, Ruby on Rails, Node, Go, and .Net. It is particularly adept at scanning mobile apps for iOS and Android.
The service compiles your issues into a searchable list and allows you to identify areas of your code to make it easier to reproduce errors. The performance monitoring tools can help you diagnose problems by allowing you to quickly spot unusual readouts in your development projects.

Sentry’s basic functions are completely free to use, however, it has a limited user capacity. Upgrade to the Team package for $26/month, which increases the error detection algorithms, or the Business package for $80/month, which expands on the error insights even more.
Who is it recommended for?
Sentry advertises its services for use with live Web applications. So, this would be used by the buyers of applications. However, companies that develop and manage Web applications and mobile apps would also get a great deal of benefit from this tool by using it as a tester for Web applications before release.
Pros:
- Multi-Language Support: Ideal for mixed-language application environments.
- Customizable Alerts: Over 100 templates for tailored server health monitoring.
- Efficient Root Cause Analysis: Facilitates quicker resolution times.
- Workflow Integration: Seamlessly integrates into existing development workflows.
Cons:
- Limited Team Scalability: May not suit larger development teams’ needs.
- Complexity for Novices: Could be overwhelming for users new to application monitoring.
A free trial is offered for both the Team and Business editions. If you need to secure a large-scale business and require features such as total platform error monitoring and cross-project insights, you can contact Sentry directly for Enterprise-scale services.
3. Pycharm
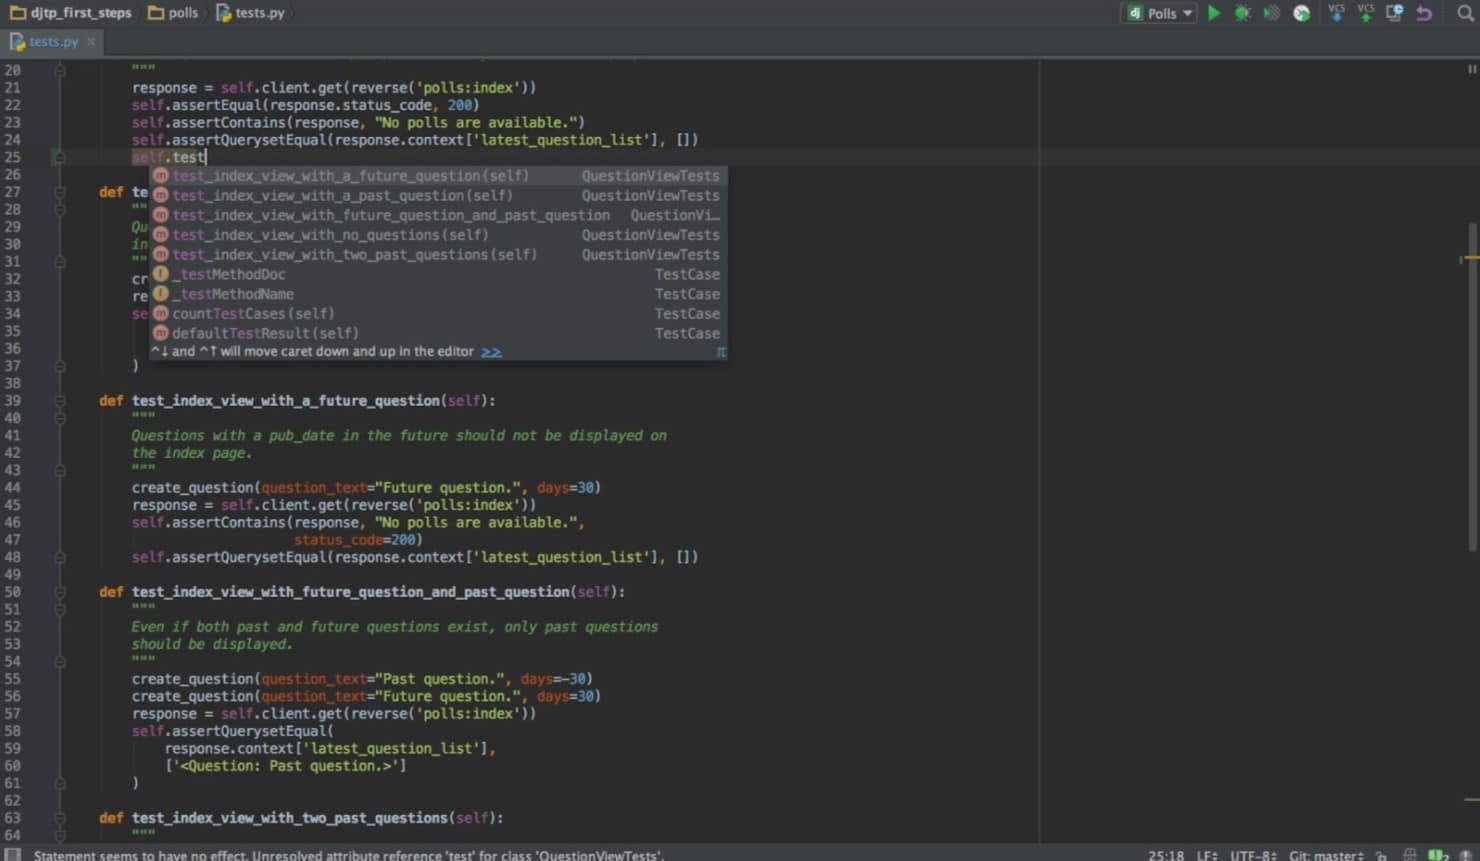
Pycharm is a Python-focused IDE featuring some of the greatest Python debugging tools available. Furthermore, the intelligent help capabilities give intelligent auto-completion and error checking, resulting in a significant reduction in problems. Aside from debugging tools, the solution includes a number of other tools that are beneficial to overall development.
Key Features:
- Python-Centric IDE: Tailored specifically for Python development.
- Smart Assistance: Offers intelligent auto-completion and error checking.
- Web Development Support: Integrates popular web development frameworks.
- Version Control Integration: Facilitates seamless version management.
- Graphical Debugging: Simplifies the debugging process with visual tools.
Why do we recommend it?
Pycharm is a development environment for Python code. It will nip errors in the bud before the program is completed. The system is able to manage other Web application languages as well, so if you are producing an application with a mix of coding languages, you will be able to debug them with this package.

Because the product is built on open-source principles, it provides a lot of support and flexibility. In addition to Python, premium versions support JavaScript, HTML/CSS, and SQL, greatly expanding the tool’s applicability to a wider range of tasks.
Who is it recommended for?
Pycharm has a free, Community Edition, which will appeal to small developers. There is also a lower subscription rate for individuals. The pricing structure of Pycharm is pretty unique. Rather than luring new customers with a discounted rate for the first year, Pycharm lowers the subscription rate for successive years of usage.
Pros:
- Focused Python Debugging: Specialized tools for Python code analysis.
- Open-Source Platform: Benefits from extensive community support.
- Flexible Language Support: Accommodates other web languages like JavaScript, HTML/CSS.
- User-Friendly Interface: Streamlines development and debugging processes.
Cons:
- Lacks AI Features: Misses out on advanced AI-based code assistance.
- Complex Pricing Model: Could confuse users with its unique subscription structure.
Pycharm is available in two versions: a free Community version and a paid Professional version with more capabilities. There is a free trial available for the Professional edition, which offers greater support for both scientific and web Python development.
4. Rollbar
Another error reporting and fault aggregation solution, Rollbar, is based on real-time issue identification. The solution includes a set of notifications for quick and accurate bug reporting, but it also groups bug notifications intelligently for easier reading.
Key Features:
- Real-Time Error Monitoring: Identifies bugs as they occur.
- Intelligent Bug Aggregation: Groups-related errors for clarity.
- Automated Issue Tracking: Streamlines the bug resolution workflow.
- Extensive Workflow Integration: Compatible with various development tools.
- Free Entry-Level Plan: Suitable for small teams with basic needs.
Why do we recommend it?
Rollbar is a development code verification system that is able to scan many languages and also operating system commands for mobile devices running iOS and Androids. It also provides OS command checking for macOS but not Windows or Linux. The coding languages that this tool can scan include Python, PHP, and JavaScript.

Automated issue tracking and workflow triggers help you avoid accidentally shipping projects with known but untreated bugs. Furthermore, telemetry data obtained through the various connectors offered allows you to track where bugs appear, allowing you to expedite bug repair.
Who is it recommended for?
This package is ideal for development teams. Therefore, it is also useful for DevOps environments. There is a Free edition, which makes it appealing for startups and the paid editions include integration into CI/CD pipeline tools for continuous testing. There are some large companies on the client list, including Salesforce and Twitch.
Pros:
- Diverse Language Support: Handles Python, PHP, JavaScript, and more.
- Scalable Error Events: Accommodates growth with adjustable event limits.
- Efficient Error Analysis: Helps expedite the bug-fixing process.
- Comprehensive Telemetry Data: Provides detailed insights for debugging.
Cons:
- Better for Larger Teams: May be overkill for smaller development environments.
- Limited Free Plan Features: Free version might not meet all development needs.
Rollbar is free for up to 5,000 error events and has enough essential features to get you started, especially if you’re working with a small development team. The Essential plan can process up to 50,000 errors per month with a starting price of $12.50 for 25,000 errors per month. That plan provides a retention period of 90 days. The Advanced plan provides more features with the same error processing volumes but with a data retention period of 180 days. The price for that edition starts at $24.17 for 25,000 errors per month.
5. Instabug
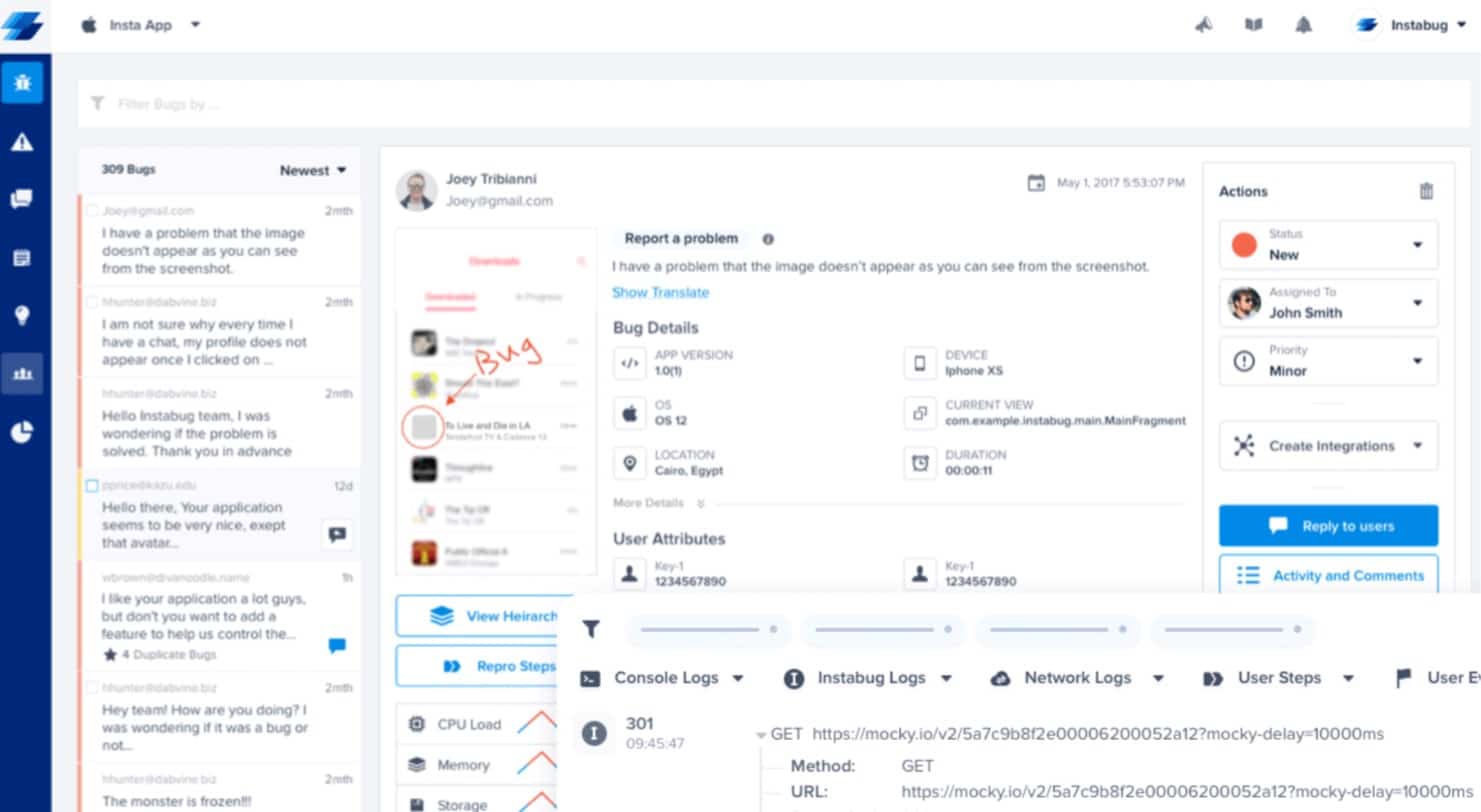
Instabug is a bug-reporting application designed specifically for mobile testing. The system relies on human testers to find defects in a product, but it also provides a way to collect and handle bug-related feedback. Because it only serves as a feedback device, the product isn’t created expressly for Python or any other language.
Key Features:
- Mobile-Centric Bug Reporting: Specialized in mobile application testing.
- Detailed Log Data: Offers comprehensive data for in-depth analysis.
- Performance Monitoring: Keeps track of app performance metrics.
- Broad Integration Range: Compatible with popular development tools.
- Automatic Notifications: Alerts teams to issues promptly.
Why do we recommend it?
Instabug specializes in mobile application performance scanning and error detection. It identifies crashes and bugs and can replay an event during which the crash occurred to aid analysis. Although the tool is concerned with live mobile apps, it also includes team management features for routing rework.
Bug reports can be compared to log data to have a better understanding of the issues that have been reported. In addition, the solution features a large number of integrations, such as Github, Slack, and Trello, that help to streamline the development process.

Who is it recommended for?
This system is suitable for use by companies that rely on mobile apps to deliver their services. The tool focuses on live apps, so it is also good for DevOps teams and less for development businesses. The client list for the tool includes Disney+, General Motors, and Verizon.
Pros:
- Intuitive User Interface: Enhances ease of use and navigation.
- Diverse Communication Tools: Facilitates team collaboration and workflow management.
- Robust Performance Tracking: Provides insights into app functionality and health.
Cons:
- Mobile-Only Focus: Limits utility for non-mobile application development.
- Short Trial Period: 14-day trial might not be sufficient for thorough evaluation.
A 14-day free trial of Instabug is available. The Basic product bundle, which costs $149 per month, is designed for small organizations. The Pro version, which costs $249 a month, provides more diagnosis features and integration options.
The Premium solution is designed for large enterprises and significantly enhances diagnosis choices, including on-premises hosting. However, you must contact the company directly for a customized price quote.
6. Visual Studio
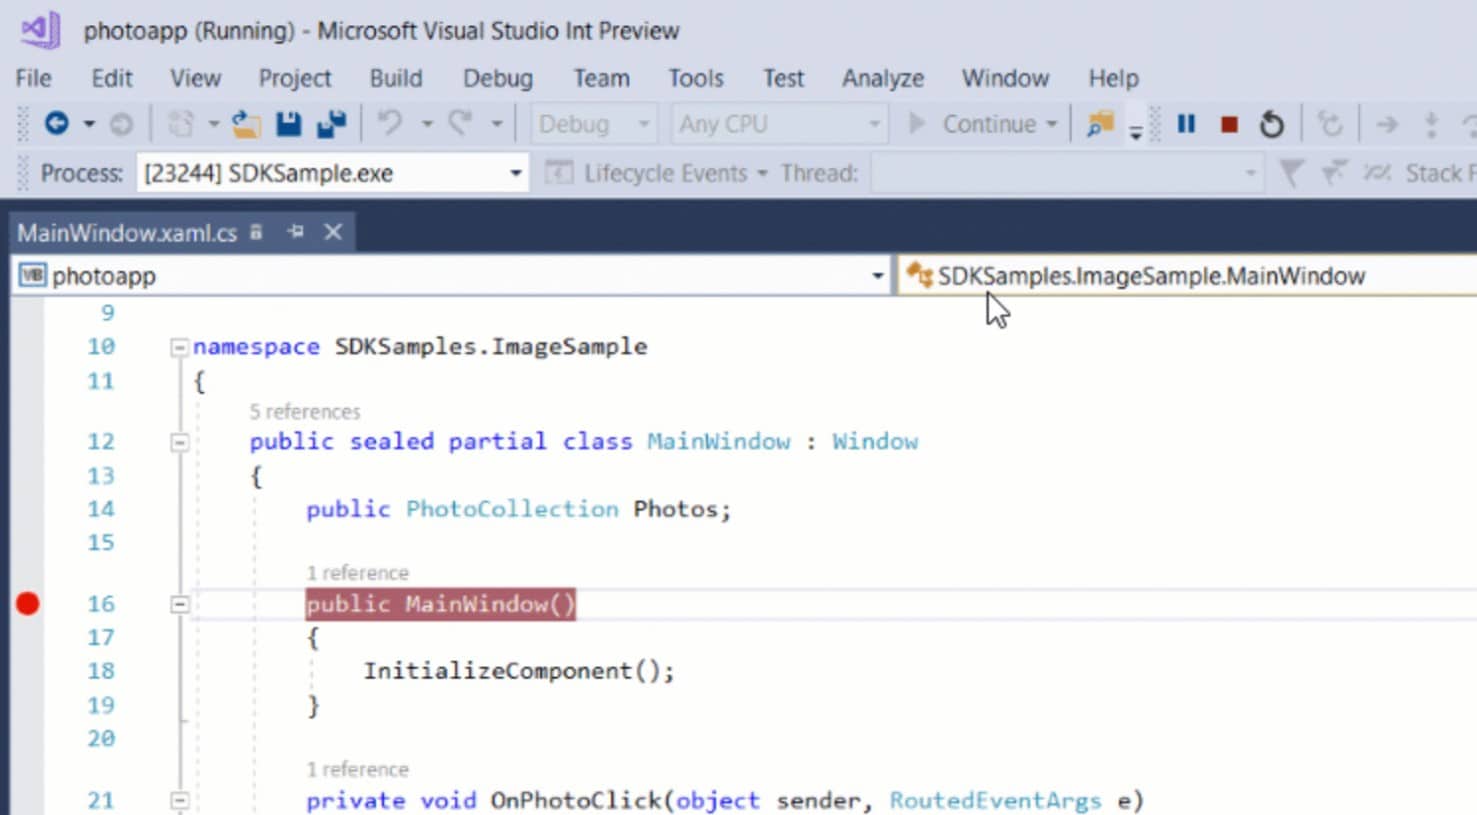
Microsoft Visual Studio is an IDE with one of the most comprehensive debugging toolkits available. You can, for example, use the breakpoint to isolate certain lines of code that may be creating problems, and then utilize the built-in visual debugging tools to identify and resolve issues.
Key Features:
- Versatile IDE: Supports a wide array of programming languages, including Python.
- Advanced Debugging Tools: Offers comprehensive debugging capabilities.
- Visual Debugger: Simplifies problem identification and resolution.
- Extensive Integrations: Compatible with numerous development tools.
- Multi-Language Support: Accommodates a variety of coding languages.
Why do we recommend it?
Microsoft Visual Studio is a well-known development environment and it is able to support a range of coding languages, including Python. The environment includes a step-through debugger that is easy for developers to use and it also provides a completion testing mode for assurance before an application goes live.
You can also use the debugging tool in step sequences to figure out which line of code is creating issues. In terms of fault fixing, Visual Studio’s arsenal of debugging features means it can compete with any other IDE. Furthermore, because Visual Studio supports a wide range of languages, the usability extends beyond just Python.

Visual Studio is available in a variety of forms, including the Community version, which is a free, open-source version targeted for individual small-scale developers.
Who is it recommended for?
This tool is probably the first choice for any development team that works in a Microsoft environment. It is all about development rather than operations. So, you would be using it to debug and test before release rather than to track the performance of live Web applications.
Pros:
- Broad Language Compatibility: Ideal for multi-language development teams.
- Popular and Well-Supported: Widely used with extensive community resources.
- In-Depth Debugging Features: Enhances code analysis and problem-solving.
Cons:
- Not Python-Specific: May lack some Python-focused features.
- Complex for Beginners: Could be challenging for new developers to navigate.
If you work in a group, you might want to look into the Business options, which are available as part of a $45 monthly subscription. For $250 per month, enterprise services are available for large-scale commercial needs.
7. Raygun
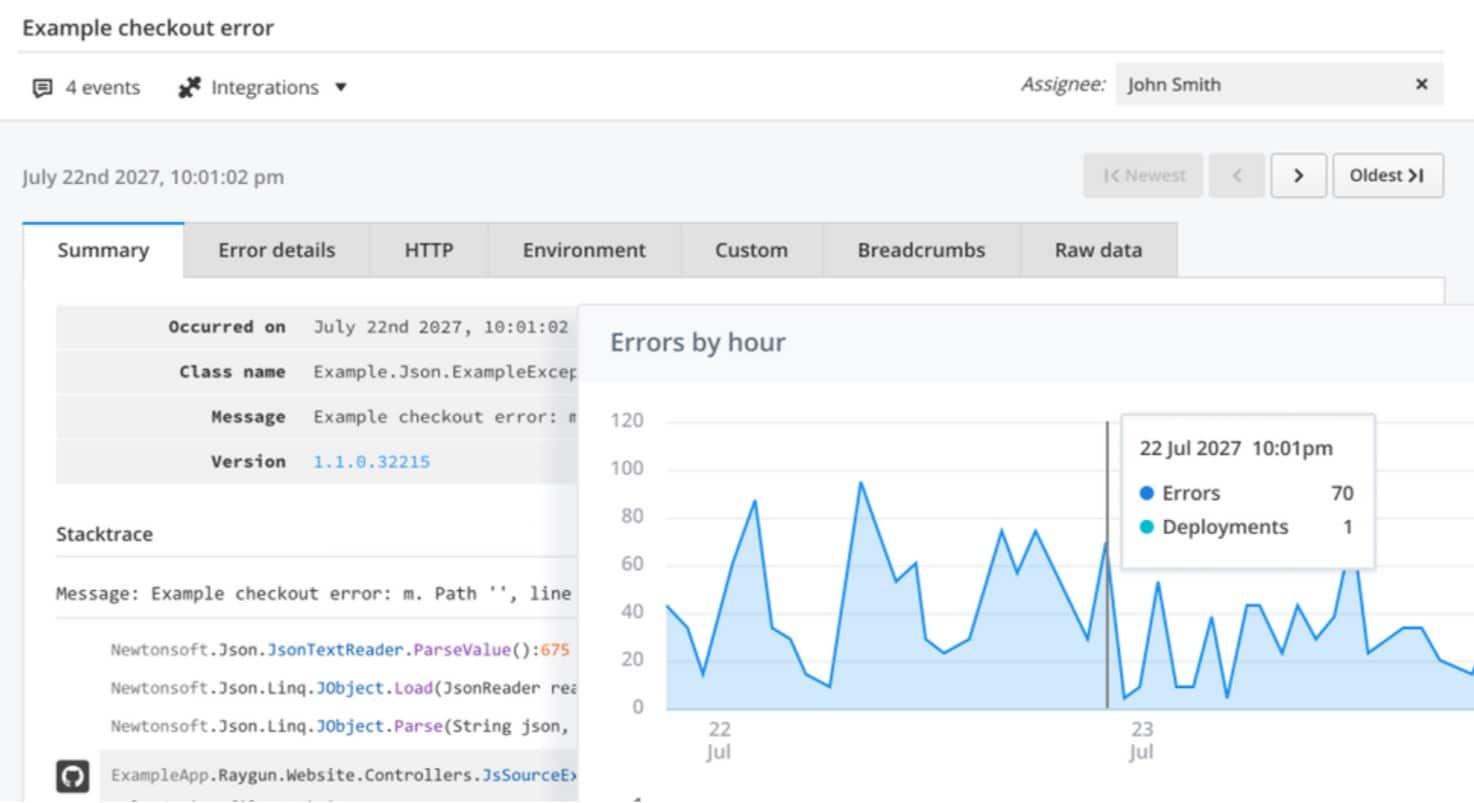
Raygun aggregates user data to enable accurate crash reporting and bug feedback. In addition, the solution includes issue-tracking tools and debugging mitigation measures. These features, combined with the user data monitoring, make this solution ideal for debugging an existing operational service.
Key Features:
- Comprehensive Bug Feedback: Aggregates user data for accurate reporting.
- Diverse Diagnostics Tools: Offers a range of debugging and mitigation features.
- User Monitoring Platform: Tracks user interactions for deeper insights.
- Modular Pricing Model: Allows selection of needed features only.
- Integrated Crash Reporting: Simplifies the process of identifying app crashes.
Why do we recommend it?
The Raygun platform includes three units, which are standalone packages but could be used as a suite. There are a Crash Reporting tool, a Real User Monitoring service, and an Application Performance Monitoring system. The three tools together will serve a DevOps team from testing, through to design analysis.
The solution additionally splits its major functions among three different items. This means you can opt into the services you need without paying more, but it also means that if you require a fully-featured solution, you may end up paying more than other solutions.

The solution is divided into three main services, each of which can be tried for free on the website. Your monitoring needs will benefit from the Application Performance Monitoring and Real User Monitoring packages, which start at $8 per month.
Who is it recommended for?
This package is ideal for use by DevOps teams with more utilities to apply from the point that an application moves through acceptance testing through to initial suitability analysis for marketing teams to live performance tracking. You would use the package much more during operations than during development.
Pros:
- User Data Utilization: Enhances understanding of app performance and issues.
- Flexible Service Options: Tailored packages for specific monitoring needs.
- Real User Monitoring: Ideal for operational service debugging.
Cons:
- Suitable for Real User Cases: May not be ideal for early development stages.
- Potentially Higher Cost: Modular services might lead to increased expenses.
The right Javascript debugging tools can be found in the Error Monitoring & Crash Reporting application, which costs $4 per month. Similarly, the price for each product is scalable based on the required capacity, with 10,000-unit increments being the typical.
8. Glitchtip
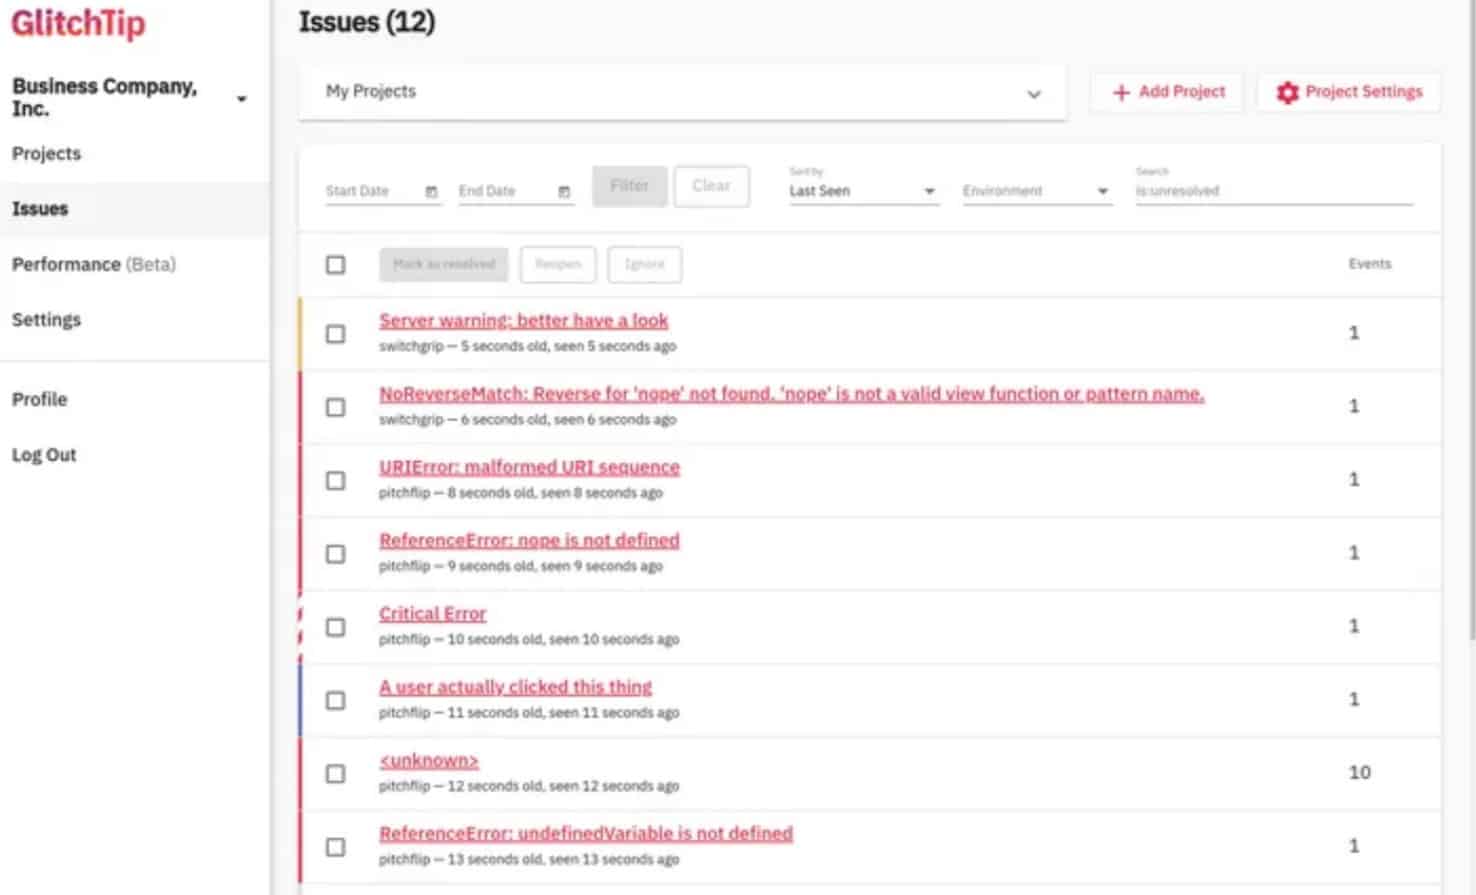
Glitchtip is an open-source bug reporting application that collects and organizes problem reports into a legible, fixable format. It outperforms other alternatives because it is open-source, which means it has a larger community of users than some other products.
Key Features:
- Open-Source Foundation: Benefits from a wide community of users.
- Error Reporting and Aggregation: Organizes problem reports effectively.
- Performance Monitoring: Tracks application performance indicators.
- Sentry Compatibility: Integrates seamlessly with Sentry’s open SDK.
- Flexible Hosting Options: Offers both self-hosted and hosted solutions.
Why do we recommend it?
Glitchtip is well-named because it identifies bugs and explains where in the code the error occurred. This is an appealing system that aims for Sentry’s market by comparing its functions to that market leader but stressing its lower price. You can even use both tools together.
The solution appears to have been developed in response to Sentry’s decision to abandon open-source, but it still works with Sentry’s open SDK. You can host the solution locally because it is open-source, but the company also provides hosting choices. Glitchtip is still in its infancy, but it could be the ideal answer for tiny enterprises or low-budget projects that require open-source.

Who is it recommended for?
This tool has a wide appeal. You can choose to use the system as a SaaS package or download it and host it yourself. There is a Free edition for small businesses that will identify 1,000 errors per month. All plans provide availability testing as well as performance monitoring.
Pros:
- Community-Driven Development: Gains constant improvements from user contributions.
- Lightweight and Efficient: Ideal for small-scale projects and startups.
- Versatile Hosting Choices: Adapts to different organizational needs and preferences.
Cons:
- Basic User Interface: May lack advanced navigation and analysis features.
- Emerging Platform: Still growing and may lack some mature features.
When self-hosted, Glitchtip is open-source and fully free. You can also use their hosted platform for up to 1000 events, which is also free.
They offer services for small, medium, and large businesses in addition to the free hosted alternative. The Small package is $15 per month and supports up to 100k events. The Medium package costs $50 per month and supports up to 500k events. Finally, the Large package costs $250 per month and supports up to 3 million events.
9. Komodo IDE
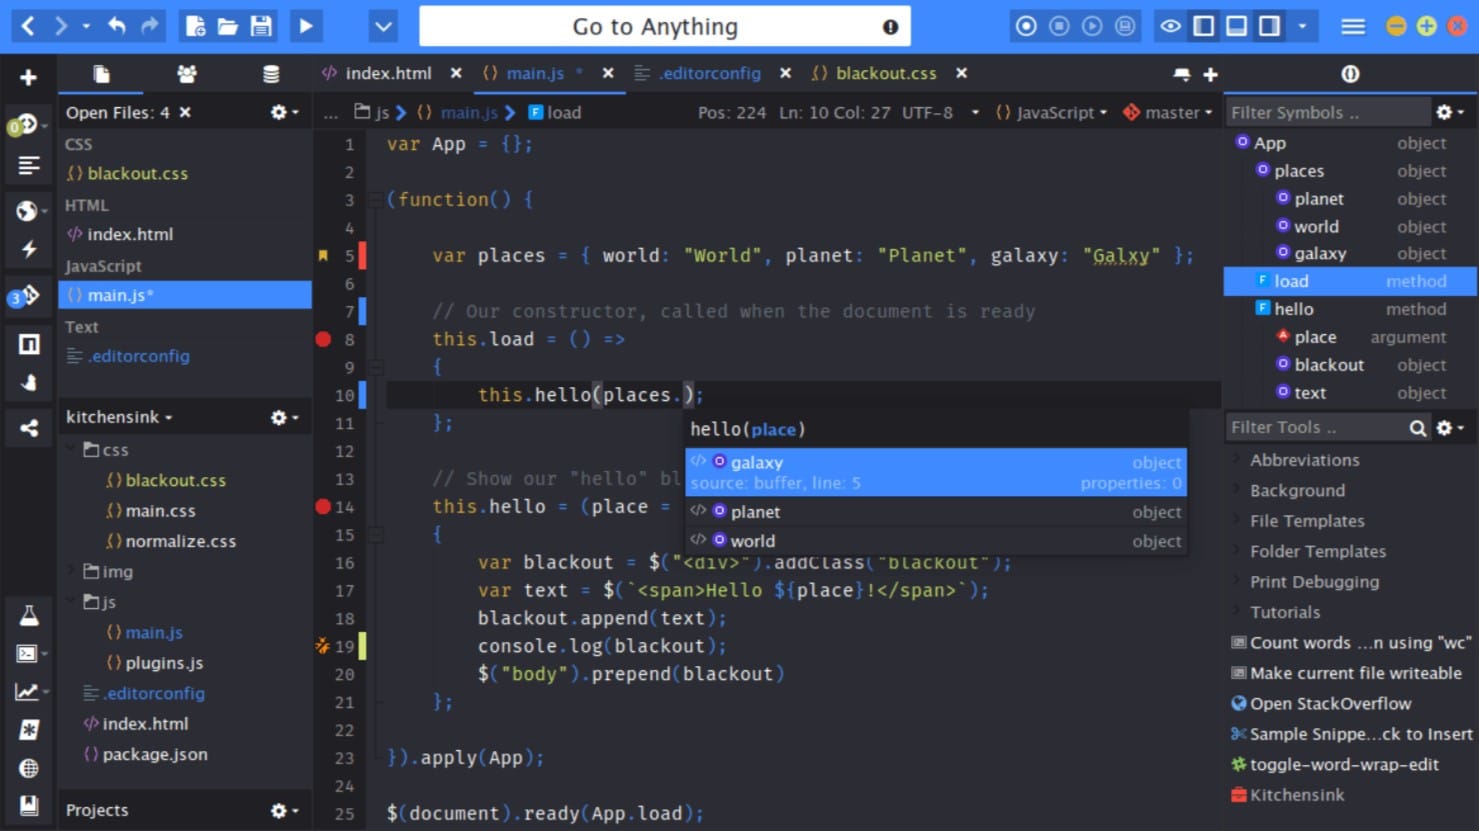
Komodo is another IDE, but this one supports a wide range of languages, including Python. Komodo is open-source, and the product’s base version is also available for free. The visual debugger and code inspection capabilities in the IDE excel at debugging, improving error identification, and preventing problems.
Key Features:
- Multi-Language IDE: Supports Python, PHP, Golang, Perl, Tcl, and Ruby.
- Integrated Version Control: Enhances code management and collaboration.
- Visual Debugging Tools: Simplifies the debugging process for developers.
- Workflow Management: Streamlines project management processes.
- Open-Source Advantage: Gains from community support and extensions.
Why do we recommend it?
Komodo IDE is a development environment and so its closest rivals on this list are Visual Studio and Pycharm. The system supports Python, PHP, Golang, Perl, Tcl, and Ruby. This is an on-premises package and you would install it on each developer’s computer. The software will run on Windows, macOS, or Linux.
You can avoid defective builds from being distributed thanks to built-in support for VCS like Git and workflow management solutions. The true allure of Komodo is its open-source nature, which means it has a lot of support and extension options. This solution will provide numerous features to boost your debugging capabilities if you require a new IDE for Python development.

Who is it recommended for?
This package isn’t networked. It is a single use tool that you need to install on every computer that your developers work on. The system isn’t for use while applications are live. You would use it to trap errors as the code is written. And also a tester could run through a code in the environment to verify that it doesn’t have any bugs.
Pros:
- Broad Language Support: Useful for teams working with multiple programming languages.
- Robust Debugging Capabilities: Offers comprehensive tools for error identification.
- User-Friendly Design: Facilitates ease of use for developers at various levels.
Cons:
- Not Python-Exclusive: May not offer some Python-specific features.
- Limited Networking Capabilities: Not ideal for collaborative teams requiring remote access.
The product may be downloaded and installed from the company’s website, but to use it, even the free version, you’ll need an ActiveState account. Regrettably, it appears like ActiveState is gradually phasing out the IDE in favor of incorporating it into the ActiveState platform.
The IDE still has a following, and because it’s free and open-source, it’s worth considering if you’re on a budget and need a solution. However, keep in mind that, while the product is still supported, it appears to be fading in popularity in comparison to more modern alternatives.
Python debugging FAQs
What is Python debugging?
Debugging involves detecting coding errors in Python script. There are a number of ways to implement debugging and the first of these is manual. You can simply insert print statements and write out lines to a file that include status output at each stage of the script. Automated tools effectively perform the same task, either by inserting lines into the code or by tracking the execution of the code, noting each line number as it runs, and then recording the outcome of that line’s execution.
Is it possible to debug Python?
Python has a library of functions that enable debugging. This is called the python debugger, or pbd. This is a structure that creates a class and provides functions and storage variables. The pbd system will provide output that can facilitate error correction by identifying the line in the code that needs attention.
Is Python difficult to debug?
Python is not particularly difficult to debug. In fact, as it is a script rather than a compiled program, it is easy to watch code execute line by line in a code profiler. For Web-based applications, developers can use the debugging features that are included for free in the major Web browsers to watch each line of code execute because those systems will pause the code after each line runs. Other strategies for Python debugging include writing debug messages into the code or using a code profiling debugging tool.
