

System and network administrators know, and appreciate, the tracert (Windows OS) or traceroute (Linux/Mac OS) tool. They know that with this command, they can spot and identify issues with their networks or the devices that are connected to them.
But, apart from using the command-line interfaces (CLI) on your computer, we have a collection of alternative traceroute solutions that make it easier to use this tool.
Here is our list of the best traceroute alternatives:
- Site24x7 EDITOR’S CHOICE An all-in-one cloud-based monitoring platform that includes multi-mode traceroute tools with visual maps, real-time diagnostics, global testing locations, and more. Start a 30-day free trial.
- ManageEngine OpManager (FREE TRIAL) A network monitoring tool with built-in traceroute capabilities for quicker troubleshooting. Start a 30-day free trial.
- Open Visual Traceroute Free alternative that presents the output in 3D maps for easier comprehension; it works on any operating system and is easy enough for even non-tech savvy users to operate.
- PingPlotter Free network monitoring and route analysis tool; it comes in various editions that cater to all requirements from individual devices to corporate networks and even Cloud Computing.
- Paessler PRTG Network Monitoring Suite of tools that give full control of a network to the administrator; the traceroute feature works in collaboration with the other tools which helps in getting a deeper insight into the current state of a network’s health.
- SolarWinds Engineer’s Toolset This package of network administration tools includes a Traceroute facility as well as other troubleshooting utilities. The bundle installs on Windows Server.
- Path Analyzer Pro Light, no-nonsense traceroute tool that delivers quickly and presents its findings in a clear comprehensible format; it comes with other network troubleshooting tools too.
- NetScanTools This suite of tools packs a heavy punch when it comes to network traffic data analysis; it has tools that help administrators truly understand their network.
Three online traceroute alternatives
- KeyCDN Although primarily a Content Delivery Network system provider, they have an impressive traceroute tool that bends over backward to make sure you get the information you need.
- Uptrends Website monitoring solution provider; their traceroute tool also lets you choose from a selection of cities too.
- GeoTraceroute Online traceroute tool that is fast and displays the whole route on a realistic globe.
Why use traceroute?
Administrators use the traceroute command to find out information about their networks and devices that include:
- Trace the Route and map out the network
- See the hops a packet has to make before it reaches its destination
- Find out if there is a “break” in the network or if a device is “dropping” packets
- Gauge the speed of each hop between devices to troubleshoot latency or jitter issues
Depending on the results or input they get from traceroute, the admins can now make the correct decisions and take actions to remedy the issues.
How does traceroute work?
When you run the traceroute command it sends out three UDP packets towards the destination host. As soon as it encounters a network device an echo is sent back to the origin host which indicates a “hop” has been encountered. The round-trip time (RTT) is registered which lets you know how long it took for the packets to reach each device.
This process is repeated all along the way, with each hop resulting in information about the device and how long it took to reach it until the destination host is reached.
By the time the destination host has been reached, the administrator will have built a clear picture of the path that packets traverse to reach it. The admin will also know if there is a connection problem (when the packets are dropped and no reply is sent back) or latency (when it takes too long for the “echo” to return to the origin host).
Why do I need a traceroute alternative?
Ok; we have just seen that traceroute is indeed a powerful tool in an administrator’s arsenal. But, running the command over and over will soon become a tedious undertaking – especially in a large, corporate networking environment. Why would anyone want to waste time typing in CLI commands when there are application suites and websites to do the whole thing, and more, with a click of a button or two?
Besides, it would look more professional if admins were to run these powerful suites of traceroute tools that can:
- Perform more efficiently than CLI commands
- Save time because they use threads instead of locking on to a single execution
- Deliver accurate information in real-time, round-the-clock
- Report their findings in clear, more understandable, and aesthetical formats
But, let’s not forget that there are online web applications or websites that also do a great traceroute job. We will see them after the six best traceroute alternatives.
The best Traceroute alternatives
Our methodology for selecting a Traceroute alternative
We reviewed the market for network testing system like Traceroute and analyzed tools based on the following criteria:
- An automated utility to test network connections
- The option to store query result for later comparison
- Analysis of both network and internet connections
- A visual representation of connection performance
- Recursive scans
- A free trial or a free tool to avoid paying for a system that doesn’t work well
- Value for money from a package that is worth paying for or a free tool that is worth bothering with
With these selection criteria in mind, we identified some useful connection testing systems that compete well with Traceroute.
1. Site24x7 (FREE TRIAL)

Site24x7 is a cloud-based (AI-powered) network observability platform from Zoho. It includes a suite of network diagnostic tools, including powerful alternatives to traditional Traceroute.
Instead of just giving you a simple hop-by-hop list, Site24x7 improves the entire path analysis through tools like MTR (My Traceroute) and RUM-based traces. It also provides real-time visualizations to improve analysis even more. These features make it easier to understand latency and packet loss or identify network bottlenecks.
Key Features:
- Three Traceroute Modes: Offers a free web-based traceroute, an MTR-based continuous traceroute, and a RUM-integrated traceroute from end-user perspectives.
- Interactive Network Path Mapping: Traceroute results are displayed visually with each hop’s metrics. This makes it easier to identify problematic segments.
- Broader Network Diagnostics: Includes continuous ping, bandwidth usage, SNMP monitoring, DNS resolution, port scanning, and device health monitoring.
- Custom Alerts and Dashboards: Site 24×7 lets you define thresholds and create dashboards. This is helpful for visualizing route performance and receiving alerts on hop latency, loss, or failure.
- Global Testing Points: Supports traceroute execution from 90+ worldwide locations to help you pinpoint geographic network issues.
- Cloud-Based Access: Accessible through a browser with optional lightweight agents for local infrastructure monitoring.
Why do we recommend it?
Site24x7 takes the traditional traceroute tool to a whole new level by pairing real-time route tracking with broader observability features. So, instead of just getting a single snapshot, this tool gets you continuous path monitoring so you can spot recurring issues like intermittent latency or route flapping.
The system overlays path hops with metrics like packet loss and round-trip time. This feature is handy for narrowing down where performance dips occur. Plus, when combined with SNMP and NetFlow data, you get a much more detailed view of how network segments are performing (not just where they are.)
Site24x7 can run traceroutes from dozens of global locations. As a result, you can uncover region-specific problems. In addition, its MTR-based tracking adds historical insight by showing how a route has changed over time.
We also recommend Site24x7 for its RUM-powered traceroute, which offers user-centric diagnostics. This makes it easier to troubleshoot issues from the perspective of someone actually experiencing a slowdown. Plus, these features provide depth and clarity that go far beyond what basic command-line tools can deliver.
Who is it recommended for?
Site24x7 redefines how tracerouting is done. It is perfect for businesses of all sizes, from startups to enterprises. We also recommend it for IT teams managing hybrid environments or distributed sites. In particular, these teams will see the value from the platform’s unified monitoring, traceroute insights, and proactive alerting. Managed Service Providers (MSPs) will also love the multi-tenant support. Meanwhile, network engineers get the flexibility to drill down into hop-specific diagnostics with global reach.
Pros:
- Combines traceroute with network, server, and application monitoring
- Visual route maps and hop metrics make diagnostics faster
- Global traceroute points offer region-specific testing
- Custom alerting system for network route changes or failures
- Quick setup with no on-prem infrastructure required
Cons:
- Advanced traceroute tools are not included in the free tier
- Steeper learning curve for complex alerting or plugin integrations
- Cost can scale with number of monitors and endpoints tracked
Site24x7 offers a fully functional 30-day free trial with no credit card needed, giving access to advanced traceroute and diagnostic tools. After that, monitor-based plans start at $9/month. A free-forever tier with 5 monitors is also available.
EDITOR'S CHOICE
Site24x7 Infrastructure Monitoring is our top pick for a Traceroute alternative. It blends visual network path analysis with continuous monitoring, smart alerts, and full-stack diagnostics. Traditional traceroute tools only show you the path once. But Site24x7 takes this to a whole new level. It watches paths continuously and maps them without adding complexities. It also integrates broader performance metrics so you can see why a route is failing, not just that it is. The platform’s multiple traceroute modes, SNMP device visibility, and cloud flexibility make it ideal for diagnosing modern network issues, earning it our Editor’s Choice.
Download: Get a 30-day free trial
Official Site: https://www.site24x7.com/infrastructure-monitoring.html
OS: Cloud-based SaaS (web console compatible with all OS; agents for Windows/Linux optional)
2. ManageEngine OpManager (FREE TRIAL)

ManageEngine OpManager comes with built-in traceroute capabilities that monitor the path and time taken by data packets to travel from source to destination. This information is presented in the form of reports to better understand the cause of the problem. It improves troubleshooting efficiency as well.
Key Features:
- Integrated traceroute tool.
- Detailed metrics for every hop.
- Detects Cisco IP-SLA.
- Easy-to-understand reports.
- Identifies underperforming devices.
Why do we recommend it?
One of the standout features of OpManager is its built-in traceroute capabilities, which integrate with extensive network monitoring metrics to provide detailed visibility into your network’s status and performance. More importantly, you don’t have to switch between tools to know specific information about your infrastructure, as everything is available through a single console.
We also like the report format, as it is intuitive and helps even non-technical people to understand the network’s state and performance.
Who is it recommended for?
It is a good choice for IT teams of all sizes, network engineers, and MSPs who manage clients’ networks. All these users benefit from the detailed data that OpManager offers, making it a good alternative to traceroute.
Pros:
- No tool sprawl, as OpManager can handle end-to-end monitoring.
- Generates actionable insights and reports.
- Supports Cisco IP-SLA, making it ideal for organizations that already use Cisco.
- Offers detailed metrics.
Cons:
- Requires the right setup for traceroute data collection.
ManageEngine OpManager offers flexible pricing. You can choose from its annual or perpetual licensing models available on both the Standard and Professional editions. You can also include add-ons based on your specific needs. The final cost depends on your add-ons, type of licensing, edition chosen, and the number of devices and users. Get started with a 30-day free trial.
3. Open Visual Traceroute
With Open Visual Traceroute, we get a free and open-source tool that displays network routes and hops in detailed maps and graphs that are easy enough for even a novice user to understand and work with.
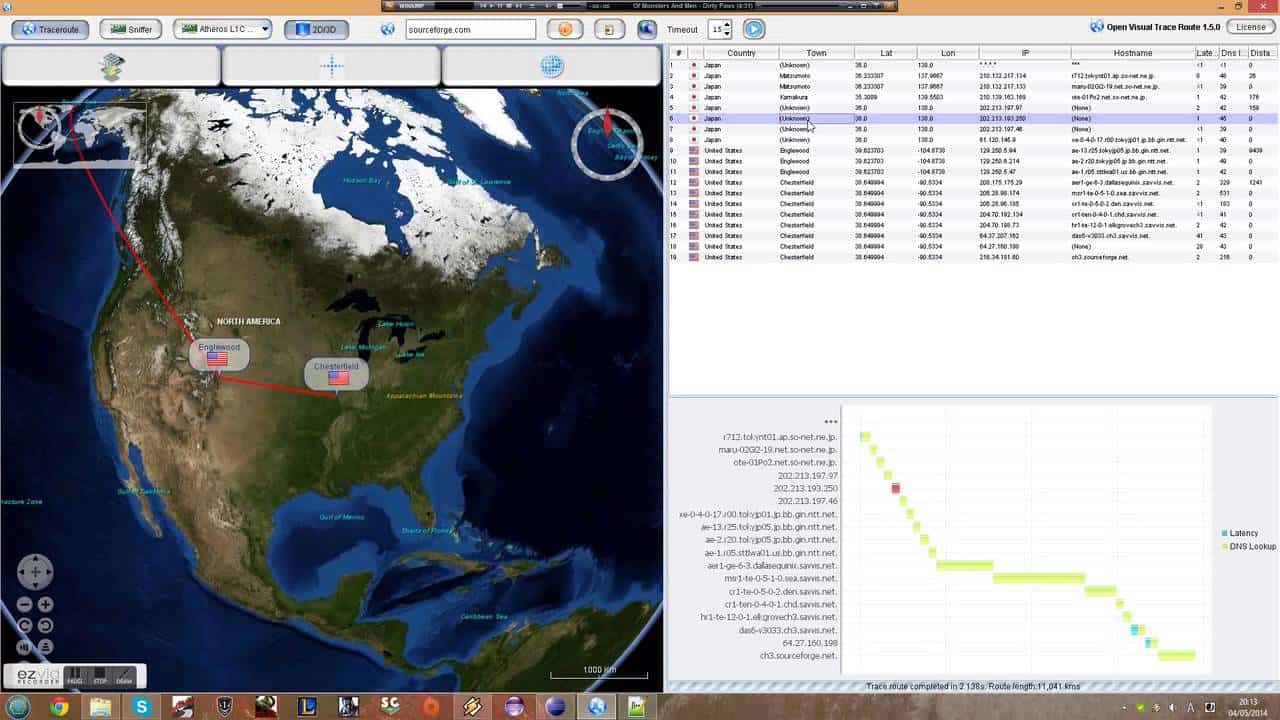
For one, it works on all popular operating system platforms – Windows, Linux, and Mac – which makes it the choice tool in mixed networking environments. Also, in case of resource scarcity or there is an inability to run 3D maps, Open Visual Traceroute can be run with less resource-intensive 2D maps.
Key Features:
- Real-world map
- Table of results
- Performance graph
- Network troubleshooting tools
Why do we recommend it?
Open Visual Traceroute presents a busy interface with a map, a table of results, and a graph. The system operates on paths to remote locations; it doesn’t provide network discovery or network mapping, so the visuals are not so impressive if you are testing your LAN.
It also offers more network troubleshooting features like a network packet sniffer for the identification of the data that is on a network and WhoIs to help query for information about domains.
Who is it recommended for?
This is a nice free tool that will be of interest to home users. However, its inability to depict network paths means that it won’t be a good choice for network administrators. Identifying the performance of paths across the network can be informative, but there isn’t much that an administrator can do to fix internet problems.
Pros:
- A free option that provides visuals to the traditional traceroute command
- Available cross-platform
- Easy to use, even for non-technical users
Cons:
- Lacks long-term monitoring capabilities
For tech experts who expect more from the traceroute tool, they can download the source code for further customization.
Otherwise, you can simply download your FREE versions of Open Visual Traceroute for Windows, macOS, and several versions of Linux.
4. PingPlotter
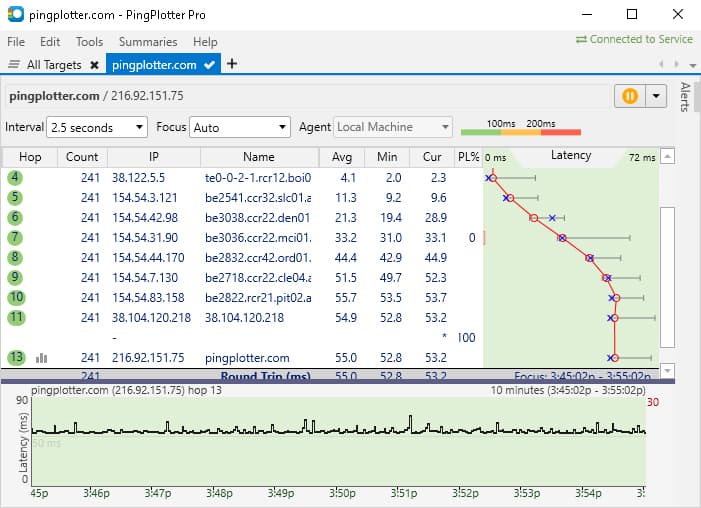
PingPlotter gives you the clearest window you could ask for when you need real-time insights into your network.
This traceroute tool is available for Windows, Linux, macOS, and iOS devices. PingPlotter collects end-to-end data and plots important diagnostic insights on detailed graphs. It works faster than any other solution out there, which helps in taking immediate action based on informed decisions.
Key Features:
- Real-world map
- Table of results
- Performance graph
Why do we recommend it?
PingPlotter is an impressive tool and its community forum that enables network administrators to provide advice to each other is a definite plus. However, the tool is limited to testing paths, Traceroute style, and it doesn’t provide constant monitoring. The Professional edition provides network discovery.
PingPlotter uses both Ping and traceroute; this means issues like latency, jitter, or packet loss are displayed for each hop in a route making it easy to immediately pinpoint connectivity problems. The tool can be configured to trigger automated actions.

Despite such functionalities, PingPlotter has a tiny footprint. This is because it uses a software-based agent which allows it to be up and running and start collecting evidence and performance metrics, in mere minutes.
It is easy to collaborate with colleagues who also use this tool; whole teams can monitor hundreds of devices at once. It even helps with troubleshooting and resolving issues that remote work-from-home users may be having.
There are three versions of PingPlotter: Standard Edition, Professional Edition, and Cloud Edition. PingPlotter Cloud lets admins share live test results via URLs, show live proof, and talk through any issues. It only tests the network connections without sifting through or snooping on, user data or network traffic making it safe and non-invasive.
Who is it recommended for?
PingPlotter is most useful for frequent tests to specific remote locations, such as between sites or out to the devices of remote workers. It isn’t the best choice for a network tester and its different versions don’t build on one another – the Professional edition includes network monitoring but the higher Cloud edition doesn’t.
Pros:
- Three options including a freeware version
- Offers lightweight visualization into latency across devices
- Good for both one-off tests as well as continuous testing
Cons:
- Could benefit from a longer trial period
- TCP and UDP tests are not included in the free version
Download a 14-day FREE trial version of PingPlotter Professional.
5. Paessler PRTG Network Monitoring Tool
Paessler is one of the bigger players in the network monitoring and management tools market. They have numerous impressive and powerful solutions that cover architectures from personal computers up to cloud servers. PRTG Network Monitor is one such remarkable tool.
It is a comprehensive tool for system monitoring that employs several techniques to map and monitor networks and their connected devices. It is this constant monitoring that automates the traceroute task for administrators who can also configure it to receive alerts in case there is an issue.
Key Features:
- Part of a wider monitoring package
- Free option
- Runs repeatedly
Why do we recommend it?
The Paessler PRTG network monitoring tool provides network discovery and mapping plus constant performance monitoring. The tool also includes traffic analytical tools that use NetFlow, IPFIX, and other traffic statistics protocols. You can run a Traceroute test with this tool and check on paths across the network or the internet.
In other words, they don’t need to “run” any command; they just add a sensor to start monitoring the network.
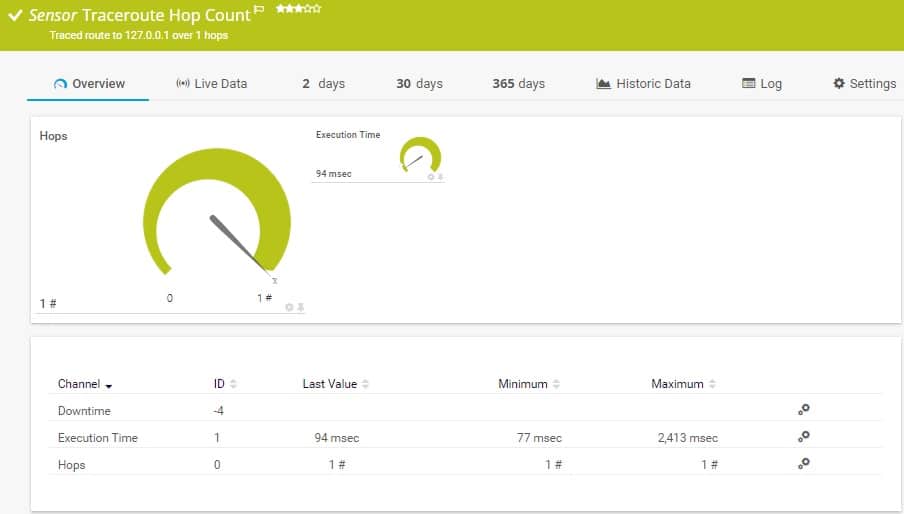
PRTG has various sensors that perform various tasks. The Traceroute Hop Count Sensor is responsible for tracing packets on the network to find out if there are any changes in configuration or if any devices are offline.

Also, PRTG has the ability to monitor the performance of web services and applications. The tool also extends its visibility to remote sites. This means admins can control several sites from one dashboard.
The results from traceroute polls can be used in collaboration with other monitoring sensors’ data for better troubleshooting and issue resolution.
Who is it recommended for?
Paessler PRTG is a good option for all businesses. The package is charged for as an allowance of sensors, so you only pay for the monitoring systems that you activate. The system is permanently free if you only activate 100 sensors. Access this system as a SaaS platform or install it on Windows Server.
Pros:
- Uses flexible sensors to monitor ping, as well as dozens of other metrics across networks, applications, and servers
- Can detect jitter and latency, useful for VoIP services
- Sensors can be customized and tailored to specific applications
- Pricing is based per sensor and allows both large and small businesses to scale within the PRTG ecosystem
- Supports autodiscovery, great for larger networks
Cons:
- Feature-rich, and takes time to learn all of the features and functionality the platform offers
You can try the FREE Unlimited Version of Paessler PRTG Network Monitor for 30 days (following which the tool reverts to the free version).
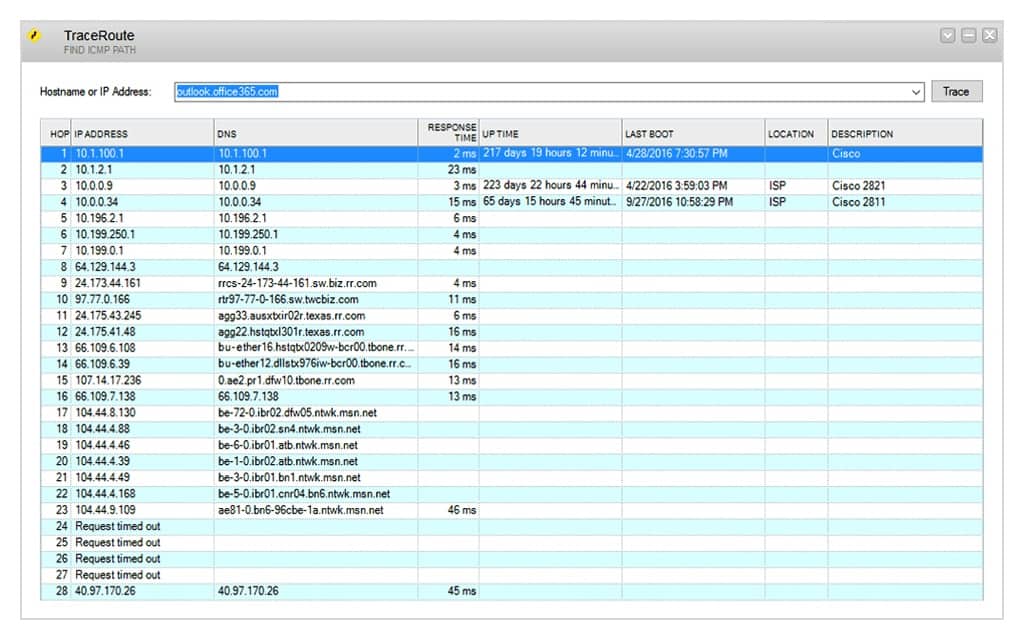
6. SolarWinds Engineer’s Toolset

Apart from the traceroute tool, SolarWinds Engineer’s Toolset has several additional network troubleshooting features that further enhance the results – and usefulness – of each scan.
Key Features:
- Easy to operate
- Well-laid out results
- Identifies DNS server
- Shows hop response time
- Part of a package of 60 tools
Why do we recommend it?
The SolarWinds Engineer’s Toolset provides a large package of system monitoring, management, and troubleshooting tools. The Traceroute utility is one of the most important features of this package. The output of this tool is a straightforward table of the traditional Traceroute report. Results are not shown on a map.
The traceroute reports are detailed, informative, and very aesthetic. The domain names and response times are displayed for each hop and represented in tables that can be easily comprehended or analyzed on their RTT, DNS, last boot times, or locations.
But, and like we’ve said, apart from troubleshooting hops and latency issues, SolarWinds Engineer’s Toolset gives administrators even more detailed insights into their networks’ current situation with features like:
- Traffic Generator – this tool creates a packet flood to simulate a network overload to see how the architecture, and the devices on it, performs in a traffic-intensive scenario
- MAC Address Scanner – admins can account for every device that is on their network and use the information to see if any are online without authorization
- Open Port Scanner – they can also find out which ports are open on your network and close them before they are compromised
- Bandwidth Gauge – admins can trace if there are any bottlenecks or bandwidth drops before they cause network slowdowns
- Subnetting Tool – they can quickly configure and reconfigure your network by using this tool for an optimized network
- View and Edit Configurations – you don’t need to log in to a Cisco switch or router to configure it when you have Engineer’s Tools at your disposal
- Edit passwords – you can take it a step further and even decrypt Cisco router passwords when you have forgotten them or the admin has quit on you
These are only a few of the numerous features that you can expect from this superb network monitoring tool.
Who is it recommended for?
The Engineer’s Toolset is much bigger than just a Traceroute tool and it isn’t free. So, it isn’t appropriate for a small business’s network administrator. Rather, this is a package that will appeal to a mid-sized business. The software bundle for the Toolset runs on Windows Server.
Pros:
- Easy to use, doesn’t include any unnecessary ‘fluff’
- Includes a suite of other helpful tools, specifically designed for network administrators and on-site technicians
- Aids in device discovery and testing
- Can help verify DNS and DHCP functionality for different devices
- Can easily export or import results from previous scans
Cons:
- Designed specifically for sysadmin, not ideal for home users
Try a 14-day fully functional trial version.
7. Path Analyzer Pro
Administrators looking for a no-nonsense traceroute tool that works quickly and reports its findings in concise, yet informative, presentation formats will be delighted with Path Analyzer Pro.
This traceroute tool is compatible with both Windows and Mac operating systems and platforms.
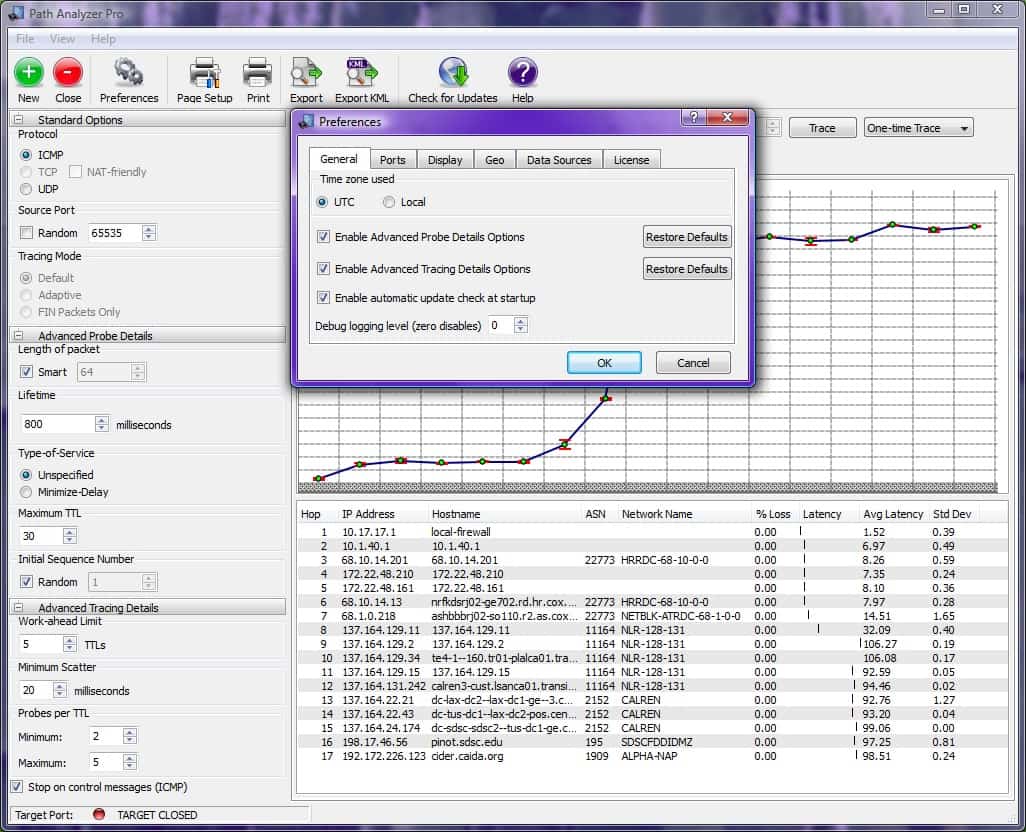
Once it starts running traceroute, it displays the route taken and includes information like the IP addresses, hostnames, average latency, and standard deviation for each device in a hop. A graph plots the route out in a way that makes it clear where the delays occur. Users can zoom in and out for clearer views. Once they are satisfied with what they see, they can print or export the reports for offline analysis.
Key Features:
- Results table
- Live performance graph
- DNS resolution
Why do we recommend it?
Path Analyzer Pro provides the standard table of Traceroute results and also has a number of graphical representations of performance. You can see a graph of times to each node on a path or access a real-world map to identify a route to a remote location. This tool is better at tracing paths across the internet than on a network.
Of course, Path Analyzer Pro has other tools that can further help with network traffic analysis: path discovery, WhoIs, firewall detection, geo-location, and network testing. Users can even trace email addresses for forensic analysis.

This charming little traceroute tool is pleasant to work with, is easy to install and use, and delivers results quickly – it has too tiny a digital footprint to even be noticed.
Who is it recommended for?
Path Analyzer Pro is available for macOS and Windows. It is a useful tool for checking on internet connections. However, its business versions are a little pricey and you can get a full network monitoring service that includes Traceroute, such as PRTG for less money.
Pros:
- Available for Mac and Windows
- Can detect network drops, latency, and jitter, making it a solid option for troubleshooting VoIP networks
- Features simple network graphing
Cons:
- Interface is clunky, especially around the protocol and tracing mode options
- Reporting lacks customization options and isn’t as user-friendly as some of the leading tools
You can download and try Path Analyzer Pro for free.
8. NetScanTools
Although they say they created NetScanTools Pro “with Network Administrators, Network Engineers or Technicians or Training Instructors in mind,” users will realize that this tool is really powerful enough to be applied in the use of penetration testing or even Open Source Intelligence (OSINT) gathering on a network. In other words, hackers can use it to gain insight into your network.

But, getting back to the traceroute capabilities of this tool; it is included in all versions of this network analysis tool. The feature uses ICMP, TCP, or UDP protocols to trace the routes taken by packets and works with both TCP IPv4 and IPv6.
Key Features:
- Flexible troubleshooting tool
- IPv6 capabilities
- Free version available
Why do we recommend it?
NetScan Tools is available in two levels and the capabilities of each are very different. The Basic package is free and it gives you straightforward network and internet connection testing systems that include Ping and Traceroute. NetScan Tools Pro provides network discovery and port testing utilities.
It also gathers statistics about packet loss and timing and displays it all, in real-time, on easy-to-comprehend charts. Admins can combine this information with data from IP scans and sweeps to find out if there are any latency or jitter issues on the network.

But that’s not all; there are even more tools that help administrators take control of their network’s performance and security: WhoIs and DNS querying, email address verification, stress testing capabilities by generating and flooding packets, and much more.
Although this tool is only available for the Windows operating system, it really would be worth the investment to get a computer or even a virtual machine and use it.
Who is it recommended for?
The audiences for NetScan Tools Basic and NetScan Tools Pro are different. The free version is a handy tool to have for ad-hoc checks on network connections. The paid system is a lot more sophisticated and can be used for security testing of networks. Penetration testers and hackers would also use the Pro version.
Pros:
- Offers a paid and free version, making it accessible for any budget
- Lightweight, the tool can be run on practically any endpoint
- Uses DNS queries to test name resolution and address scanning
Cons:
- The interface can feel outdated and a bit cluttered when scanning larger networks
- Only available for Windows operating systems
Download the free NetScanTools Basic, or try NetScanTools Pro free for 30 days.
The best online traceroute alternatives
It is a matter of convenience when it comes to using online traceroute tools: you simply enter an IP address or domain name and wait for the results to be plotted in charts or maps.
But, also remember: the disadvantage of relying on online traceroute tools is that you have no control over them – it is here today and could be gone tomorrow.
So, let’s now have a look at the online versions of the traceroute tool. Some of the best websites out there are:
1. keyCDN
This content delivery network (CDN) service provider has a dedicated page for their Traceroute Test Tool.
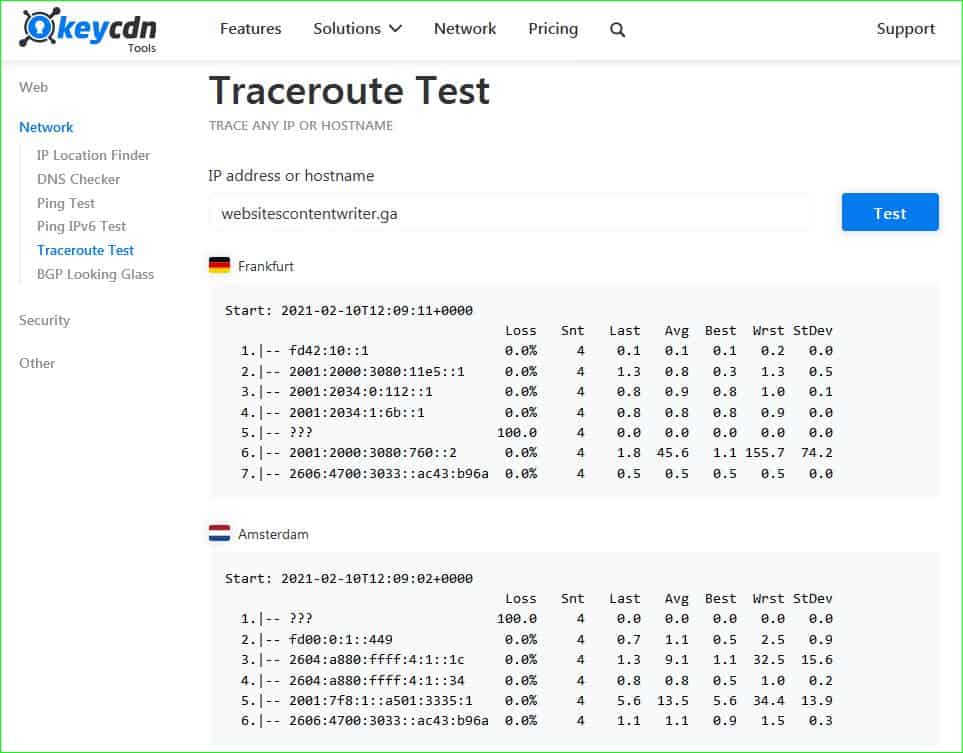
Users can simply enter the URL of a website or an IP address to start the traceroute process. What makes this traceroute tool stand out from the others is that the report you get shows the results of tests performed from various locations around the world including Amsterdam, Sydney, Singapore, and Bangalore, to name a few.
Key Features:
- Online service
- Remote test launch locations
- Tabulated results
This way, admins can see the user experience (UX) their clients would have if they were to connect to them from any part of the world.
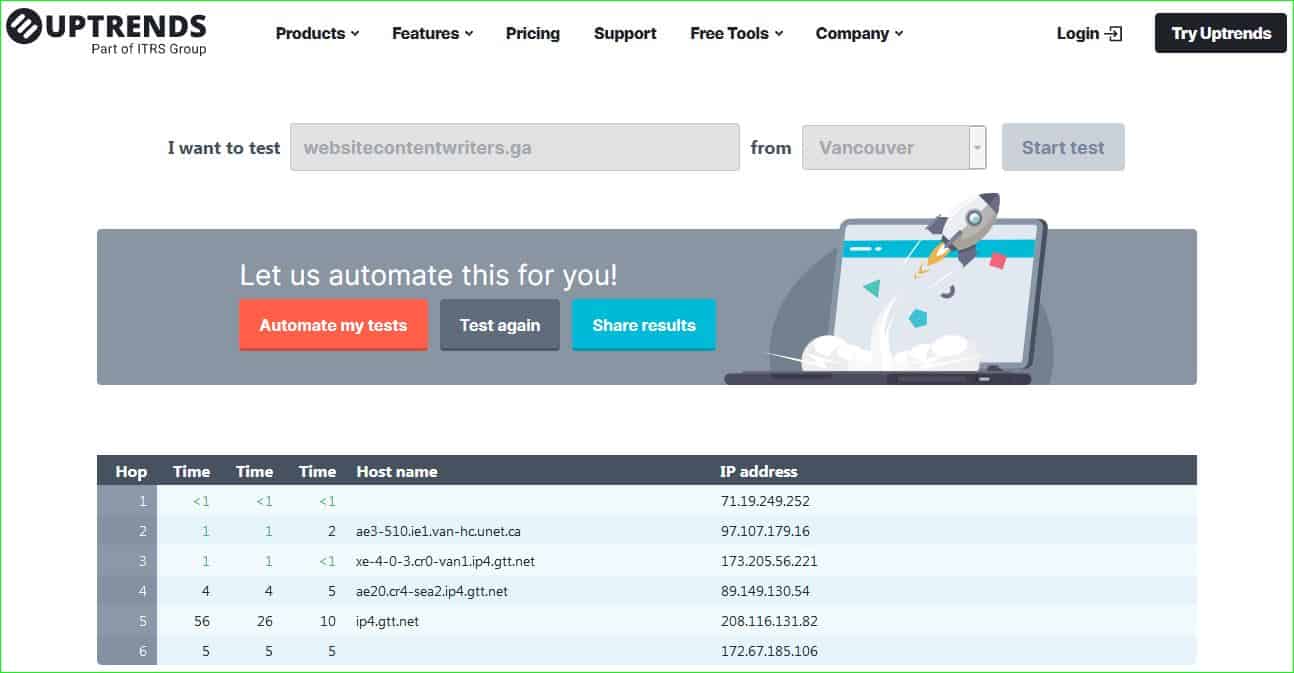
2. Uptrends
This traceroute tool comes to us from Uptrends, a website monitoring service provider that knows the value of keeping hop times low. Just like any similar tool, this tool gives details of packet hops and the times of each of their three RTTs.
Key Features:
- Website availability checker
- Choice of launch location
- Online system
But, that’s not all; here too administrators can choose the countries they want the tests to be run from with option cities including far-fetched cities like Auckland, Guadalajara, Harlem, and Honolulu.
3. GeoTraceroute
Anyone who lands on this little website will immediately feel like a kid in a toy store. It is a charming website that makes you want to start route-testing immediately.
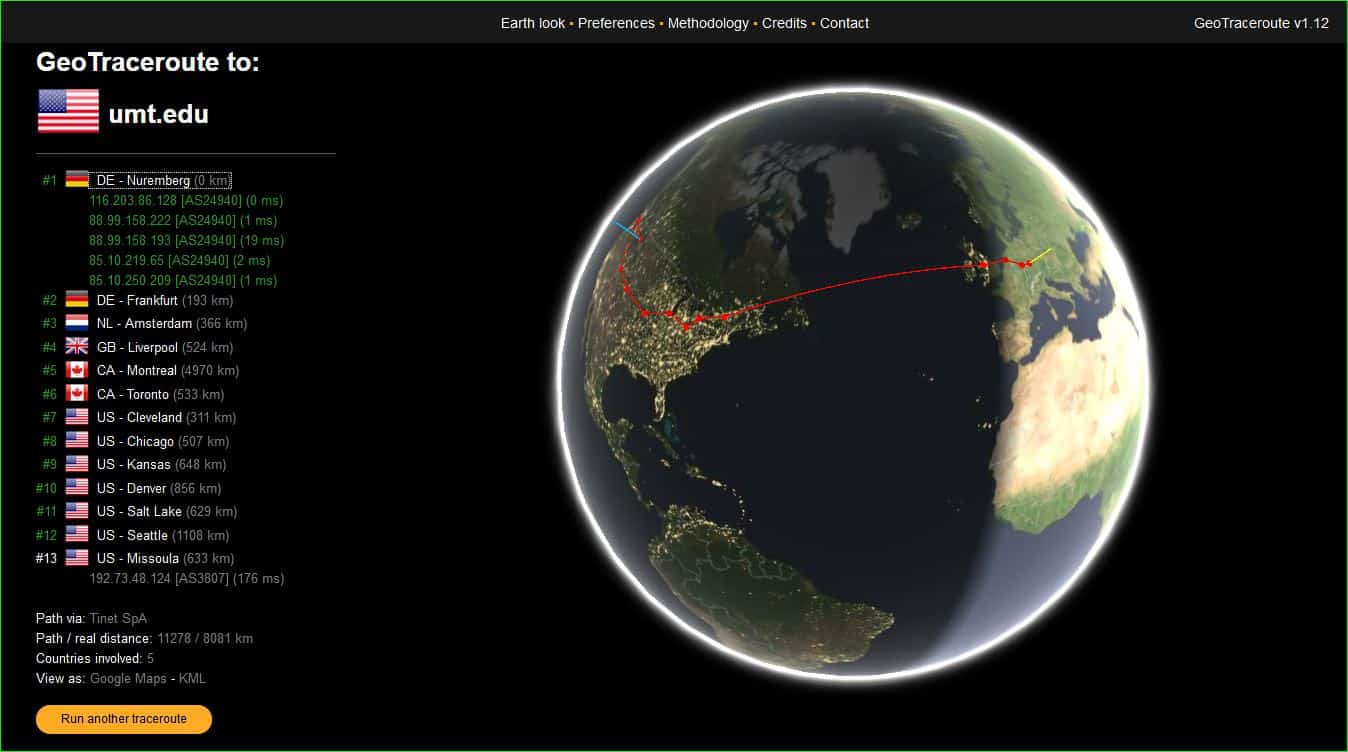
Key Features:
- Globe display
- Choice of test launch locaitons
- Attractive display
GeoTraceroute is a tool for that one quick time you need to make sure your host device is available for users in countries like Austria, Belgium, Germany, or New Zealand. It is fun looking at the places the packets go through on the interactive globe, but what is really fun is the statistics telling you exactly how far the two servers are in real life via “Path/real distance.”
Traceroute FAQs
Is Traceroute the same as Ping?
Traceroute is similar to Ping. While Ping checks on the availability and connection speed to a remote node, traceroute identifies each router in the path to a given node, reporting on the connection speed to that device.
What is tracert used for?
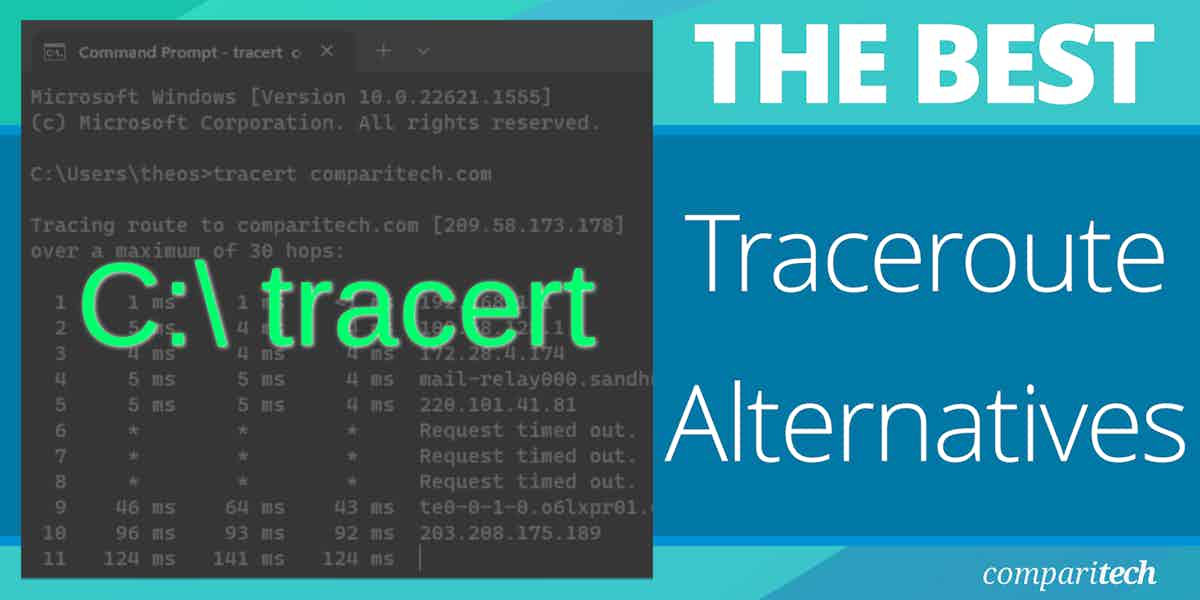
The tracert command implements Traceroute at the Windows Command line. On Linux, the command is traceroute.
How do you do a traceroute test?
To run traceroute on Windows, go to the command line and enter tracert <domain_name> or tracert <IP_address>, such as tracert comparitech.com or tracert 95.168.178.100. On Linux, the format is traceroute < domain_name> or traceroute <IP_address>.
