

Network monitoring is necessary if you manage IT and network infrastructure for any organization, be it a small business, nonprofit, or large organization. It helps keep your systems healthy, alerts you when something’s wrong, and makes planning or troubleshooting issues easier. But commercial tools with all the great features often come with steep price tags that don’t fit into tight budgets.
For obvious reasons, many SMBs, and NGOs usually turn to free and open-source network monitoring tools. However, not all open-source tools are the same. You’ll want to look at how easy they are to set up, how well they fit into your existing setup, whether they alert you in a timely way, and if they can grow with your network over time.
Free Network Monitoring Tools can help your organization avoid the following pain points:
- Avoid spending on expensive monitoring software that your budget can’t support.
- Reduce manual tracking and guesswork with automated alerts and device discovery.
- Operate without a large IT team, as the tools are simple enough for limited staff.
- Cut downtime by spotting issues early instead of reacting after failures.
- Gain visibility into your devices and network connections without complex setup or licensing.
- Prevent configuration drift and unnoticed changes with a centralized view of your network.
In this guide, we’ll break down the best free network monitoring tools for smaller teams and NGOs. We aim to help you find real-value tools without straining your budget or time.
The Evolution of Network Monitoring Tools
In the past, network monitoring tools were predominantly designed for larger organizations. However, today’s landscape has shifted, and these tools have become increasingly relevant for SMBs, NGOs, non-profits, and smaller entities.
The Growing Importance of Network Monitoring
With the surge in technological demands from both organizations and consumers, there’s been a parallel increase in the need for efficient network monitoring solutions. Even relatively modest networks can have hundreds of connections requiring oversight.
Capabilities of Modern Network Monitoring Tools
Contemporary network monitoring software isn’t just about tracking connections. They’re equipped to manage networks, servers, and applications, providing a comprehensive view and control of the IT ecosystem. This multifaceted capability simplifies the task for administrators, enabling them to efficiently monitor and optimize their infrastructure.
Here is our list of the best free network monitoring tools:
![]()
![]()
![]()
![]()
![]()
![]()
If you need to know more, explore our vendor highlight section just below, or skip to our detailed vendor reviews.
Βest free network monitoring tools for SMBs & NGOs highlights
Top Feature
All-in-one visibility across networks and infrastructure
Price
Free edition available, commercial edition starts from $9 per month for the Lite bundle
Target Market
SMBs, NGOs, and resource-constrained IT teams
Free Trial Length
Free plan monitors up to 50 resources, 30-day free trial of paid planAdditional Benefits:
Features:
Top Feature
Sensor based full network visibility system
Price
Free edition, supports up to 100 sensors (commercial editions start from $179, licensing based on sensors)
Target Market
Network or sysadmin and solo IT generalists in SMBs and NGOs
Free Trial Length
30- day free trial for more than 100 sensors
Read more ▼
Top Feature
Unified network and server monitoring, single dashboard visibility, alerts to fix issues before downtime
Price
Free for 3 devices, commercial starts at US$95 for 10 devices/year
Target Market
SMBs with minimal IT staff to large enterprises with complex infrastructure
Free Trial Length
Free for 3 devices, 30-day trial for Standard and Enterprise
Read more ▼
Top Feature
Automated discovery of every network device with real time visibility across multiple sites
Price
Free for unlimited device discovery with one managed device, paid monitoring starts from €1.50
Target Market
SMBs, NGOs, and MSPs that monitor multiple devices or sites at minimal cost
Free Trial Length
Always free plan for one managed device, 14-day free trial available for Domotz
Read more ▼
Top Feature
Full-stack monitoring without licensing fees
Price
Free
Target Market
Large organizations, data centers, telecom companies, and cloud service providers
Free Trial Length
Free software
Read more ▼
Top Feature
Extensible, open source monitoring framework for servers, network devices, applications, and services
Price
Free
Target Market
Network and systems administrators in SMBs or NGOs, with moderate to strong Linux skills
Free Trial Length
Free and open source
Read more ▼
Top Feature
Real time observability stack that links Prometheus metrics with Grafana dashboards for full system visibility
Price
Free
Target Market
IT teams in SMBs and NGOs with moderate technical skills who want a future ready monitoring stack without licensing costs
Free Trial Length
Free and open source
Read more ▼
Top Feature
SNMP based auto discovery with continuous monitoring of network devices
Price
Free
Target Market
Network admins and IT teams in SMBs, NGOs, universities, ISPs, and enterprises needing strong network visibility
Free Trial Length
Free and open source
Read more ▼
Top Feature
Automatic network discovery and real time topology mapping, with visual maps and alerts
Price
Free
Target Market
SMBs NGOs and small offices using MikroTik devices, need simple network monitoring at no cost
Free Trial Length
Free download
Read more ▼
Key points to consider before purchasing a network monitoring tool for SMBs and NGOs
Here are the key factors to keep in mind when choosing network monitoring tools for your SMB and NGO:
- Budget and Resource Constraints: Free tools are essential for SMBs and NGOs operating under tight financial limits. However, “free” shouldn’t mean sacrificing reliability. You should use tools that offer stable, production-ready features without hidden licensing costs or overly restrictive limitations.
- Ease of Deployment and Learning Curve: Choose solutions with intuitive interfaces or strong community documentation to reduce setup and training overhead.
- Scalability and Long-Term Viability: Your organization may grow or evolve. Opt for tools that can scale with your needs.
- Compatibility with Existing Infrastructure: Choose tools that integrate well with your current environment, including support for SNMP, Windows/Linux servers, routers, switches, and virtual/cloud platforms. Mixed-infrastructure support is key for many NGOs and SMBs.
- Community and Documentation Support: Free tools often rely on community support. A strong, active user base and well-maintained documentation can make a huge difference when troubleshooting or customizing configurations.
- Alerting and Visualization Features: Reliable alerting and clear visualization (dashboards, graphs, maps) help you catch and resolve issues faster.
To dive deeper into how we incorporate these into our research and review methodology, skip to our detailed methodology section.
The Best Free Network Monitoring Tools
So what exactly can you get for free? A network monitoring tool not only frees up time that is spent on tedious administrative tasks but also boosts an administrator’s ability to respond to small issues before they become more complex and problematic.
Features Comparison Table
Product / Features | Site24x7 | Paessler PRTG | ManageEngine OpManager | Domotz | Zabbix | Nagios Core | Prometheus & Grafana | LibreNMS | The Dude (by MikroTik) |
|---|---|---|---|---|---|---|---|---|---|
| Device Performance Graphs | Yes | Yes | Yes | Yes | Yes | Yes | Yes | Yes | Yes |
| SNMP | Yes | Yes | Yes | Yes | Yes + ICMP | Yes | Yes (via SNMP exporter) | Yes | Yes |
| Network Topology Maps | Yes | Yes | Yes | Yes | Manually configurable maps | via Google API | Not native; possible via custom Grafana dashboards | No | Yes |
| Alerts | Yes - email, SMS, voice call, push notifications, third-party | Yes, SMS, email, slack and other third-party | Yes - email, SMS, webhook | Yes - email, SMS | Yes - email, SMS, Jabber, Ez texting, or a custom script. | Yes - SMS & Email | Yes - email, slack and other third-party | Yes | Yes |
| OS | Cloud-based | Any OS | Windows, Linux | Cloud-based | CentOS, Debian, Oracle Linux, Red Hat Enterprise Linux, and Ubuntu. | Linux (server); monitors Windows and other OS via agents/plugins | Windows, Linux, Darwin | Linux, Docker | Windows; works with 32-bit Wine environments |
| Free version monitoring limited to: | 5 Server Free Edition | 100 sensors | 3 devices Free Edition | Unlimited | Unlimited | Unlimited | Unlimited | Unlimited | Unlimited (free tool; no license-based cap) |
| Download, Free Trial | 30-day free trial | 30-day free trial | 30-day free trial | 14-day free trial | Free Download | Free Nagios Core download; optional 30-day Nagios XI trial (commercial) | Free Download | Free Download | Free Download |
1. Site24x7 Server Monitoring (FREE EDITION)
Best For: SMBs, NGOs, and resource-constrained IT teams.
Price: The lowest paid plan (Lite) starts at $9 per month.

Site24x7 is a cloud-based observability platform designed for IT operations and DevOps. The software simplifies the management of IT infrastructure, applications, and websites without requiring a large IT team. It provides real-time visibility into server uptime, application performance, network health, and website reliability. Its design is particularly suited to organizations with limited resources.
Site24x7 supports a wide range of technologies including open-source technologies and platforms. In fact, its dedication to supporting a diverse range of open-source services, technologies, platforms, and frameworks underscores its commitment to innovation. The development team continuously works to expand these capabilities, ensuring that users have access to the latest tools and functionalities.
Site 24/7 is easy to deploy, scales well, and offers global monitoring. Costs can rise as you add more monitors, and some advanced configurations may take time to set up. There is a Site24x7 free plan that can monitor up to 50 resources (e.g. servers or websites) and get instant email alerts when they go down.
When you outgrow the free tier, you can move into paid plans that support more monitors, richer features, and more frequent polling. Overall, it delivers substantial value, but you should consider your budget and how much of its broad feature set you plan to use.
Site24x7 Key Features:
- Network Monitoring: Monitor routers, switches, and firewalls to keep your network stable with limited IT staff.
- Public & Private Cloud Monitoring: Monitor AWS, Azure, GCP, and VMware resources to control costs and catch issues early.
- Server Monitoring: Track performance across Windows, Linux, VMware, Docker, Kubernetes, and more, with quick root-cause insights.
- Application Performance Monitoring: Identify slow or failing components across major app platforms and languages.
- Website Monitoring: Check website and service uptime—HTTPS, DNS, APIs, email servers, SSL certificates—from 130+ global locations.
- Cloud Log Management: Collect and search logs without maintaining your own logging infrastructure.
- AIOps Automation: Use AI to detect anomalies, reduce alert noise, and automate routine responses.
Unique Buying Proposition
Site24x7’s key buying proposition is that it offers an all-in-one, cloud-based monitoring platform that requires no complex setup or dedicated IT team. Its free tier provides smaller organizations with meaningful monitoring capabilities, such as uptime checks and performance alerts.
The individual features aren’t unique on their own, but the way they are packaged together, especially for small teams that need reliable monitoring without complex deployment, is what gives Site24x7 its practical appeal for SMBs and NGOs.
Feature-In-Focus: Site24x7 all-in-one visibility across networks and infrastructure
The feature in focus for Site24x7 as a network monitoring tool is its unified, all-in-one visibility across networks and infrastructure. This cross-layer monitoring is a core pillar of the platform and is prominently highlighted on its website.
At the same time, it sits within Site24x7’s broader full-stack observability approach, which integrates network, server, cloud, application, and log monitoring into a single ecosystem.
Why do we recommend Site24x7?
We recommend Site24x7 because it provides maturity and operational reliability that many cloud-monitoring tools in its tier do not consistently deliver. Its feature set has been shaped over nearly two decades of real-world use across a wide mix of industries.
It’s also important to note that its development is backed by ManageEngine and Zoho, both of which have long-standing expertise in IT monitoring and cloud software engineering. This background shows in the platform’s stability, its ability to handle diverse workloads, and its structured approach to security and compliance.

Who is Site24x7 recommended for?
Site24x7 is recommended for SMBs, NGOs, and resource-constrained IT teams that need dependable monitoring without the infrastructure overhead or administrative demands of traditional enterprise tools.
It also fits organizations with distributed operations, remote offices, or hybrid cloud setups that need consistent visibility across locations and workloads.
Pros:
- AI-Assisted Visibility: Gain strong visibility with AI-assisted alerts and real user insights, even with a small team.
- Cloud-Based Efficiency: Reduce overhead with a fully cloud-based system that requires no hardware or maintenance.
- Scalability: Scale easily as you grow, whether expanding offices or adding new digital services.
- Global Monitoring: Monitor from global locations to support users across different regions.
Cons:
- Cost: Costs may rise as you add more monitors or expand coverage.
You can download Site24x7 Server Monitoring Free Edition from the Site24x7 website. However, there is a way to use the full Site24x7 system for free. This is by accessing the 30-day free trial that Site24x7 offers on the paid plan.
EDITOR'S CHOICE
Site24x7 Server Monitoring Free Edition is our top pick as a free network monitoring tool because this straightforward service will continuously check on the availability of a server, simultaneously checking that the network is functioning correctly. So, with this free tool, you get two essential functions in one: network testing and server availability checks. The system is hosted in the cloud and installs a data collection agent on one of your servers. Then you nominate which of your servers you want to test for availability. This system will check on up to five servers. Once the tool is set up, it will send a Ping to each of your registered servers and alert you by email if one of the servers becomes unavailable. The servers that you want to check on can be running Windows, Linux, macOS, or Free BSD. This might seem to be a solution only for a small network. However, if you strategically select the servers that you want to test so that they are different segments of your network, a failed test to one but not the others will tell you which switch is failing. This strategy will work better if you already know your network well, so get a network discovery and topology mapping system – many of them are free – and then you will know right away where our network is failing, thanks to the server availability reports from Site24x7. When you download this tool, you get to try out the full Site24x7 platform for free for a month, so you might as well enjoy that and if you don’t want to buy at the end of the trial, you will be happy with the Free Edition.
Download: Download this free tool
Official Site: https://www.site24x7.com/signup.html?pack=44&l=en&lp=3
OS: Cloud based
2. Paessler PRTG Network Monitor (FREE EDITION)
Best For: Network/sysadmin or solo IT generalists in SMBs or NGOs.
Price: Free
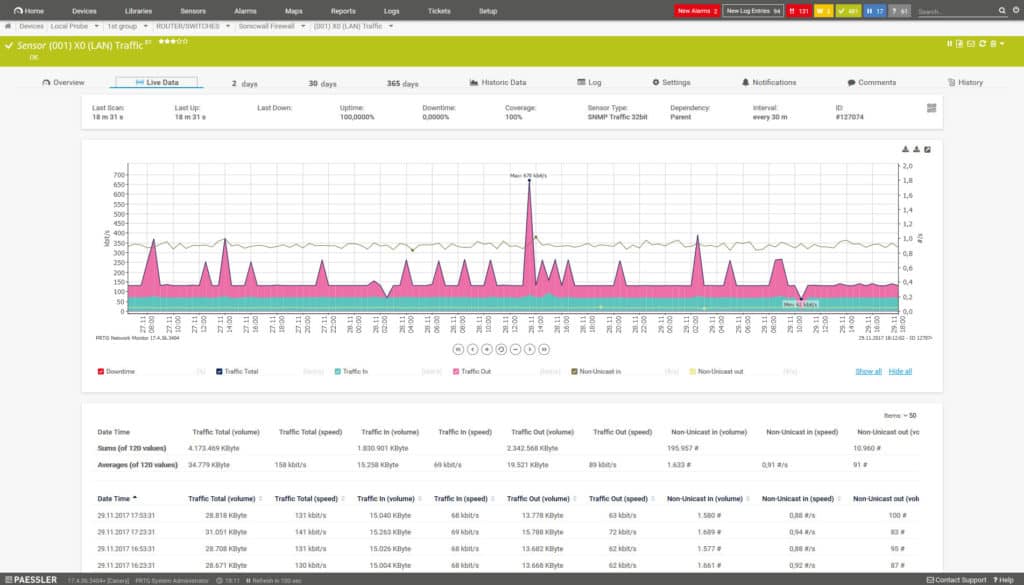
Paessler PRTG Network Monitor (short for Paessler Router Traffic Grapher) is a Windows-based network monitoring tool developed by Paessler GmbH. It helps you keep track of key system metrics like bandwidth usage, uptime, and device health by gathering data from routers, switches, servers, and various applications. The way it works is through “sensors”. Each sensor monitors a specific aspect of your network. For example, you might use a sensor to monitor email performance or track hardware status on a switch or server. It’s a flexible setup that lets you tailor monitoring to precisely what your network needs.
PRTG free version gives you real, production-ready monitoring capabilities for up to 100 sensors, without nagware or gotchas. Based on extensive research and first-hand experience, this is one of the few tools that offers serious functionality with a minimal learning curve.
If you’re responsible for keeping systems online with minimal overhead and zero budget flexibility, PRTG Free is a wise, strategic choice. However, you need to be mindful of the sensor cap, monitor subscription pricing, and don’t expect advanced analytics out of the box. PRTG is a polished, reliable starting point for core network visibility and uptime assurance.
PRTG Key Features:
- Automatic Network Discovery: PRTG scans your network and populates it with monitored devices such as servers, switches, firewalls, and printers without requiring deep technical intervention.
- Custom Dashboards & Alerts: The web interface is clean and highly customizable, and you’ll appreciate how quickly you can set up email/SMS alerts for just about any metric.
- Sensor-Based Model: You get 100 free sensors, enough to monitor several critical devices with multiple metrics (CPU, bandwidth, uptime, etc.). One sensor equals one metric on one device.
- Maps & Reporting: With just a few clicks, you can build real-time maps of your infrastructure and generate professional reports.
Unique Buying Proposition
PRTG’s most significant advantage for SMBs and NGOs is its ease of deployment and use, even if you’re a one-person IT team. Unlike many open-source tools that require Linux expertise, a steep YAML learning curve, or scripting, PRTG installs in minutes on Windows and is immediately usable. From a buyer’s standpoint, this makes it incredibly cost-effective: no budget approval cycles, no licensing negotiations, and minimal training time.
Feature-In Focus: Sensor-based, full-network visibility system
The most important feature of PRTG Network Monitor is its sensor-based, full-network visibility system. PRTG automatically discovers devices and uses a wide variety of built-in sensors to monitor CPU, memory, disk, bandwidth, traffic, uptime, and more across servers, switches, routers, applications, and cloud services.
This enables you to see the health and performance of your entire infrastructure from a single unified dashboard, receive instant alerts when thresholds are breached, and proactively spot issues before they escalate.
Why do we recommend PRTG?
From a practical perspective, PRTG delivers both ease of use and deep insight. We’ve seen it help small teams stay on top of their infrastructure without needing an entire monitoring department.
It’s also one of the few tools where the free version is viable long-term, not just a limited-time trial. And since PRTG has been around for over two decades, it benefits from a mature codebase, a vibrant user community, and continuous updates from Paessler.
Who is PRTG recommended for?
We recommend PRTG for network/sysadmin or solo IT generalists in an SMB or NGO who need basic visibility into 5–10 devices.
Pros:
- Free Tier: Free for up to 100 sensors—no time limit.
- User-Friendly: Extremely user-friendly with excellent documentation.
- Fast Setup: Auto-discovery for quick setup.
- Monitoring Features: Includes alerting, maps, dashboards, and reports.
- Platform Compatibility: Runs on Windows, which many SMB environments already use.
Cons:
- Sensor Limits: Sensor limits can be restrictive for growing networks.
One of the biggest attractions of PRTG Network Monitor is its flexible pricing structure. There is a freeware version of PRTG Network Monitor that supports up to 100 sensors. If you need more than 100 sensors you can download 30-day free trial.
3. ManageEngine OpManager (FREE TRIAL)
Best For: SMBs with minimal IT staff to large enterprises with complex infrastructure.
Price: Free for 3 devices.

ManageEngine OpManager is a network and server monitoring platform that has been in use for more than 15 years. It is consistently referenced in technical documentation, deployment case studies, and network-operations forums. Its design aligns with common approaches used in established network-management systems, and incorporates features such as SNMP and WMI polling, flow analysis, device templates, topology mapping, and fault management with correlation capabilities.
NGOs can use OpManager’s Free Edition to monitor their most important network devices at no cost. The free version supports monitoring a small set of critical devices, such as a core router, firewall, or key servers. It also includes essential features like device health checks, performance metrics, alerts, dashboards, and basic reporting.
Overall, OpManager provides SMBs and NGOs with a simple way to monitor routers, servers, virtual machines, and wireless networks from a single dashboard. Even with a small IT team, you can track performance, receive alerts, and fix issues before they cause downtime. You can start with the free edition and upgrade to paid plans as your network expands.
OpManager Key Features:
- Network Monitoring: OpManager helps you see how your systems are performing and quickly spot problems before they affect your operations.
- Physical & Virtual Server Monitoring: Monitor both physical servers and virtual machines like Hyper-V, VMware, or Citrix. This ensures your critical servers run smoothly without the need for a large IT team.
- Wireless Network Monitoring: Track your WiFi signal strength, traffic, and overall network health to make sure staff and volunteers can connect reliably across your organization.
- Cisco ACI Monitoring: Get a clear view of your Cisco ACI network, including controllers, fabrics, and endpoint groups, so you can manage your infrastructure with confidence.
- Storage Monitoring: Keep tabs on storage devices, capacity usage, and growth trends. This helps you avoid running out of space and ensures important data is always available.
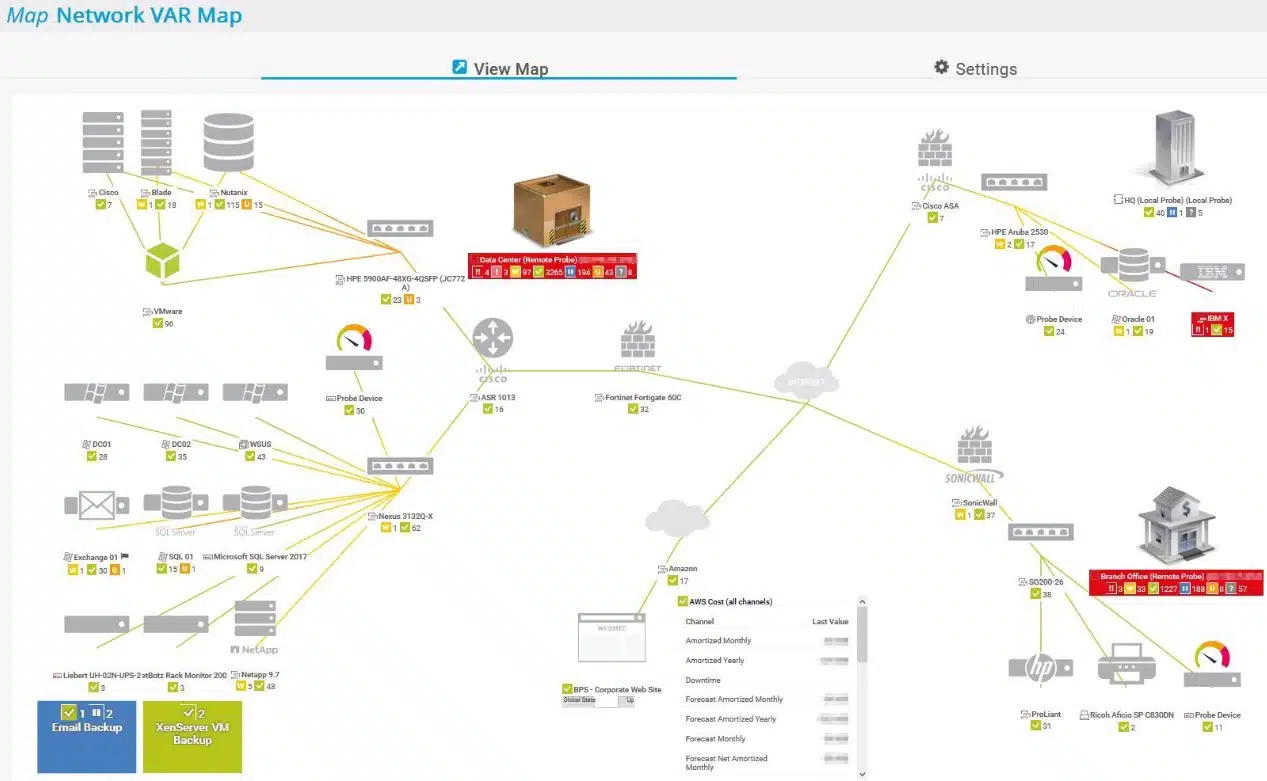
- Distributed Network Monitoring: Monitor multiple locations from one central dashboard. Remote probes give you detailed insights into network health across all your sites.
- Network Visualization: See your network layout at a glance using Layer 2 maps, virtual topology maps, business views, and 3D floor or rack views. This makes planning upgrades and troubleshooting easier.
- Fault Management: Raw network events are filtered and correlated into meaningful, color-coded alarms by severity.
Unique Buying Proposition
A practical advantage for SMBs and NGOs is that OpManager enables them to monitor multiple parts of their IT infrastructure, including routers, servers, and virtual machines, from a single dashboard.
The interface and workflows are structured to allow staff without extensive IT training to handle routine monitoring tasks. Many alternative platforms either require more technical expertise or limit the scope of monitoring. And most importantly, OpManager’s free edition and comparatively modest licensing costs offer a lower barrier to entry than most enterprise-oriented network management solutions.
Feature-In-Focus: OpManager’s unified, full-stack network and infrastructure monitoring
The standout feature of OpManager is its unified, full-stack network and infrastructure monitoring that covers networks, servers, storage, virtual environments, and data centers. The result is automatic device discovery and topology mapping, real-time performance metrics across 2,000+ data points, fault detection, bandwidth/traffic analysis, and alerting.
Why do we recommend ManageEngine OpManager?
We recommend ManageEngine OpManager because it offers a practical, low-risk way for SMBs and NGOs to maintain network visibility, identify problems quickly, and ensure reliable operations without needing a large IT team or heavy investment. Even the paid editions are relatively affordable compared with enterprise-oriented platforms.
Who is ManageEngine OpManager recommended for?
OpManager targets any organization that needs network and server visibility, performance monitoring, and fault detection, from small teams with minimal IT staff to large enterprises with complex infrastructure.
Pros:
- Ease of Use: Staff without deep IT knowledge can handle daily monitoring tasks thanks to an intuitive interface and simple workflows.
- Proactive Alerts: Built-in alerts and dashboards let you spot and fix problems before they disrupt your work or services.
- Flexible Pricing: The free edition and affordable paid options let you start small and expand monitoring only as your network grows.
Cons:
- Device Limits: The free edition only covers a limited number of devices, which may not be enough if your network grows quickly.
The Free edition is limited to monitoring three devices. The Standard edition is able to monitor 1,000 devices and it is suitable for monitoring one site. The Enterprise edition has even greater capacity and it is able to unify the monitoring of networks on many sites. You can get a 30-day free trial of the Standard and Enterprise editions. OpManager installs on Windows Server and Linux.
4. Domotz (FREE TRIAL)
Best For: SMBs and MSPs who want to monitor multiple devices or sites at minimal cost.
Price: Free for discovery and visibility. Starts at €1.50 for monitoring and management.
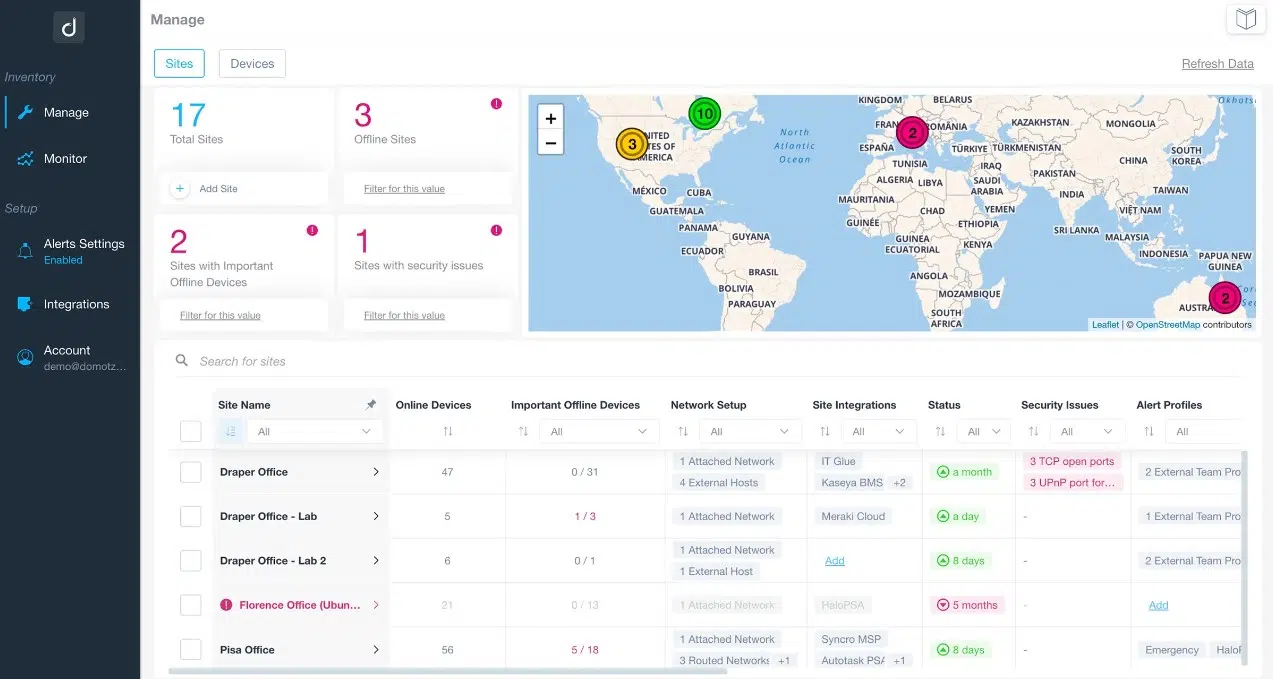
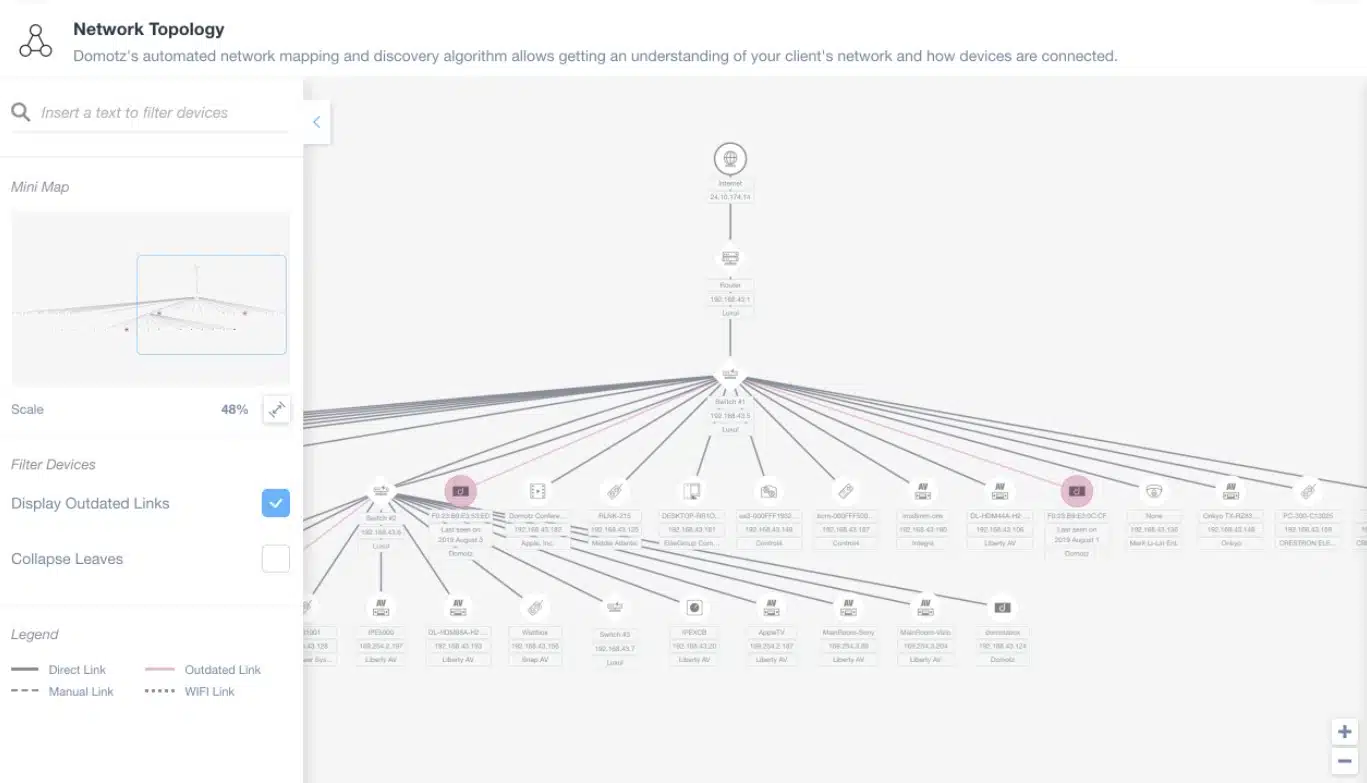
Domotz is a cloud-based remote network monitoring platform that offers easy deployment with minimal configuration. Domotz provides SMBs and NGOs a very practical way to monitor and manage their network remotely. It integrates device discovery, real-time status tracking, and built-in remote-access tools in one lightweight platform.
Domotz automatically identifies every device on the network and keeps an updated inventory, which is especially helpful when you lack dedicated IT staff or formal asset management. However, it is built with managed service providers in mind, so some advanced capabilities (multi-tenant billing, custom automation, deep APM) assume a level of process discipline that small teams will need to adopt.
Based on our findings, some of these advanced features may require technical know-how, and costs may rise as you add more managed devices. Therefore, if you run a small team, you need to plan carefully which devices to monitor.
Domotz offers a free plan that allows you to discover and identify unlimited devices across all your networks. You also get one “Managed Device” included for free. Domotz Pro is the paid edition that unlocks full remote management and advanced monitoring capabilities.
Domotz Key Features:
- Network Discovery and Inventory: Automatically discover all devices on your network, including routers, switches, firewalls, Wi-Fi access points, VMs, and IoT devices. Domotz builds a live inventory so you always know what’s connected.
- Topology Mapping: Visualize your network with topology maps that show how devices are connected. This helps you troubleshoot issues quickly and understand network structure even with a small IT team.
- Remote Monitoring and Management: Securely access devices via RDP, SSH, or web interfaces, and perform tasks like restarting devices.
- Alerts and Notifications: Get real-time notifications when devices go offline or experience performance issues.
- Cloud-Based Access: Monitor and manage your network from anywhere using the Domotz cloud dashboard.
- Multi-Site Management: Monitor multiple locations from a single dashboard, which is especially helpful for NGOs with distributed offices or SMBs managing several branches.
Unique Buying Proposition
Domotz’s unique selling point is its integrated network management approach, including massive deployment, remote management, and cost efficiency, backed by real customer traction. It monitors over 5.5 million devices across 40,000+ networks globally, with more than 5,000 partners in over 190 countries. These figures are published on Domotz’s official “Our Numbers” page, which gives a transparent summary of its scale.
Specifically, what makes it compelling for organizations like SMBs and NGOs is its ability to provide deep visibility (automatic device discovery, topology mapping, config backups) plus remote control (power cycling via PoE or Wake-on-LAN, SSH/RDP access), all of which can dramatically reduce on-site visits.
Feature-In-Focus: Automated device discovery and real-time infrastructure visibility
The focus features of Domotz as a network monitoring tool are automated network-wide device discovery and real-time infrastructure visibility. This feature enables you to see every device on your network instantly, map the whole network topology, and monitor performance, connectivity, and configuration from a single dashboard.
Why do we recommend Domotz?
We recommend Domotz because it provides a convenient and secure way to monitor and manage networks remotely, which is especially valuable for organizations that don’t have large IT teams.
From my research and experience working with SMBs, tools that provide this level of visibility and control without requiring on-site intervention can save both time and operational costs. These and many more are the reasons we recommend Demotz for SMBs and NGOs.
Who is Domotz recommended for?
Domotz is recommended for MSPs (both large and small) who need to maintain visibility across multiple devices, sites, or locations without investing heavily in infrastructure or IT personnel.
Pros:
- Multi-Device Management: You can monitor and manage multiple devices and locations without a large IT staff.
- Real-Time Alerts: Help you respond to issues before they disrupt operations.
- Cloud-Based Access: Cloud-based access lets you work remotely without investing in hardware or infrastructure.
- Free Tier and Scalability: The free tier lets you start monitoring immediately with minimal cost, and you can scale as your network grows.
Cons:
- Device Limitations on Free Plan: Only one device is fully “managed” on the free plan; adding more devices requires paid plans.
As this is a cloud-based service, you don’t need to worry about operating system compatibility. You can access the system console from anywhere through any standard Web browser. Domotz is available for a 14-day free trial.
5. Zabbix
Best For: Network/sysadmins and cloud infrastructure teams in SMBs, MSPs, and large organizations.
Price: Free and open-source.

Zabbix was developed by Zabbix LLC, a Latvian company. Zabbix monitors IT infrastructure like networks, servers, virtual machines, and cloud services. While open-source, Zabbix has the feel and depth of a commercial product backed by years of development and a vibrant global partner ecosystem.
Zabbix has evolved significantly over time, especially in usability. In recent updates, Zabbix 7.2.x introduced advanced data visualization tools, sparkline charts across various widgets, and improvements in VMware monitoring, such as standalone hypervisor templates and maintenance mode detection.
Zabbix provides free, enterprise-grade monitoring with flexible customization, reliable alerts, and strong community support. Reviews on Gartner and Reddit praise its detailed documentation and active user base.
However, it requires a skilled team to set up and optimize. You’ll need time for configuration and interface tweaks, and SMBs with limited Linux or scripting experience may struggle with setup and SNMP integration without outside help.
Zabbix Key Features:
- Free & Open Source: Zabbix is free under the GPL license, with no hidden features locked behind a paywall. The free license is beneficial for NGOs and small businesses, where every dollar counts.
- Comprehensive Monitoring: Zabbix can monitor virtually anything, such as network devices, servers, cloud services, VMs, and applications from a single platform.
- Flexible Alerting & Automation: Zabbix lets you define precisely what constitutes a problem and how you want to be notified.
- Active Community & Documentation: Zabbix has a strong global user community and extensive official documentation. Even without a paid support plan, admins can easily find answers, templates, and plugins.
- Data Visualization: Zabbix includes built-in tools to visualize performance trends through dashboards, graphs, heat maps, and topology maps.
- Out-of-the-Box Templates: Zabbix’s extensive collection of pre-configured templates for common platforms and devices makes getting started easier.
Unique Buying Proposition
Zabbix’s unique value proposition for SMBs and NGOs is in its ability to deliver comprehensive, enterprise-grade monitoring capabilities free of licensing costs. It combines powerful features like real-time performance tracking, automated discovery, customizable alerts, and support for a wide range of devices and protocols into a single, scalable platform.
Feature-In-Focus: Zabbix’s flexible monitoring and alerting system
The most notable feature of Zabbix as a network monitoring tool is its flexible monitoring and alerting system, which provides deep visibility across networks, servers, applications, and cloud environments.
Zabbix is flexible because you can monitor almost any device or service, set custom alerts and triggers, and create personalized dashboards. It works with many protocols (SNMP, IPMI, JMX) and can use agents or agentless monitoring.
Why do we recommend Zabbix?
We recommend Zabbix for SMBs and NGOs because it delivers powerful, enterprise-grade monitoring capabilities without the burden of licensing costs. Zabbix is highly scalable, supports many protocols, and features robust alerting and automation. It provides long-term value and flexibility for organizations that need reliable monitoring but can’t afford commercial solutions.

Who is Zabbix recommended for?
Zabbix best suits IT teams with moderate to strong Linux skills and a desire for control and customization. While it’s not as plug-and-play as tools like PRTG Free or The Dude, it’s far more powerful and adaptable. It fits perfectly in SMBs and NGOs that:
- Have hybrid or multivendor environments
- Need deep monitoring across systems and applications
- Want to avoid vendor lock-in or recurring licensing fees
Pros:
- Free and Open-Source: 100% free and open-source with no feature gating.
- Full-Stack Monitoring: Full-stack monitoring from network to cloud.
- Scalability: Scales from small to massive environments.
- Integrations and Templates: Extensive template library and integrations.
Cons:
- Dashboard Tuning: Dashboards are powerful but require manual tuning.
- Technical Expertise Required: Requires strong Linux/sysadmin knowledge.
- Learning Curve: Steep learning curve for first-time users.
Zabbix is available as a download for free on CentOS, Debian, Oracle Linux, Red Hat Enterprise Linux, and Ubuntu.
6. Nagios Core
Best For: Network/sysadmin in SMBs or NGOs with moderate-to-strong Linux skills.
Price: Free and open-source.
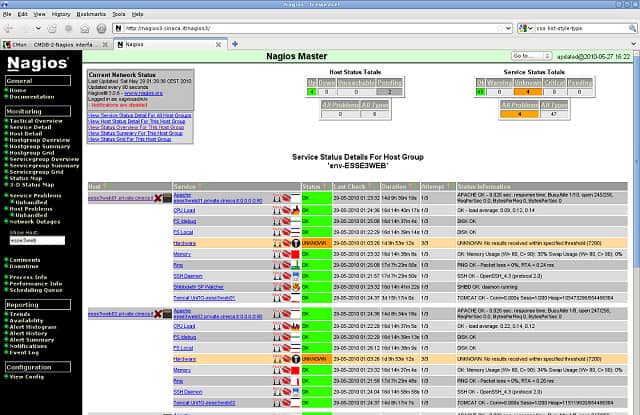
Nagios Core provides real-time monitoring and alerting for critical IT infrastructure, including servers, network devices, applications, and services. It has remained a foundational choice for IT professionals seeking a robust, customizable monitoring platform. Experts agree that Nagios Core remains one of the few open-source monitoring platforms that can scale from a small LAN to an enterprise-grade NOC with no license lock-in.
What stands out to users is the depth and precision of monitoring. Nagios doesn’t just tell you that something went wrong; it can tell you why and, with the right plugins, how to fix it automatically. From a buyer’s standpoint, it offers enterprise-grade monitoring at no licensing costs. This is ideal for organizations that need full functionality without incurring additional costs.
Earlier versions of Nagios Core required extensive manual effort for even basic monitoring. Over time, the Nagios Core Services Platform (CSP) has simplified deployment with helpful wizards, pre-built configurations, and improved documentation. These improvements have made Nagios more accessible to new users while maintaining the flexibility that power users value.
In other words, Nagios Core is a wise, cost-effective investment over time. SMBs and NGOs that want high returns with minimal costs and have the technical ability or patience to manage the setup will find Nagios Core appealing.
Nagios Key Features:
- Robust plugin architecture: Leverage thousands of community-built plugins or write your own for deep customization.
- Scalable monitoring: Monitor anything with an IP address, from websites and routers to printers and switches.
- Alerting and escalation: Flexible notification system with email, SMS, or custom script alerts.
- Historical reporting: Track downtime, SLA compliance, and event history through availability and incident reports.
- Modular design: Integrates with front-end tools (like Nagios XI, NagVis, or Centreon) and performance graphing tools like PNP4Nagios.
Unique Buying Proposition
Nagios Core’s unique value proposition for SMBs and NGOs is in its flexibility, reliability, and zero-cost entry point for building a custom, production-grade monitoring system. It offers a battle-tested platform with thousands of plugins and configurations without recurring fees.
Feature-In-Focus: Nagios’ extensible, open-source monitoring framework
The most notable feature of Nagios Core as a network monitoring tool is its extensible, open-source monitoring framework, which provides real-time visibility into the health and performance of servers, network devices, applications, and services.
Nagios Core is extensible because it uses a modular, plugin-based architecture. With this architecture, you can add custom monitoring scripts or third-party plugins to track virtually any device, service, or application. Being open-source means it’s free and supported by a large community that contributes plugins, integrations, and updates, so you aren’t limited to the vendor’s features.
Why do we recommend Nagios Core?
We recommend Nagios Core for lean IT teams that value control and customization over GUI simplicity, based on extensive research and years of hands-on use in diverse environments. While its initial setup requires a moderate learning curve, the benefits quickly outweigh the time investment.
Our thorough testing revealed that, once configured properly, Nagios Core is incredibly stable, scalable, and capable of monitoring anything from a small office network to a global multi-site infrastructure.
Who is Nagios Core recommended for?
This tool is ideal for Network and Systems Administrators in SMBs or NGOs with moderate-to-strong Linux skills, organizations with mixed environments (on-prem, virtual, and cloud), teams seeking highly customizable monitoring and alerting, and IT departments are looking for SLA tracking and reporting.
It’s less suitable for those seeking plug-and-play simplicity or full-stack, out-of-the-box UI dashboards, unless paired with GUI extensions or commercial versions such as Nagios XI.
Pros:
- Free and Open-Source: Completely free and open-source with no usage restrictions.
- Scalability: Scales well with the exemplary architecture and plugins.
- Customizability: Highly customizable with a plugin-rich ecosystem.
- Community and Documentation: Massive user community and documentation base.
- Stability: Rock-solid core that’s stable and production-ready.
Cons:
- No Native UI: No native UI for configuration (requires third-party tools or commercial front-ends).
- Learning Curve: Steep learning curve; initial setup is manual and config-file heavy.
- Alert Configuration: Alert configuration can be complex for non-technical users.
- Dashboard Limitations: Visual dashboards are basic unless enhanced by add-ons.
Nagios Core runs on Linux servers; Windows and other operating systems are monitored via agents or plugins rather than as native Nagios installations. Nagios Core is completely free and open-source, so SMBs and NGOs can download and use it at no cost for monitoring servers, network devices, and applications. If you later need a commercial option with a web interface and additional features, Nagios XI is available in Standard and Enterprise editions with a 30-day free trial; check the official Nagios website for the latest details on any free, node-limited Nagios XI licensing for non-commercial use.
Related post: Nagios vs Zabbix
7. Prometheus & Grafana
Best For: IT teams with moderate technical skills in SMBs and NGOs.
Price: Free and open-source.

Prometheus is a high-performance time-series monitoring system designed for reliability and scalability, while Grafana provides visually rich dashboards that make it easy to interpret complex metrics. Together, they form a modular, open-source observability stack that can monitor everything from server performance and application metrics to network traffic and service availability.
Prometheus + Grafana offers tremendous value for SMBs and NGOs looking to unlock deep observability and rich visualizations without licensing fees. SMBs and NGOs looking to move beyond basic ping checks into detailed performance monitoring will appreciate the insight and customization it provides. However, to succeed, you should be prepared to invest in setup, maintenance, and monitoring, especially when using cloud-based managed services where billing can become unexpectedly complex.
Prometheus Key Features:
- Zero Licensing Cost, Enterprise-Grade Insight: Both Prometheus and Grafana are open-source. SMBs and NGOs get top-tier performance monitoring capabilities with no upfront or ongoing software fees.
- Lightweight and Modular: Prometheus is easier to deploy in resource-constrained environments than heavier solutions. You can scale it up or run it efficiently on smaller setups.
- Customizable Dashboards for Non-Technical Users: Grafana allows you to build intuitive dashboards that can be shared across your teams, including non-technical stakeholders.
- Powerful Alerting and Automation: Prometheus supports highly customizable alert rules via its Alertmanager.
- Strong Ecosystem and Integration Support: Prometheus integrates well with exporters for Linux, Windows, Docker, Kubernetes, and network devices.
- Future-Proof Monitoring: As more NGOs and SMBs adopt cloud-native or containerized applications, Prometheus’s native support for microservices and dynamic infrastructures becomes increasingly valuable.
Unique Buying Proposition
The fusion of Prometheus and Grafana achieves the right balance between open-source freedom and enterprise-grade capabilities. This open-source stack offers profound insight into infrastructure, applications, and network health. Prometheus provides fast, efficient metrics collection and alerting, and Grafana transforms raw data into actionable, intuitive dashboards.
SMBs and NGOs with limited resources gain real value from this stack’s lightweight, modular, and cloud-ready design. It runs on minimal hardware, scales as needed, and adapts easily as your infrastructure changes.
Feature-In-Focus: Ability to collect, store, and visualize real-time metrics
The main feature of Prometheus and Grafana as a network monitoring solution is their ability to collect, store, and visualize real-time metrics. Prometheus gathers data from servers, applications, and network devices, and Grafana creates custom dashboards and visualizations to track performance, alerts, and system health. Together, they provide a flexible, open-source way to monitor networks, see trends, and quickly spot issues.
Why do we recommend Prometheus + Grafana?
We recommend Prometheus and Grafana for SMBs and NGOs because they offer a flexible, cost-effective monitoring solution that gives you complete real-time visibility into your systems.

Who is Prometheus + Grafana recommended for?
Prometheus + Grafana is best suited for IT teams with moderate technical skills who want a flexible, future-ready monitoring stack without paying a cent in licensing.
Pros:
- Customizability and Power: Highly customizable and powerful.
- Scalability: Scales easily with Kubernetes and cloud-native systems.
- Visualization: Rich visualization with Grafana.
- Community and Plugins: Active community and plugin ecosystem.
- Cost: No licensing costs.
Cons:
- Learning Curve: Steeper learning curve, especially with PromQL.
- Component Dependencies: Requires separate components for complete functionality (Alertmanager, Grafana, exporters).
- Setup and Dashboarding: Initial setup and dashboarding can be time-consuming
Prometheus is available as a free, self-hosted download for Linux, Windows, and macOS from the official Prometheus downloads page. Grafana can also be downloaded and run for free on your own infrastructure from the Grafana open-source download page. Together, Prometheus and Grafana give SMBs and NGOs a powerful, zero-licensing-cost observability stack they fully control and can scale as their environments grow.
8. LibreNMS
Best For: Network admins and IT teams in SMBs, NGOs, universities, and enterprises who need strong network visibility.
Price: Free and open-source.

LibreNMS is an open-source network monitoring system built primarily to automatically discover and monitor routers, switches, servers, firewalls, and other network devices without manually configuring each device. Once set up, LibreNMS continuously polls your devices to collect performance metrics, such as interface traffic, CPU load, memory usage, and port status, and displays them in graphs and dashboards.
What makes LibreNMS practical for daily operations is its SNMP-based auto-discovery combined with customizable alerting. Once it’s running, it doesn’t just sit there collecting data. It monitors your network and alerts you the moment something goes wrong.
LibreNMS is a strong, budget-friendly option for network monitoring. It’s easy to deploy, and its SNMP auto-discovery quickly identifies most devices with minimal manual effort. If you’re comfortable handling some technical setup and tuning, it delivers good value. However, device management can feel limited, and setup or maintenance may require additional effort depending on your environment, so make sure it aligns with your team’s needs before committing.
LibreNMS Key Features:
- Automatic Discovery: LibreNMS can automatically scan and map your entire network using a combination of protocols, such as CDP, LLDP, FDP, OSPF, BGP, SNMP, and ARP.
- Billing System: LibreNMS can generate bandwidth billing reports based on usage or total transfer per port.
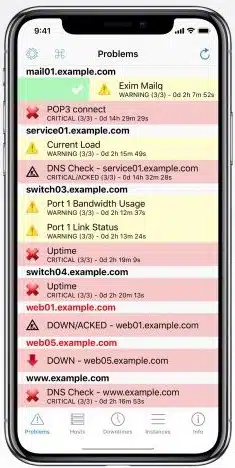
- Native iPhone and Android App: The LibreNMS native iOS and Android app gives you mobile access to key features, alerts, and system status for convenient, mobile-friendly monitoring.
- Customizable Alerting: The alerting system is highly flexible. You can choose how and where you get notified, such as by email, IRC, Slack, or other channels.
- API Access: LibreNMS’ API allows you to interact with your monitoring data or integrate with other systems as part of your workflow.
Unique Buying Proposition
LibreNMS blends ease of use and extensibility. You can deploy it quickly and see real value within hours. In contrast to Zabbix, LibreNMS leans heavily on traditional SNMP, which remains the dominant protocol in many networking environments.
It will significantly benefit SMBs and NGOs that monitor Cisco, Juniper, MikroTik, or Ubiquiti switches, routers, or firewalls. It’s also community-driven yet actively maintained, so you get the benefits of open source without being left in the dark regarding updates or support.
Feature-In-Focus: Automatic network discovery with full SNMP-based monitoring
The feature most emphasized on LibreNMS’s website is automatic network discovery with full SNMP-based monitoring. LibreNMS highlights its ability to auto-detect devices across your network, classify them, map their relationships, and begin monitoring them with no manual setup. The focus on automatic network discovery with full SNMP monitoring is important because it eliminates the heavy manual work of finding and tracking devices.
Why do we recommend LibreNMS?
We recommend LibreNMS if your primary focus is network visibility, especially Layer 2/3 devices, rather than deep application monitoring. It gives you a clear view of what’s on your network, what’s working, and what’s not.
Alerting works well, and the UI is fast and intuitive. It’s an excellent alternative for organizations trying to move away from legacy tools like MRTG, Cacti, or Observium (from which LibreNMS was originally forked).

Who is LibreNMS recommended for?
LibreNMS is best suited for network admins and IT teams in SMBs, NGOs, universities, ISPs, and enterprises who need strong visibility into their network.
Pros:
- Deployment and Ease of Use: Fast to deploy and easy to use, with no licensing costs or device limits.
- SNMP Support: Excellent SNMP support with broad vendor compatibility.
- Auto-Discovery and Alerting: Strong auto-discovery and alerting capabilities.
- Community Support: Actively maintained with a helpful community.
Cons:
- Cloud-Native Limitations: SNMP may not be suitable for monitoring cloud-native environments.
- Reporting and Analytics: Reporting and analytics are limited compared to tools like Prometheus and Grafana.
LibreNMS is completely free and open source, so SMBs, NGOs, universities, ISPs, and enterprises can deploy it without licensing costs or device limits. You can download the latest release and follow installation guides for common Linux distributions and container-based setups directly from the official LibreNMS website, giving you a cost-effective way to roll out full network monitoring on your own infrastructure.
9. The Dude by MikroTik
Best For: Network monitoring in small offices using MikroTik devices
Price: Free

The Dude is a free network monitoring and management application from MikroTik. It was first introduced in 2010 as part of the RouterOS v6 package series. Over the years, it matured from a fun add‑on into a reliable utility with visual network maps, service monitoring, and built-in alerting.
The Dude automatically scans all devices in the subnets you specify, creates a visual map of your network, monitors the services running on each device, and alerts you if any service encounters an issue. If you’re running a small office or NGO network and need intuitive maps and basic status alerts, The Dude can do the job at no cost. However, it’s not the most feature-rich or scalable solution, but it hits the mark for small teams that require straightforward monitoring with minimal fuss.
Although The Dude has evolved over the years, feature updates slowed significantly after version 6.38 (2017). Nonetheless, core functionality remained stable, and new features like advanced analytics or a cloud-native interface didn’t materialize. The slow updates likely reflect a shift toward maintaining the tool rather than innovating it.
The Dude Key Features:
- Automatic Network Discovery & Mapping: The Dude scans your network, automatically detects all devices, and generates a visual map for easy oversight.
- Multi-Protocol Monitoring: It supports SNMP, ICMP, DNS, and TCP, monitors devices, and links availability with real-time red/green status indicators and historical graphs.
- Customizable Network Maps: You can manually draw maps, add custom devices, and use SVG icons or backgrounds to tailor the visuals to your environment.
- Alerting & Notifications: The system sends alerts when services or devices go down.
- Flexible Deployment: The Dude runs on Windows and works with 32-bit Wine environments. It supports both local clients and remote server setups.
- User-Friendly Interface: Designed for ease of use, it installs quickly and doesn’t require advanced technical skills to get started.
Unique Buying Proposition
The Dude’s unique value proposition is its ability to deliver fast, visual, automated network mapping and monitoring at no cost, with almost no setup complexity. It is lightweight, intuitive, and works—you get essential network visibility, live alerts, and basic diagnostics without investing in expensive tools or deep technical expertise.
Feature-In-Focus: Automatic network discovery and real-time topology mapping
The feature in focus for The Dude as a network-monitoring tool is its automatic network discovery and real-time topology mapping. The Dude scans your network, identifies connected devices (routers, switches, servers, firewalls, etc.), and generates a dynamic, interactive map of their connectivity.
Why do we recommend The Dude?
From a buyer’s standpoint, we recommend The Dude for SMBs and NGOs because it balances simplicity, functionality, and cost-effectiveness. It provides you with a clear, real-time view of the network and sends alerts when issues arise.
It integrates natively with organizations already using MikroTik infrastructure and requires almost no additional setup. You can have a whole network map with alerts in under an hour. I know because I have managed MikroTik RouterOS for many years. And best of all, it’s completely free.

Who is The Dude recommended for?
We recommend The Dude for SMBs, NGOs, and small offices. It’s beneficial if you’re already using MikroTik devices since it integrates seamlessly with RouterOS. Nontechnical users can easily map, monitor, and manage their network with minimal hassle.
Pros:
- Visual Network Mapping: Instant visual mapping of the network with traffic status.
- Minimal Setup: Minimal setup time—install on Windows, point it to your LAN, and go.
- Remote Access: Built-in remote access for rapid issue resolution.
- Cost and Adoption: Completely free and easy to adopt.
Cons:
- Scalability Limitations: Stumbles in large or complex environments and lacks enterprise-grade proxies.
- Device Management: Limited device configuration or scripting; primarily read-only SNMP/ICMP monitoring.
- User Interface: UI and feature set feel dated compared to modern alternatives.
- Development Updates: Development updates have been slow, though recent movement suggests renewed support.
The Dude is completely free from MikroTik, making it an attractive option for SMBs, NGOs, and small offices that need basic visual monitoring without paying for licenses. You can download The Dude directly from MikroTik’s official The Dude and install it on a Windows system to start discovering and mapping your network in minutes, especially if you already rely on MikroTik devices in your environment.
Deciding on a free network monitoring tool
As you can see there is plenty of choices when it comes to high-functioning network, server, and application monitors. Whether you’re an SME that needs to add a little more scrutiny to your network monitoring or a large enterprise that needs to have the possibility of upscaling future infrastructure, there is a platform out there for you.
Our top pick for SMBs on this list is Site24x7 Free Server Monitoring.
Site24x7 Free Server Monitoring delivers a lightweight, cloud-based approach to infrastructure monitoring that lets you see the health of your key servers and services at a glance. The console surfaces availability and performance status without forcing you through complex navigation trees or cluttered dashboards, so small teams can quickly spot issues and act before they impact users.
Paessler PRTG Network Monitor, another strong choice for SMBs and NGOs, offers an analytical lightweight approach to network monitoring that allows users to see which devices are up or down at a moment’s notice. You don’t need to mess around with fancy displays or complex navigation trees in order to find the information you need.
Both these products are accessible to smaller enterprises and epitomize the modern network monitoring experience that has become so familiar. If you’d rather go the open-source route then Zabbix is also a welcome alternative. It offers excellent out-of-the-box templates and support along with a robust alerts system.
Our methodology for choosing the best free network monitoring tools for SMBs & NGOs
We evaluated tools in this category using broad IT software criteria. Our focus was on how well each option performs under the resource constraints typical of smaller organizations and NGOs. Our assessment centered on the following factors:
Ease of deployment: We assessed how quickly the software can be installed, configured, and deployed without specialized expertise.
1. Learning curve
We assessed the intuitiveness of the interface, workflows, and core features, as well as the time required for an administrator to become proficient.
2. Resource efficiency
We examined how well the software performs on modest hardware or virtual environments.
3. Scalability for growth
We assessed whether the tool can handle increased device counts, additional locations, or higher data volumes without significant rework.
4. Compatibility and integration flexibility
We assessed the software’s ability to run across diverse operating systems, device types, and protocols.
5. Community strength and documentation quality
We assessed whether users have access to reliable guides, troubleshooting support, extensions, and active community forums that support long-term use.
6. Alerting and visibility reliability
We assessed the software’s ability to detect issues, provide meaningful insights, and deliver dependable notifications when problems arise.
7. Maintenance effort
We assessed the extent of ongoing tuning, updates, and oversight required to keep the software stable and effective over time.
This structured approach ensures our recommendations are based on practical performance, operational sustainability, and long-term value, not just feature checklists.
Broader B2B Software Selection Methodology
We evaluate B2B software using a consistent, objective framework that focuses on how well a product solves meaningful business problems at a justified cost. This includes assessing overall performance, scalability, stability, and user experience quality. We examine real-world feedback from practitioners to understand how the software behaves outside of controlled demos.
We also review vendor transparency, roadmap clarity, support responsiveness, and the pace at which meaningful improvements are released. This approach ensures each recommendation is grounded in practical value, long-term viability, and operational impact—not marketing claims.
Check out our detailed B2B software methodology page to learn more.
Why Trust Us?
Our work is produced by a team of IT and business software professionals with extensive hands-on experience evaluating, deploying, and managing enterprise technology. We analyze software independently, using evidence-based methods and industry best practices to ensure our assessments remain unbiased and technically sound.
Our goal is to provide you with clear, reliable insights that help reduce risk, shorten evaluation cycles, and support confident decision-making when selecting complex business technology.
Free network monitoring tools FAQs
Is PRTG Network Monitor Free?
Usually, you would have to pay for PRTG but there are two ways to get it for free. The first of these is the Free plan, which lets you use up to 100 sensors without having to pay. The second option is to take the PRTG 30-day free trial. This gives you access to all the sensors in the PRTG package. If you decide not to pay at the end of the trial period, the software keeps working, but as the Free version with only 100 sensors.
Is Site24x7 Network Monitor free?
Site24x7 is a paid, cloud-based monitoring service, but you can use it for free in two ways. The vendor offers a fully featured 30-day free trial of its monitoring platform, and when that ends, your account can continue on a Free Plan that provides basic uptime monitoring for a limited number of websites/servers with email alerts and no time limit.
Is ManageEngine OpManager free?
ManageEngine OpManager is a commercial network monitoring tool, but there is a Free Edition. The current free edition is aimed at small networks and lets you monitor up to three network devices with unlimited interfaces for free forever, and you can also download a 30-day free trial of the paid editions if you want to test the full feature set before buying.

