Have you noticed your database running slower than usual? Then you might need a touch of performance tuning. Performance tuning in Oracle databases eliminates bottlenecks that make applications unresponsive and increases the load your database can handle.
What is Oracle Performance Tuning?
Oracle performance tuning is an essential practice for database administrators (DBAs) and developers aiming to optimize the performance of Oracle databases. As the backbone of many enterprise applications, Oracle databases handle vast amounts of data and complex transactions, making performance a critical factor in ensuring system efficiency, reliability, and scalability. Poor performance can lead to slow query response times, resource contention, and system outages, ultimately affecting business operations.
This guide serves as an introduction to Oracle performance tuning, providing practical insights into key areas of optimization, including SQL query tuning, memory management, disk I/O optimization, and proper indexing strategies. It will cover the most common performance bottlenecks and offer proven techniques for identifying, diagnosing, and resolving issues that may hinder database performance.
Effective performance tuning requires a combination of deep technical knowledge, an understanding of the specific workload requirements, and a disciplined approach to continuous monitoring. Through this guide, you’ll learn how to assess your Oracle database’s current state, make targeted improvements, and apply best practices for maintaining peak performance over time.
This guide will equip you with the essential tools and strategies to optimize your Oracle database, ensuring it operates efficiently and supports your mission-critical applications with optimal speed and reliability.
Monitoring Performance in Oracle Databases: Response Time and Throughput
When performance tuning an Oracle database there are two metrics that are useful to measure:
- Response time – How long the database takes to complete a request.
- System throughput – The number of processes completed in a period of time.
High response time means that an application is providing a slow user experience. On the other hand, low system throughput means that the database only has the resources to manage a small number of tasks in a short time period. An administrator has to be able to know how they are trying to improve performance before tuning.
How you optimize an Oracle database comes down to your goals and the type of applications you are using. Many goals like having a fast response time or a high throughput are contradictory.
Tuning for fast response times may speed up individual queries made by users but sacrifice other tasks in the workload. In contrast, achieving a high throughput would aim to optimize the performance of the entire workload to support a larger output of transactions per second (but not necessarily speed up individual queries).
The type of application you’re using makes all the difference. If you’re using an online transaction process (OLTP) application then you would use throughput to measure performance. This is because of the high volume of transactions the application needs to manage.
However, if you were using a decision support system (DSS) with users running queries on everything from a handful of records to thousands of records, then you would measure performance by response time (unless you were supporting lots of users running concurrent queries)!
The Two Types of Tuning: Proactive Monitoring and Bottleneck Elimination
Now that you know what performance tuning is, it’s important to look at the two main models of tuning:
- Proactive Monitoring
- Bottleneck Elimination
Database administrators use these two models to manage performance issues and keep applications functioning at a high level.
Proactive Monitoring
Proactive monitoring is the process of monitoring a database to discover and address performance issues early rather than simply reacting when there is a problem. With proactive monitoring, administrators will periodically review databases to identify the signs of performance degradation.
The idea behind proactive monitoring is to catch issues and inefficiencies before they develop into greater problems further down the line. Some common issues database administrators look out for include:
- Database wait events – A high number of events can negatively affect database performance. Finding obstructive sessions and killing them can prevent performance degradation.
- Load average – Monitoring the load average of a server will tell you if server resources are functioning as normal. A high load average can result in slow database performance.
- Database sessions – Monitoring the number of active sessions can stop you from reaching the maximum (which will prevent you from being able to open new sessions).
However, monitoring proactively does carry some risk. Any changes an administrator makes can result in a decrease in performance for the database. Administrators can mitigate the risks by being cautious before making new changes.
Bottleneck Elimination
Bottlenecks are one of the most common causes of poor performance. Bottlenecks block requests from reaching the destination and increase the response time of applications. Bottlenecks can be caused by a range of factors from badly coded SQL statements and high resource usage.
Bottleneck elimination is more of a reactive process than proactive monitoring. An administrator identifies a bottleneck and then finds a way to fix it. Fixing a bottleneck is a complex process and depends on what the root cause is (and whether it is internal or external). Recoding SQL statements is one solution for fixing internal bottlenecks, which should be addressed first.
Once internal bottlenecks have been resolved the administrator can start to look at external factors like CPU and storage performance that could be causing the problem. An administrator can choose between making changes to the application (or how it is used), Oracle, or the hardware configuration of the host.
How to Performance Tune
Performance tuning an Oracle database is a very complex subject because there are so many different factors that can affect database performance. To keep things simple, we’re going to look at some basic ways you can optimize performance.
1. Identify High-Cost Queries
The first step to tuning SQL code is to identify high-cost queries that consume excessive resources. Rather than optimizing every line of code it is more efficient to focus on the most widely-used SQL statements and have the largest database / I/O footprint.
One easy way to identify high-cost queries is to use Oracle database monitoring tools (we look at some of these platforms in more detail further below). One useful tool is Oracle SQL Analyze, which can identify resource-intensive SQL statements. Tuning these statements will give you the greatest return on your time investment.
2. Minimize the workload (Use Indexes!)
You can make the same query in many different ways so it is advantageous to write code that minimizes the workload as much as possible. If you only need a snapshot of data from a table it makes no sense processing thousands of rows you don’t need (all you’re doing is wasting system resources!) A full table scan takes up more database resources and I/O.
To eliminate the stress of sustaining a large workload you can use indexes to access small sets of rows rather than processing the entire database at once. Use indexes in those scenarios where a column is regularly queried.
3. Use Stateful Connections with Applications
Sometimes the cause of poor performance doesn’t come from code but because the connection keeps dropping between the application and the database. If your application isn’t configured correctly then it could form a connect to the database to access a table and then drop the connection once it has the information it needs.
Dropping the connection after accessing the table is terrible for performance. Instead, try to keep a stateful connection so that the application stays connected to the database at all times. Maintaining the connection will stop system resources from being wasted each time the application interacts with the database.
4. Collect and Store Optimizer Statistics
Optimizer statistics are data that describe a database and its objects. These statistics are used by the database to choose the best execution plan for SQL statements. Regularly collecting and storing optimizer statistics on database objects is essential for maintaining efficiency.
Collecting optimizer statistics makes sure that the database has accurate information on table contents. If the data is inaccurate then the database can choose a poor execution plan, which will affect the end-user experience. Oracle databases can automatically collect optimizer statistics or you can do so manually with the DBMS_STATS package.
Tools for Monitoring Oracle DB Query Performance
Using a software agent to monitor SQL query performance is the most effective way to manage query performance. Database performance monitoring tools can help to identify poorly performing SQL code and enable you to pinpoint the root cause of performance issues. The user can view query performance on a dashboard so they don’t need to search for information manually.
SolarWinds Database Performance Analyzer (FREE TRIAL)
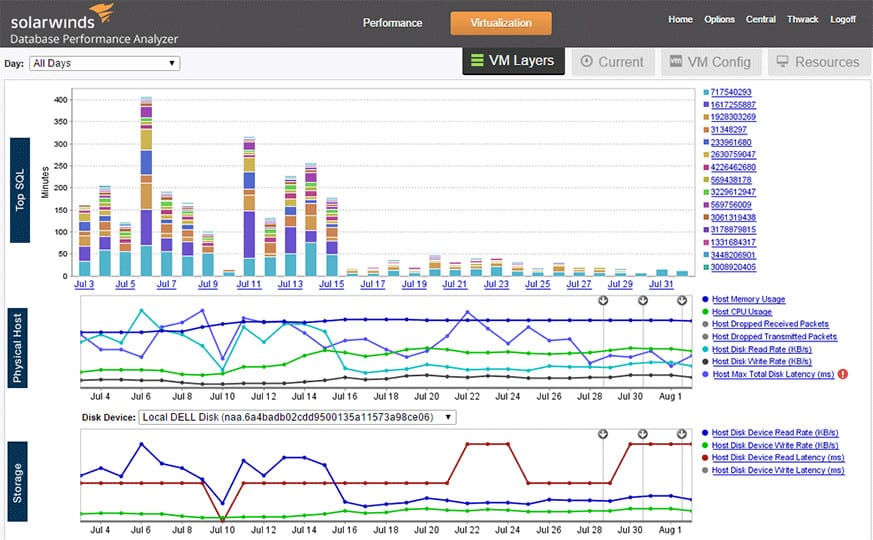
SolarWinds Database Performance Analyzer is a tool that can monitor the performance of SQL queries in real-time. You can view a table of the Top SQL Statements in your database to see the highest impact SQL statements. Viewing the top statements allows you to focus your remediation efforts on those statements that have the greatest impact on performance.
Why do we recommend it?
The SolarWinds Database Performance Analyzer provides cloud-based tracking of activities and issues on Oracle databases on your own servers and on cloud platforms. The system uses AI to predict when performance issues are gathering and issue warnings for action before problems become noticeable to users.
Who is it recommended for?
This SaaS package is able to manage and monitor a list of DBMS’s, not just Oracle. It can also watch over database instances from SQL Server, MySQL, MariaDB, PostgreSQL, and MongoDB as well as other relational and NoSQL systems. As it only monitors databases and their hosts, the tool is aimed at large businesses.
Pros:
- Highly intuitive DB management system tailored for medium to large size database implementations
- Monitors in real-time, offering a number of alert and notification options that can integrate into popular helpdesk solutions
- Threshold monitoring helps keep teams proactive, and fix issues before they impact performance
- Dashboards are highly customizable and can be tailored to individuals or teams
- Built-in query analysis helps DBAs build more efficient queries
- Leverages machine learning to identify performance bottlenecks
Cons:
- Would prefer a longer trial period
There is also a blocking analysis feature, which allows you to view the blocking hierarchy of the database and to view the total wait caused. Being able to see those queries that are obscuring the routes of other queries tells you where to make changes to improve performance. You can download a free trial.
dbForge Studio for Oracle (Oracle SQL Profiler)
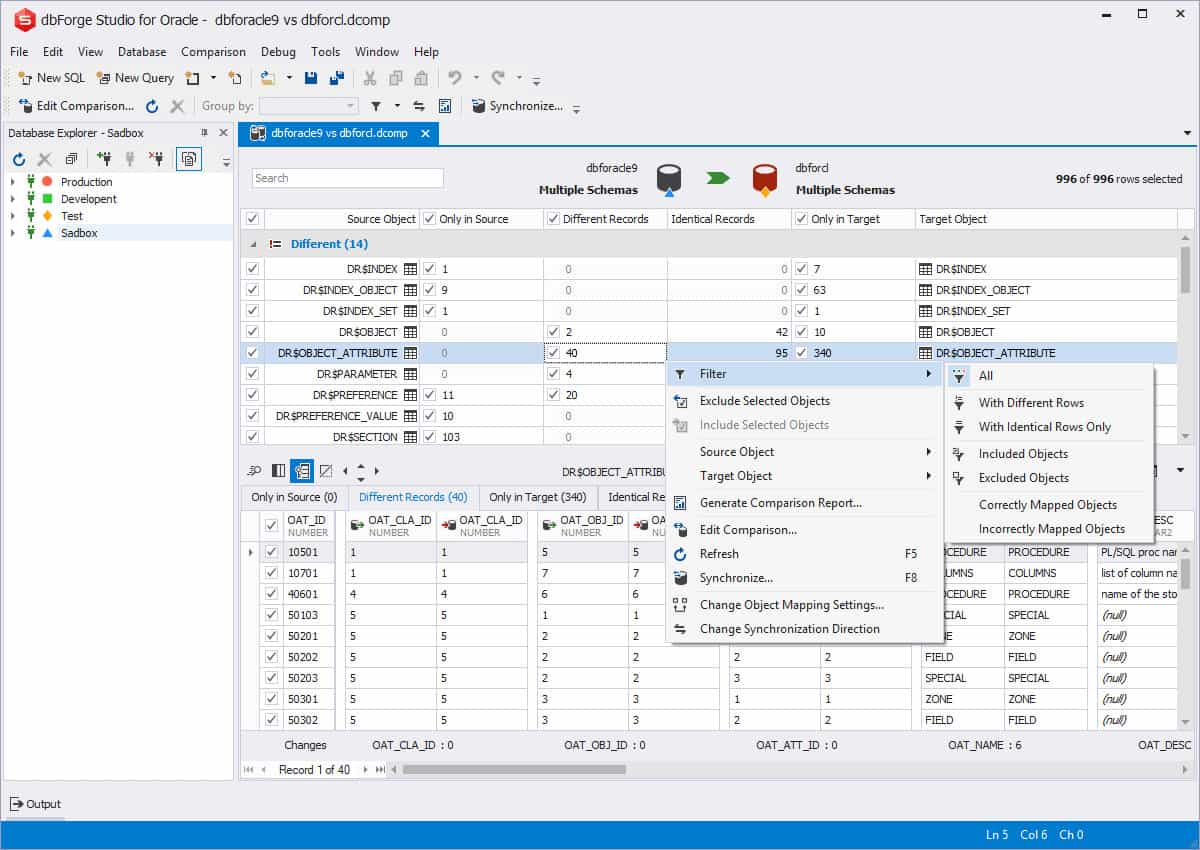
dbForge Studio for Oracle is an integrated development environment (IDE) that comes with Oracle SQL Profiler. With the profiler, you can identify queries with the highest duration. You can also view query execution plans and sessions statistics for additional information. Any changes you make will be saved so you can revert to earlier versions if you make a mistake.
Why do we recommend it?
dbForge Studio for Oracle is an on-device package that presents a view of database objects and allows queries to be tested and supports the development of code to run on your Oracle instances. This system can also be used to test database structures rather than for live monitoring.
In the Session Statistics tab, you can compare the results of new queries against older versions. Differences are highlighted in red and green so you can easily tell the performance impact. Session stats you can monitor include, CPU used by this session and sorts (rows). The Session Statistics tab allows you to make sure that your changes are actually improving performance!
Who is it recommended for?
This tool runs on Windows, macOS, and Linux. It isn’t a networked package but it can access databases across a network. This gives the tool limited usage within a business because you have to install the software on each user’s workstation. The system is useful for DBAs and developers. It doesn’t provide database monitoring.
Pros:
- Offers additional features and functionality beyond Management Studio without unnecessary tools and options
- Excellent overview into the health of multiple SQL server databases
- Can rewrite queries and profile data from directly inside the tool
Cons:
- Only runs on Windows
- Requires Microsoft SQL Server Management Studio
Tune with a Goal in Mind!
Having clear expectations with a specific goal in mind is critical for maintaining your database and tuning the system. Performance tuning is easier when you know what you’re trying to achieve.
For example, if you want to minimize the response time of an application so that it completes queries in 1-3 seconds then you can take action to tune for that scenario. That means diagnosing bottlenecks and performance issues that slow response time down.
Being able to refer back to goals will also help when you’re using a database analyzer. You’ll be able to monitor disk, CPU, and network usage to identify how performance is affected. The better you understand your goals, the better you know how to tune your resources.
Oracle performance tuning FAQs
How can I improve my Oracle query performance?
Indexing improves data retrieval speed. However, don’t over-index because these indexes could conflict and actually slow down results being returned. Partitioning tables improves data access speed because it reduces the number of records that need to be scanned in order to return the results for a query. Partitioning takes all indexes currently on the table and duplicates them automatically so that they are automatically applied to each partition.
What is SQL performance tuning?
SQL performance tuning is the process of ordering joins in an SQL query so that they extract records at maximum speed. There are a number of methods that can be used to improve SQL queries, such as removing outer joins and ordering lines in the WHERE clause so that as many records as possible are filtered out from the first table accessed by the query, thus reducing the amount of sorting that needs to be undertaken in the other tables accessed by the query.
What is Oracle bottleneck?
A bottleneck is a point in the process of access to or response from a database that has limited capacity and therefore slows disown access to results because only a limited number of queries can be served. This is different from resource locks, which occur when one process holds a resource and will not release it until another resource is available.
