Prometheus is a free, open-source system monitoring service explicitly developed to check on the statuses of IT assets. It’s great to find free IT services because that creates more space in the budget for other expenses. However, a free tool isn’t worth setting up if it doesn’t work properly. So, we look into whether this system is worth bothering with.
If this free tool is any good, why would businesses pay for an IT monitoring package? Are they wasting their money? We have selected Datadog as a representative of the kind of service available to those prepared to pay.
So, we will compare Prometheus to Datadog. As Datadog is one of the leading IT monitoring and management system providers, this sets a very high bar for the free package.
Prometheus highlights
Prometheus was developed by SoundCloud, a Swedish music streaming service based in Berlin, Germany. The company created the tool for its use in-house, and the project got started in 2012. The system evolved, and its refinement took several years.
Key Features:
- Open-Source and Free: A completely open-source monitoring solution that is free to use, attracting budget-conscious organizations.
- Flexible Data Collection: Utilizes a wide range of exporters for data collection across various systems, applications, and cloud services.
- Grafana Integration: Offers integration with Grafana for advanced data visualization and dashboarding capabilities.
- Cloud Native Foundation: Managed by the reputable Cloud Native Computing Foundation, ensuring continuous development and support.
The Prometheus development project was open source from the beginning. The development process management was handed over to the Cloud Native Foundation – the people who also manage Kubernetes. This background is auspicious. The system was designed by an innovative and successful business and is now managed by a very well-organized team.
The Cloud Native Computing Foundation continued to develop Prometheus, taking it through a series of versions. However, the system was never made into an entirely contained package. Instead, the Prometheus core processing module relies on third-party tools and extensions to gather data on the monitored system and upload them to the Prometheus server. A second Prometheus module, Alert Manager, identifies problems and creates notifications. Finally, the front end of the system is provided by Grafana, a third-party open-source system that was forked from Kibana.
Although it is an efficient strategy to exploit tools developed by others, this approach makes installing and running the Prometheus a little harder than customers’ experiences of commercially-produced tools, such as Datadog. One benefit of the Prometheus approach comes from flexibility. For example, if you can find a data collector that can feed information to Prometheus in the right format, you can get that system monitored.
Key information:
- Prometheus takes any time-series more, however, on its customers’ sites and complicated data stream as input
- Prometheus allows the creation of thresholds that indicate problems and raise alerts
- Prometheus can use other third-party services for a frontend, such as Grafana or Kibana
- Prometheus is under the management of the highly-respected Cloud Native Computing Foundation
- Companies that use Prometheus include Soundcloud, DigitalOcean, Ericsson, and Outbrain
Pros:
- Cost-Efficient: Completely free, offering a robust monitoring solution without any financial commitment.
- Extensive Exporter Ecosystem: Supports a vast array of exporters for comprehensive monitoring across different technologies.
- Customizable Dashboards: With Grafana integration, it allows for highly customizable visualizations to suit diverse monitoring needs.
- Strong Community Support: Benefits from a vibrant open-source community, providing extensive resources and support.
Cons:
- Complex Setup: Installation and configuration can be more challenging compared to commercial tools, requiring a higher technical skill level.
- Limited Out-of-the-Box Features: Relies on third-party tools for certain functionalities, which may require additional setup and integration effort.
Datadog highlights
Datadog is one of the world’s leading producers of system monitoring tools. The company started up in 2010 with some code that the funders acquired from Server Density. The company’s creators developed that code for a monitoring system and offered it as a hosted cloud-based service.
Those two founders are still in charge of the company, and over the years, they have completely rewritten the code from a Python system to one written in Go. The backend of the Datadog system relies on a mix of open source and proprietary tools. The open-source elements include PostgreSQL and Apache Cassandra. This shows that Prometheus is not alone in using open source elements to supply functionality to the central module.
Key Features:
- Comprehensive Monitoring: Offers an all-in-one monitoring solution covering networks, servers, applications, and cloud environments.
- Cloud-Based SaaS: A cloud-based service that provides a seamless and scalable monitoring experience without the need for extensive infrastructure management.
- Advanced Alerting: Includes unlimited alerts with threshold-based notifications, aiding in proactive monitoring and incident management.
- AI and Machine Learning: Features AI-driven insights and machine learning for anomaly detection and automated alert threshold setting.
Datadog is a successful, commercial product and the company has expanded rapidly. The platform offers monitoring systems for networks, servers, applications, serverless microservices, and websites. The company also provides management tools, including log management, a bug tracker, and an incident management package.
More recently, Datadog has branched out into security products. This division offers a SIEM service for intrusion detection and a vulnerability manager for cloud-based assets.
Although Datadog runs from the cloud, it can monitor systems running on the sites of its customers and also cloud-based assets. Each monitored system requires an agent installed on it and that uploads data to the central Datadog processor.
Datadog became a publicly listed company in 2019. The business is listed on the NASDAQ exchange in New York. The company now has more than 2,600 employees, and its turnover in 2021 was $602 million.
Key information:
- Datadog is one of the leading providers of system monitoring tools
- Datadog’s services are delivered from the cloud but can reach out to any system thanks to the installation of agents
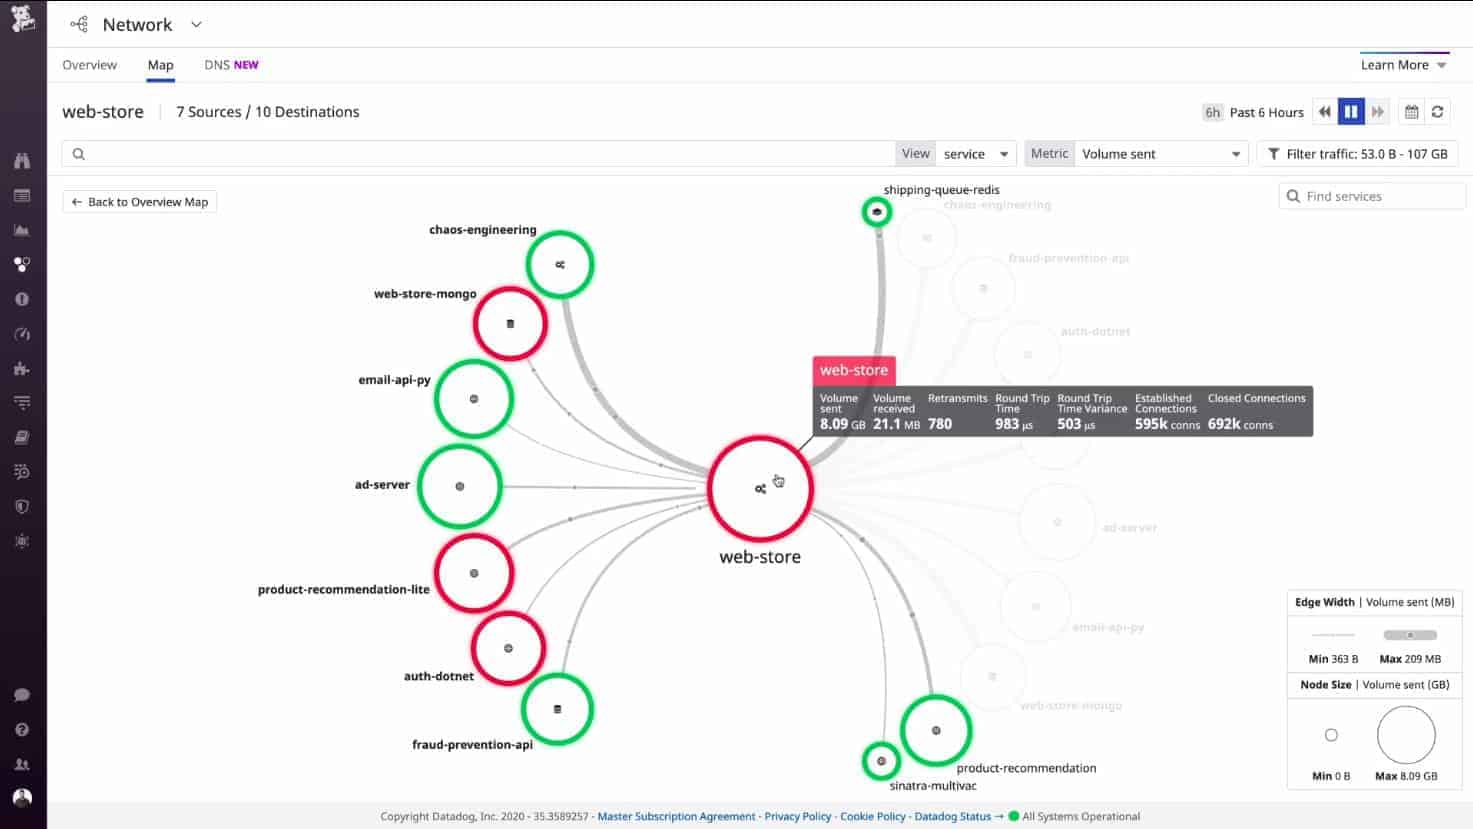
- Datadog can monitor networks, internet assets, servers, and applications
- Datadog also supplies security monitoring systems and some IT management tools
- Companies that use Datadog include Peloton, Samsung, Whole Foods, and 21st Century Fox
Pros:
- Ease of Use: Simplifies monitoring with an intuitive interface and straightforward setup, making it accessible to users of all skill levels.
- Scalability: Easily scales to accommodate growing monitoring needs, supporting everything from small projects to large enterprise environments.
- Integrated Security Monitoring: Provides additional security monitoring capabilities, enhancing the overall value of the monitoring suite.
- Extensive Integration Options: Offers a wide range of integrations, enabling seamless connectivity with other tools and platforms.
Cons:
- Cost: While offering a robust feature set, it comes with a price tag that might be prohibitive for smaller organizations or those with tight budgets.
- Potentially Overwhelming for Small Projects: The extensive functionality and breadth of monitoring capabilities may be more than what’s needed for simpler or smaller-scale monitoring needs.
Prometheus vs Datadog head-to-head
A critical difference between Prometheus and Datadog is that Prometheus is free to use. On that basis, you would probably expect that the Prometheus package is not quite as slick as Datadog, and you might be prepared to do a little work to get the benefit of a free system. However, there are several key differences between these two monitoring packages.
Deployment options
Datadog has only one deployment strategy, which is the SaaS model. The company runs its software on its servers and offers access to customers through the creation of accounts. The cloud delivery system of Datadog is increasingly popular among software providers. However, some system managers don’t like the loss of control that relies on services resident on remote servers brings.
Prometheus is available for installation on Linux and Windows. It is accessed as a download package from the Prometheus website or a GitHub repository. For those who would instead use cloud services, Metricfire offers a Hosted Prometheus package. This service, however, isn’t free to use as it includes storage space and some customizations that have already stitched together the elements of the Prometheus system and make getting started a much easier process.
System interface
As has already been explained, Prometheus is paired with a third-party front-end called Grafana.
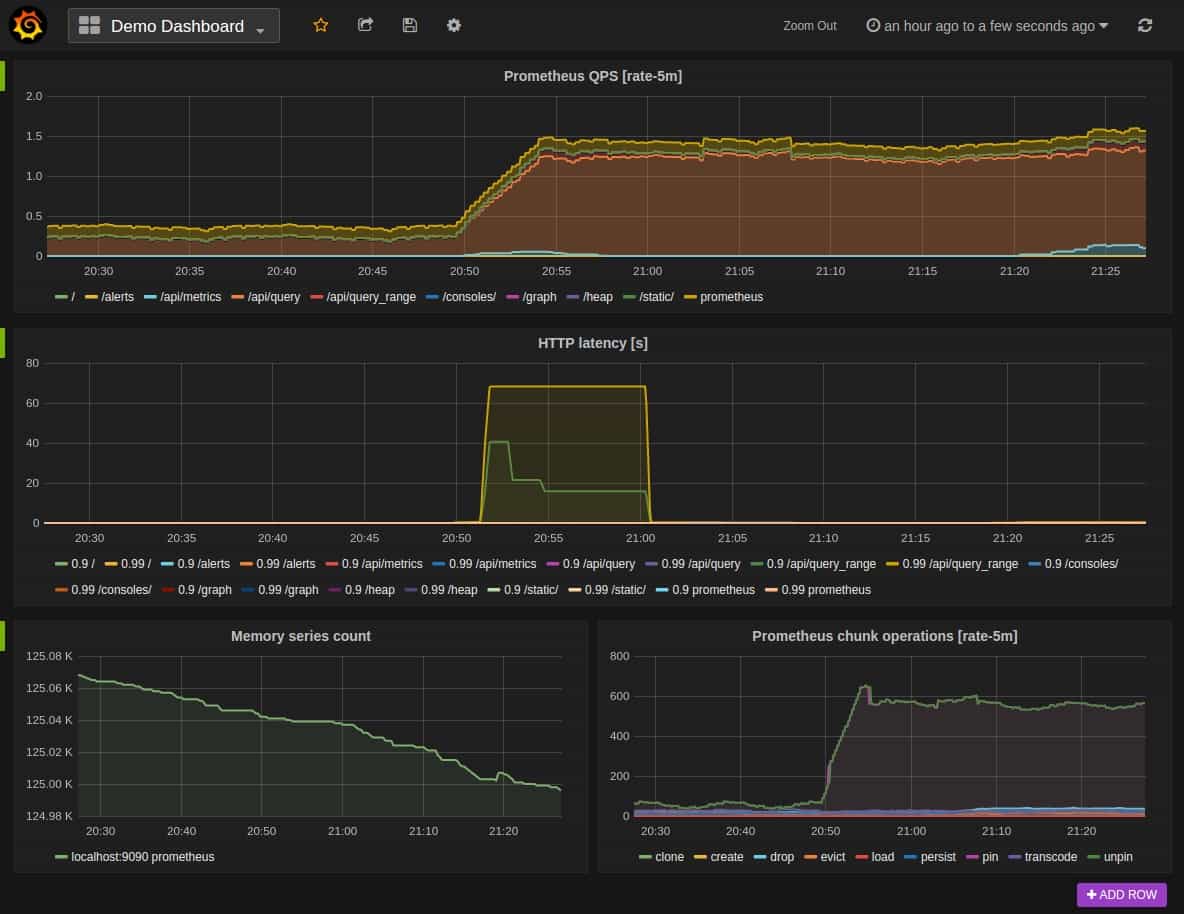
However, you don’t have to use that interface because it is possible to choose a different system or write your front-end.
Datadog has a very comprehensive interface that includes charts and lists of data. In addition, the company has organized its monitoring service into packages that track the performance of specific asset types, and the interface for each service matches those data sources.
Being a flexible service that can cater to different data sources, Prometheus doesn’t present pre-formatted screens. Therefore, it is harder to assess that interface because it is as good as you make it in your customizations.
Datadog offers flexibility over the interface choice because it is possible to get data feeds and send them to a different system through APIs. This strategy would make sense if you decided only to monitor part of your system with Datadog and use an additional service for the rest. If that other monitoring system will take data from external systems.
Data collection agents
The data feeds that supply each of these monitoring systems starts to show how the free and paid services differ. Prometheus can take inputs from a list of data collection systems. The data collector function is termed an “exporter” in the Prometheus terminology.
Possible exporters include SNMP, which requires an SNMP Manager to be installed on a server connected to the network – SNMP reports from network device agents need to be requested. There are many other exporters available for free. Some other examples are a Windows exporter and others from JIRA, Bitbucket, Confluence, and Jenkins. Apache, Nginx, and HAProxy also have exporters for Prometheus.
It is possible to monitor cloud platforms with Prometheus, thanks to exporters for AWS, Azure, Docker Cloud, and Cloudflare, among others. The Prometheus website includes a page that lists all available exporters with a link to the download for each.
The account dashboard of the service drives Datadog’s system. Users nominate systems in the monitoring package and get a download that launches a self-installing agent on the target.
The Datadog system is much easier to implement. However, it isn’t as rigid as a brief description might portray because this package can be extended through integrations. These are plugins that enable Datadog to interact with other applications, and this operates in a very similar way to the exporter model of Prometheus. The installation of integrations is managed from the Datadog dashboard, making these expansions very easy to implement.
The Prometheus method is not much more time-consuming than the console-driven Datadog installation process, thanks to the index of all available exporters at the service’s website.
Automated monitoring
Fault reporting has become a central service of system monitoring tools. The core of this concept lies with alerts. These enable technicians to ignore the system monitor because they know if anything wrong happens, they will be notified. This strategy removes the need to have someone watching the monitoring console system waiting for a problem to arise.
Alerting systems are included in both Prometheus and Datadog. Both systems offer this service as an integral feature – you don’t have to pay extra for alerts in Datadog. There is a free version of Datadog Infrastructure that doesn’t include alerts. The paid-for option of Hosted Prometheus from Metricfire rations the number of alerts that the user can set up according to an increasing scale of prices for its seven plans. In the original self-hosted Prometheus, you don’t pay anything for the alerting system.
Alerts operate by setting a threshold level on a metric that the monitor is tracking. This could be a performance indicator or a resource usage level. If that condition’s level passes the threshold, the alert gets triggered.
Prometheus vs Datadog: Price
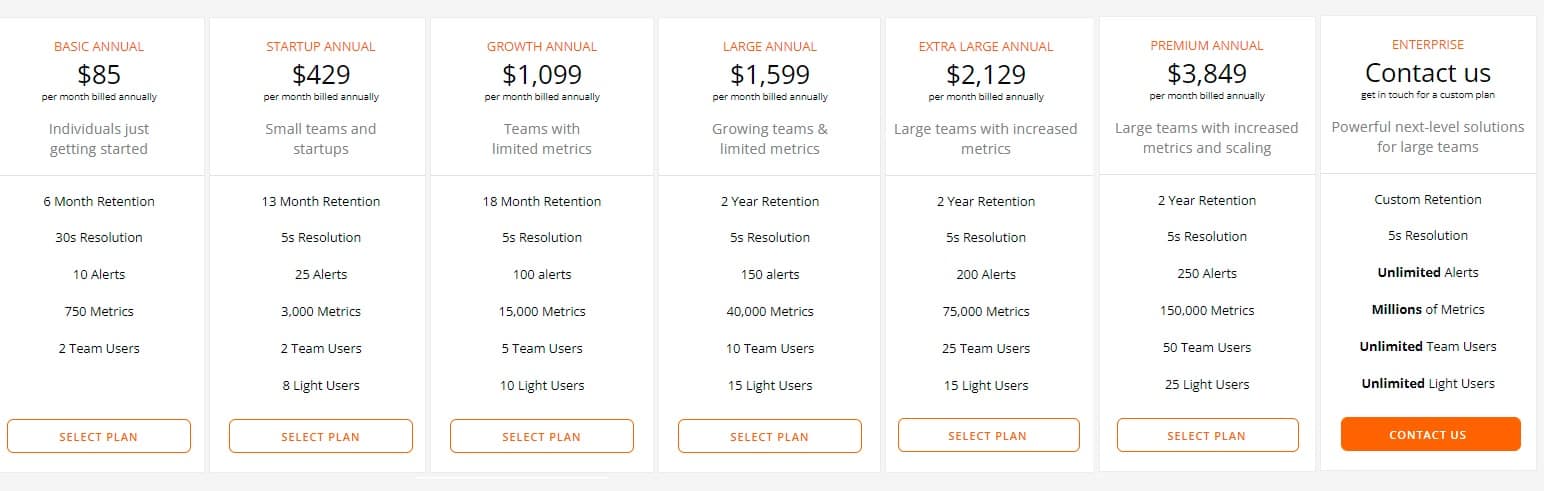
You don’t need to pay anything to use Prometheus. However, if you prefer the SaaS option offered by Metricfire, you will have to pay. Hosted Prometheus is offered in seven plans. Metricfire also provides an alternative system, which is Hosted Graphite, available in the same plan and price structure. There are seven plans for the Metricfire service, and the cheapest of these costs $85 per month when billed annually. That’s the Basic plan, which allows you to define ten alert conditions. The highest plan is a bespoke service with no fixed price. Premium’s next plan down costs £3,849 per month when billed annually and allows 250 alerts.
MetricFire offers a guided demo of both the Hosted Prometheus system and the Hosted Graphite service.
Datadog has 12 modules, which are priced separately, and each has a different pricing structure. Apart from the Free Infrastructure plan, all of these editions include unlimited alerts. For an example of the prices of Datadog, the Pro plan of the Infrastructure edition costs $15 per host per month when billed annually. On the other hand, the enterprise plan of Datadog Infrastructure includes an AI-based threshold setting for its alerts, which costs $23 per month per host when billed annually.
All Datadog plans are offered on a 14-day free trial.
Prometheus vs. Datadog: the verdict
Prometheus is an exciting prospect because it is a well-planned product. However, businesses that have very little time customizing their monitoring system might find this option too much work to get running. Datadog’s offering is a lot easier to understand. It is easy to work out precisely what you will be getting for any chosen package.
The flexibility of Prometheus will be of great interest to system administrators that like to immerse themselves in a technical challenge. However, persuading the boss to allocate chargeable hours to such a task could be difficult.
Datadog offers adaptability through its library of 500 integrations. This means that Datadog is a core system that can be extended to interact with other applications and services that the potential buyer might already have.
Busy budget-led companies will like the certainty of Datadog; Innovative startups might prefer the broader options afforded by Prometheus.
Prometheus Vs Datadog FAQs
What is the difference between Datadog and Grafana?
Datadog is a SaaS package that is charged for by subscription. It is a platform that provides a series of system monitoring tools and security systems. Grafa is a data visualization tool and is free to use. A Datadog user gets monitoring systems out of the box, whereas Grafana users have to build their systems from scratch and then feed data to data representation widgets in the Grafans system.
Does Datadog use Python?
Datadog was originally written in Python. However, all of the system was rewritten in Go (Golang). The backend includes instances of PostgreSQL and Apache Cassandra.
What do you use Prometheus for?
Prometheus is a component in a self-assembly data management bundle. The system doesn’t have its own front end but relies on Grafana or Kibana. It also doesn’t have its own data collectors – these have to be organized with third-party tools. So, Prometheus is more of a data collation hub. The package has a mechanism that can generate alerts when arriving statistics exceed a given value.
