What is Nmap?
Nmap (Network Mapper) is an open-source network scanning and security auditing tool widely used for network discovery and vulnerability scanning. Initially developed by Gordon Lyon (known by the pseudonym Fyodor), it has become one of the most trusted tools in cybersecurity and network administration.
Nmap primarily works by sending network packets to a target system and analyzing the responses. This allows it to map out and identify active devices on a network, the services they are running, and potential security risks associated with those services. It operates on a wide range of operating systems, including Linux, Windows, and macOS.
One of the primary uses of Nmap is network discovery, which involves detecting devices and their IP addresses on a local area network (LAN) or across larger networks such as the internet. This feature is crucial for network administrators to monitor the health of a network and identify new devices that may have been added without authorization. Nmap is also used for port scanning, which involves detecting open ports on a target device. Open ports can serve as entry points for malicious attackers, so identifying them is vital for network security.
In addition to these functionalities, Nmap supports a variety of scanning techniques that range from simple ping sweeps to more advanced scans, such as SYN scans (half-open scans) and OS fingerprinting. These techniques allow users to gather detailed information about a network, including the types of operating systems in use and the version of software running on the devices.
Nmap also includes a scripting engine (NSE) that enables the automation of network scanning tasks and the discovery of vulnerabilities. This versatility makes Nmap a valuable tool for both security professionals conducting penetration testing and network administrators managing large infrastructures.
This command line tool Nmap is a powerful and versatile tool for network analysis, security auditing, and vulnerability assessment, making it an essential asset in the field of cybersecurity or network management.
Network Analysis and Packet Sniffing with Nmap
Network analyzers like Nmap are essential to network security for several reasons. They can identify attackers and test for vulnerabilities within a network. When it comes to cybersecurity, the more you know about your packet traffic, the better prepared you are for an attack. Actively scanning your network is the only way to ensure that you stay prepared for potential attacks.
As a network analyzer or packet sniffer, Nmap is extremely versatile. For example, it allows the user to scan any IP active on their network. If you spot an IP you haven’t seen before, you can run an IP scan to identify whether it is a legitimate service or an outside attack.
Nmap is the go-to network analyzer for many administrators because it offers a wide range of functions for free.
Nmap Use Cases
For example, you can use Nmap to:
- Identify live hosts on your network
- Identify open ports on your network
- Identify the operating system of services on your network
- Address vulnerabilities in your network infrastructure
How to Install Nmap
See also: Nmap Cheat Sheet
Before we get to how to use NMap, we’re going to look at how to install it. Windows, Linux and MacOS users can download Nmap here.
Install Nmap on Windows
Use the Windows self-installer (referred to as nmap-<version>setup.exe) and then follow the onscreen instructions.
Install Nmap on Linux
On Linux, things are a little trickier as you can choose between a source code install or a number of binary packages. Installing Nmap on Linux allows you to create your own commands and run custom scripts. To test whether you have nmap installed for Ubuntu, run the nmap --version command. If you receive a message stating that nmap isn’t currently installed, type sudo apt-get install nmap into the command prompt and click enter.
Install Nmap on Mac
On Mac, nmap offers a dedicated installer. To install on Mac, double-click the nmap-<version>.dmg file and open a file called nmap-<version>mpkg. Opening this will start the installation process. If you’re using OS X 10.8 or later, you might be blocked by your security preferences because nmap is considered an ‘unidentified developer’. To get around this, simply right-click on the .mpkg file and select Open.
How to Run a Ping Scan
One of the basics of network administration is taking the time to identify active hosts on your network system. On Nmap, this is achieved through the use of a ping scan. A ping scan (also referred to as a discover IP’s in a subnet command) allows the user to identify whether IP addresses are online. It can also be used as a method of host discovery. ARP ping scans are one of the best ways to detect hosts within LAN networks.
To run an ARP ping scan, type the following command into the command line:
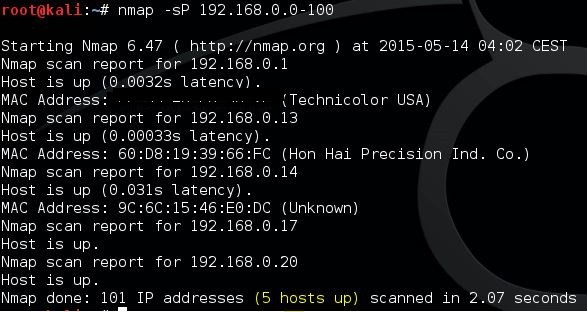
# nmap -sp 192.100.1.1/24This will return a list of hosts that responded to your ping requests along with a total number of IP addresses at the end. An example is shown below:
It is important to note that this search doesn’t send any packets to the listed hosts. However, Nmap does run a reverse-DNS resolution on the listed hosts to identify their names.
Port Scanning Techniques
When it comes to port scanning, you can use a variety of different techniques on Nmap. These are the main ones:
sS TCP SYN scansT TCP connect scansU UDP scanssY SCTP INIT scansN TCP NULL
Newer users will attempt to solve most problems with SYN scans, but as your knowledge develops you’ll be able to incorporate some of these other techniques as well. It is important to note that you can only use one port scanning method at a time (although you can combine an SCTP and TCP scan together).
TCP SYN Scan
sS TCP SYN ScanThe TCP SYN Scan is one of the quickest port scanning techniques at your disposal on Nmap. You can scan thousands of ports per second on any network that isn’t protected by a firewall.
It is also a good network scanning technique in terms of privacy because it doesn’t complete TCP connections that draw attention to your activity. It works by sending a SYN packet and then waiting for a response. An acknowledgment indicates an open port whereas no response denotes a filtered port. An RST or reset identifies non-listening ports.
TCP Connect Scan
sT TCP Connect ScanA TCP Connect Scan is the main alternative TCP scan when the user cannot run a SYN scan. Under TCP connect scan, the user issues a connect system call to establish a connection with the network. Instead of reading through packet responses, Nmap uses this call to pull information about each connection attempt. One of the biggest disadvantages of a TCP connect scan is that it takes longer to target open ports than a SYN scan.
UDP Scan
sU UDP ScanIf you want to run port scanning on a UDP service, then UDP scans are your best course of action. UDP can be used to scan ports such as DNS, SNMP and DHCP on your network. These are particularly important because they are an area that attackers commonly exploit. When running a UDP scan, you can also run a SYN scan simultaneously. When you run a UDP scan, you’re sending a UDP packet to each targeted port. In most cases, you’re sending an empty packet (besides ports like 53 and 161). If you don’t receive a response after the packets are transmitted, then the port is classified as open.
SCTP INIT port scan
sY SCTP INIT ScanThe SCTP INIT port scan covers SS7 and SIGTRAN services and offers a combination of both TCP and UDP protocols. Like the Syn scan, the SCTP INIT Scan is incredibly fast, able to scan thousands of ports every second. It is also a good choice if you’re looking to maintain privacy because it doesn’t complete the SCTP process. This scan works by sending an INIT chunk and waiting for a response from the target. A response with another INIT-ACK chunk identifies an open port, whereas an ABORT chunk indicates a non-listening port. The port will be marked as filter if no response is received after multiple retransmissions.
TCP NULL Scan
sN TCP NULL ScanA TCP NULL scan is one of the more crafty scanning techniques at your disposal. This works by exploiting a loophole in the TCP RFC that denotes open and closed ports. Essentially any packet that doesn’t contain SYN, RST or ACK bits will prompt a response with a returned RST if the port is closed and no response if the port is open. The biggest advantage of a TCP NULL scan is that you can navigate your way around router filters and firewalls. Even though these are a good choice for stealth, however, they can still be detected by intrusion detection systems (IDS).
Host Scanning
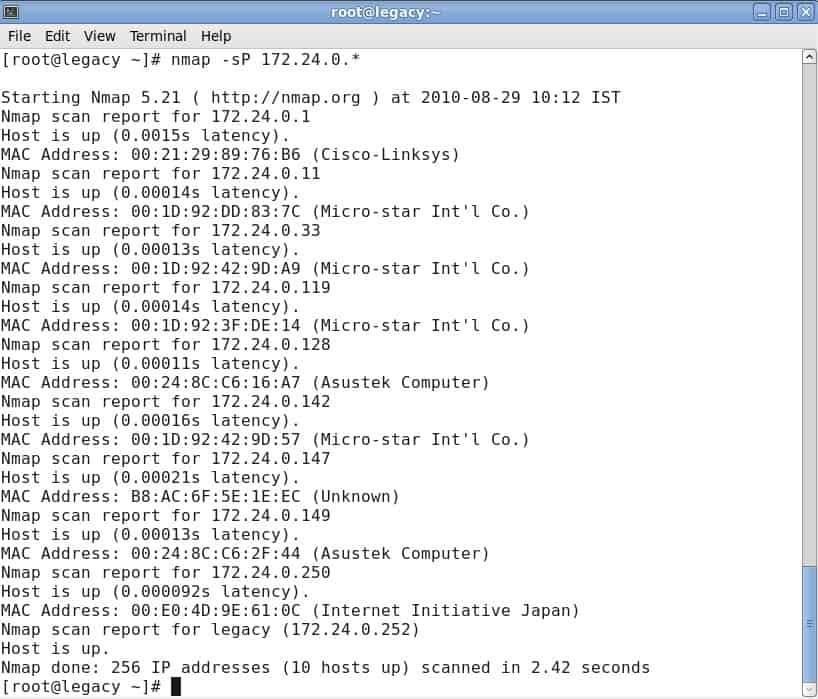
If you want to identify active hosts on a network, then the host scan is the best way to do this. A host scan is used to send ARP request packets to all systems within a network. It will send an ARP request to a specific IP within an IP range and then the active host will respond with an ARP packet sending its MAC address with a ‘host is up’ message. You will receive this message from all active hosts. To run a host scan, enter:
nmap -sP <target IP range>This will raise a screen showing the following:
Identify Hostnames
One of the simplest and most useful commands you can use is the -sL command, which tells nmap to run a DNS query on your IP of choice. By using this method, you can find hostnames for an IP without sending a single packet to the host. For example, input the following command:
nmap -sL 192.100.0.0/24This returns a list of names relating to the IPs scanned, which can be incredibly useful for identifying what certain IP addresses are actually for (providing they have a related name!).
OS Scanning
Another one of Nmap’s useful functions is OS detection. To detect the operating system of a device, Nmap sends TCP and UDP packets to a port and analyzes its response. Nmap then runs various tests from TCP ISN sampling to IP ID sampling and compares it to its internal database of 2,600 operating systems. If it finds a match or fingerprint, it provides a summary consisting of the provider’s name, operating system, and version.
To detect the operating system of a host, enter the following command:
nmap -O 192.168.5.102It is important to note that you require one open and one closed port in order to use the –O command.
Version Detection
Version detection is the name given to a command that allows you to find out what software version a computer is running. What sets it apart from most other scans is that the port isn’t the focus of its search. Instead, it tries to detect what software a computer runs using the information given by an open port. You can use version detection by typing up the -sV command and selecting your IP of choice, for example:
#nmap -sV 192.168.1.1Increasing Verbosity
When running any scan through Nmap, you might require more information. Entering the verbose command -v will provide you with additional details on what Nmap is doing. Nine levels of verbosity are available on Nmap, from -4 to 4:
- Level -4 – Provides no output (e.g. you won’t see response packets)
- Level -3 – Similar to -4 but also provides you with error messages to show you if an Nmap command has failed
- Level -2 – Does the above but also has warnings and additional error messages
- Level -1 – Shows run-time information like version, start time, and statistics
- Level 0 – The default verbosity level that displays sent and received packets as well as other information
- Level 1 – Same as level 0 but also provides detail on protocol details, flags and timing.
- Level 2 – Shows more extensive information on sent and received packets
- Level 3 – Show the complete raw transfer of sent and received packet
- Level 4 – Same as level 3 with more information
Increasing the verbosity is great for finding ways to optimize your scans. You increase the amount of information that you have access to and provide yourself with more information to make targeted improvements to your network infrastructure.
Nmap Scripting Engine
If you want to get the most out of Nmap, then you’re going to need to use the Nmap Scripting Engine (NSE). The NSE allows users to write scripts in Lua so they can automate various networking tasks. A number of different script categories can be created with the NSE. These are:
- auth – scripts that work with or bypass authentication credentials on a target system (such as x11-access).
- broadcast – scripts typically used to discover hosts by broadcasting on the local network
- brute – scripts that use brute force to gain access to a remote server (for example http-brute)
- default – scripts set by default on Nmap based on speed, usefulness, verbosity, reliability, intrusiveness, and privacy
- discovery – scripts that search public registries, directory services, and SNMP-enabled devices
- dos – scripts which can cause denial of service. Can be used to test or attack services.
- exploit – scripts designed to exploit network vulnerabilities (for example http-shellshock
- external – scripts that send data to external databases such as whois-ip
- fuzzer – scripts that send randomized fields within packets
- intrusive – scripts that risk crashing the targeted system and being interpreted as malicious by other administrators
- malware – scripts used to test whether a system has been infected by malware
- safe – scripts that aren’t considered intrusive, designed to exploit loopholes, or crash services
- version – used under the version detection feature but cannot be selected explicitly
- vuln – scripts designed to check for vulnerabilities and report them to the user
The NSE can be quite complicated to get your head around at first, but after the initial learning curve, it becomes much easier to navigate.
For example, entering the command -sC will allow you to use the common scripts native to the platform. If you want to run your own scripts, you can use the –script option instead. It is important to remember that any scripts you run could damage your system, so double check everything before deciding to run scripts.
Alternatives to Nmap
Although regular users of Nmap swear by it, the tool does have its limitations. Newcomers to network administration have learned to expect a GUI interface from their favorite tools and better graphical representations of network performance issues. The en-map adaptation of Nmap (see below) goes a long way towards addressing these needs.
If you don’t want to use a command line utility, there are alternatives to Nmap that you could check out. SolarWinds, which is one of the world’s leading producers of network administration tools, even offers a port scanner. The analytical functions of Nmap are not so great and you may find yourself researching other tools to further explore your network’s statuses and performance.
Although Nmap is a command line tool, there are many competing system available now that have a graphical user interface, and we prefer these over the dated operations of Nmap.
Here is our list of the best alternatives to Nmap:
- Site24x7 Network Monitoring (FREE TRIAL) This section of a cloud platform of monitoring systems provides both device status checks and traffic analysis based on a network discovery routine. Start a 30-day free trial.
- Paessler PRTG (FREE TRIAL) A network monitoring package that includes SNMP for discovery and also creates a network inventory. The network maps of this tool are exceptional. Runs on Windows Server. Download a 30-day free trial.
- Zenmap Produced by the developers of Nmap. This is the official GUI version of the network discovery tool., Offers a respectable mapping service for free. Runs on Windows, Linux, macOS, and Unix.
- Datadog Network Device Monitoring This module from a SaaS platform includes device discovery and ongoing status checks with SNMP.
- Progress WhatsUp Gold This network performance monitor uses SNMP to discover all devices connected to a network, create a network inventory and topology map, and then perform continuous monitoring. Available for Windows Server.
The Best Alternatives to Nmap
Our methodology for selecting alternatives to Nmap
We reviewed the market for network discovery tools and analyzed the options based on the following criteria:
- An autodiscovery system that can compile an asset inventory
- Topology mapping
- A system that performed live monitoring of network devices
- The use of SNMP to extract status information from network devices
- Alerts for performance problems
- A free trial or a demo for a no-cost assessment opportunity
- Value for money from a service that offers cost savings through productivity gains
1. Site24x7 Network Monitoring (FREE TRIAL)
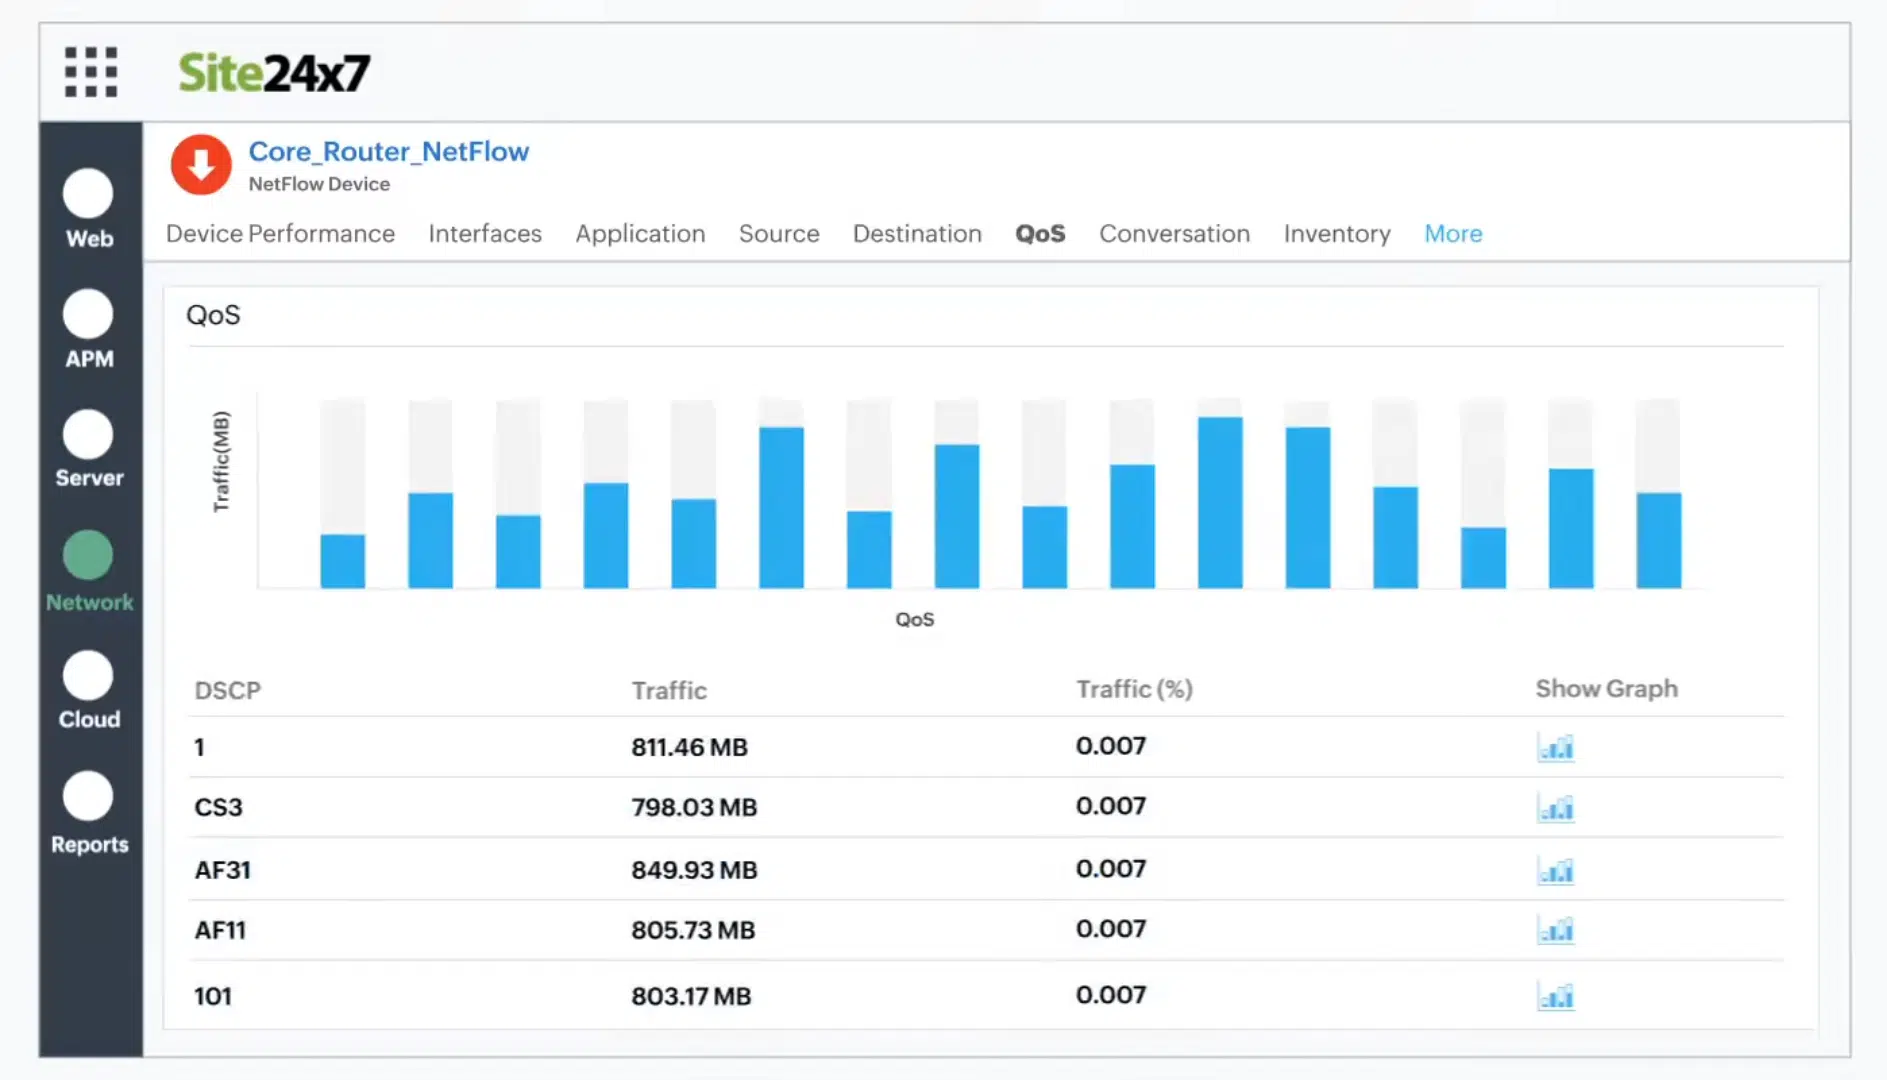
Site24x7 Network Monitoring provides both device monitoring and traffic analysis. This service will discover all of the devices on your network and create a network inventory and a topology map. The system is able to identify the activity on the device as a unit and per port.
Key Features:
- Device status monitoring
- Traffic analysis
- Autodiscovery
Why do we recommend it?
Site24x7 Network Monitoring is a cloud platform that provides a similar service to the Datdog Device Monitoring package. This package also includes a traffic monitor – with Datadog you need to pay for a separate module, called Network Performance Monitoring for that. This service includes autodiscovery, mapping, and network inventory creation.
This package uses SNMP to track the activities of switches, routers, and firewalls. It uses NetFlow and similar facilities to track network traffic patterns. This combination of services means that you have all aspects of network device monitoring in one package. As well as watching over devices, the network monitor will track the performance of VPNs, voice networks, load balancers, wireless access points, and office equipment, such as printers and UPSs.
Both the network inventory and the topology map are interactive. They let you click through to see the details of a device and its current activity. The dashboard also lets you set up performance expectation thresholds that will trigger alerts if crossed. You will also get an alert if an SNMP device agent sends a Trap warning about a device status problem.
The Site24x7 cloud platform also includes server and application monitoring services and you choose a package of services from a list of bundles. All of the plans include network monitoring.
Who is it recommended for?
The Site24x7 platform includes network monitoring bundled in with server and application monitoring. Some packages also include log management and you can also get synthetic monitoring and real user monitoring for websites. This is packaged in capacities suitable for small businesses and larger businesses pay for more capacity.
Pros:
- Network monitoring supplemented by server and application monitors
- Automatic topo9logy mapping
- Monitoring wireless systems as well as wired LANs
Cons:
- Plans have limited monitoring capacity and need to be expended by extra payments
This Site24x7 system is a cloud platform and it can monitor any network anywhere as long as you download a data gathering program onto the local network. You can get to know this monitoring package with a 30-day free trial.
2. Paessler PRTG Network Monitor (FREE TRIAL)
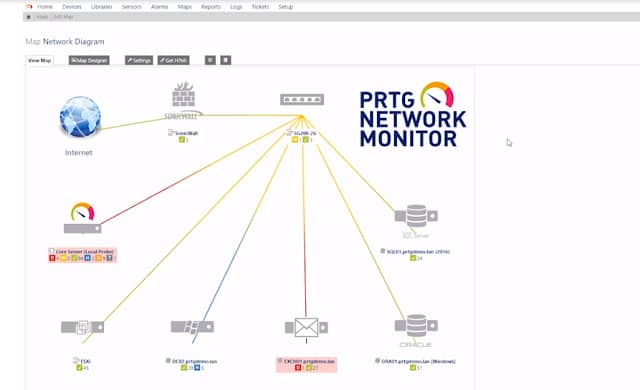
Paessler PRTG Network Monitor uses the Simple Network Management Protocol (SNMP) to locate all of the devices on your network and provide real-time monitoring capabilities. Once each piece of equipment has been discovered, it is logged in an inventory. The inventory forms the basis of the PRTG Network Map. You can reorganize the map manually if you like and you can also specify customized layouts. The maps aren’t limited to displaying the devices on one site. It can show all of the devices on a WAN and even plot all of the company’s sites on a real map of the world. Cloud services are also included in the network map.
Key Features:
- Network discovery
- Network inventory and topology map
- Live network monitoring
Why do we recommend it?
Paessler PRTG Network Monitor is a package of network, server, and software monitoring systems and it is based around a network discovery tool. This compiles a network inventory, which can provide as much detail n each device on the network as Nmap. you also get a network topology map.
The network discovery function of PRTG runs continually. So, if you add, move, or remove a device, that change will automatically be shown in the network map and the equipment inventory will also be updated.
Each device on the map is labeled with its IP address. Alternatively, you can choose to have devices identified by their MAC addresses or their hostnames. Each device icon in the map is a link through to a detail window, which gives information on that piece of equipment. You can change the display of the network map to limit it to devices of a particular type, or just show one section of the network.
Paessler PRTG is a unified infrastructure monitoring system. It will also keep track of your servers and the applications running on them. There are special modules for monitoring websites and the monitor is able to cover virtualizations and wifi networks as well.
Who is it recommended for?
Paessler PRTG has a charge rate based on the number of sensors in the package that you activate. The minimum order quantity is 500. If you only activate 100, you never have to pay for the system. So, this tool will appeal to every business, especially small enterprises.
Pros:
- A choice of on-premises or SaaS
- Constant network monitoring with updated inventory and map
- Alerts for network device problems
Cons:
- Limited free trial
Paessler PRTG is available as an online service with a local collector agent installed on your system. Alternatively, you can choose to install the software on the premises. The PRTG system runs on Windows computers, but it can communicate with devices running other operating systems. PRTG is available for download on a 30-day free trial.
3. Zenmap
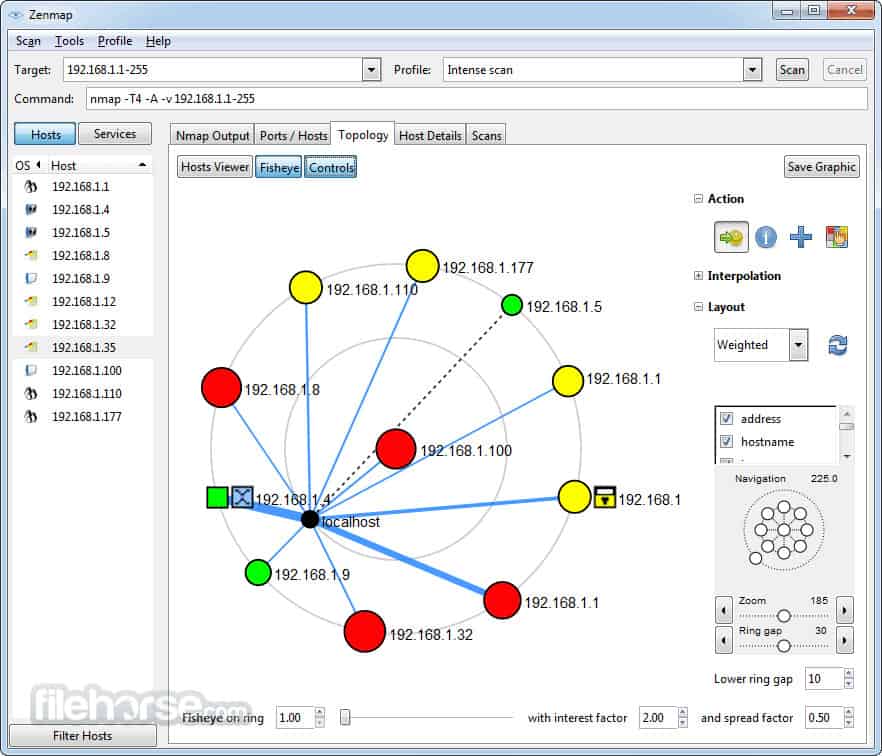
Zenmap is the official GUI version of Nmap and, like its CLI partner, it is proficient at network mapping and free to use. This system is a good option if you don’t want to spend any money on a network monitoring system. Although that category of network managers is probably limited to small business networks, this tool could easily monitor a large network.
Key Features:
- Installs with Nmap
- Nmap command generator
- Autodiscovery
- Network asset list
- Live network map
Why do we recommend it?
Zenmap is a good alternative to the Nmap system for those who don’t want to use a command line system. Zenmap is produced by the same people that create Nmap and, you install Nmap along with Zenmap, so when you use Zenmap with its network visualizations, you are actually using Nmap as well.
Zenmap shows the statuses of all of your devices on its network plan. This monitoring service uses traffic light color coding to display the health of switches and routers. The tool is very good for those who just want a quick check that everything is OK. However, it falls short of the extensive network monitoring tools that you can get from a paid tool.
Zenmap will delight techies who like to get their hands dirty and use a query language. However, busy network managers who don’t have time to construct scripts and investigations with be frustrated by the limitations of this tool.
This is a reliable workhorse, but a little dated. However, as a free tool, it is certainly worth the trouble to check out.
Who is it recommended for?
This is a free tool, so it will appeal to small businesses that are looking for a free network monitoring system. Nmap is used by hackers and pen testers because it can be launched in scripts. The Zenmap system doesn’t have that capability. However, you can switch between the two for network investigations.
Pros:
- Interfaces to Nmap
- Offers an interface for ad-hoc investigations
- Creates scripts in the Nmap query language
- Suitable for small businesses that don’t want to pay for network monitoring
- Packet capture utility
Cons:
- Dated and has a limited capability for network monitoring
The software for Zenmap runs on Windows, Linux, macOS, and Unix. Download it for free.
4. Datadog Network Device Monitoring
Datadog Network Device Monitoring is one of two network monitoring systems presented by the Datadog cloud platform. The other is the Network Performance Monitoring service, which focuses on measuring traffic.
Key Features:
- Device discovery
- Port mapping
- Constant health checks
Why do we recommend it?
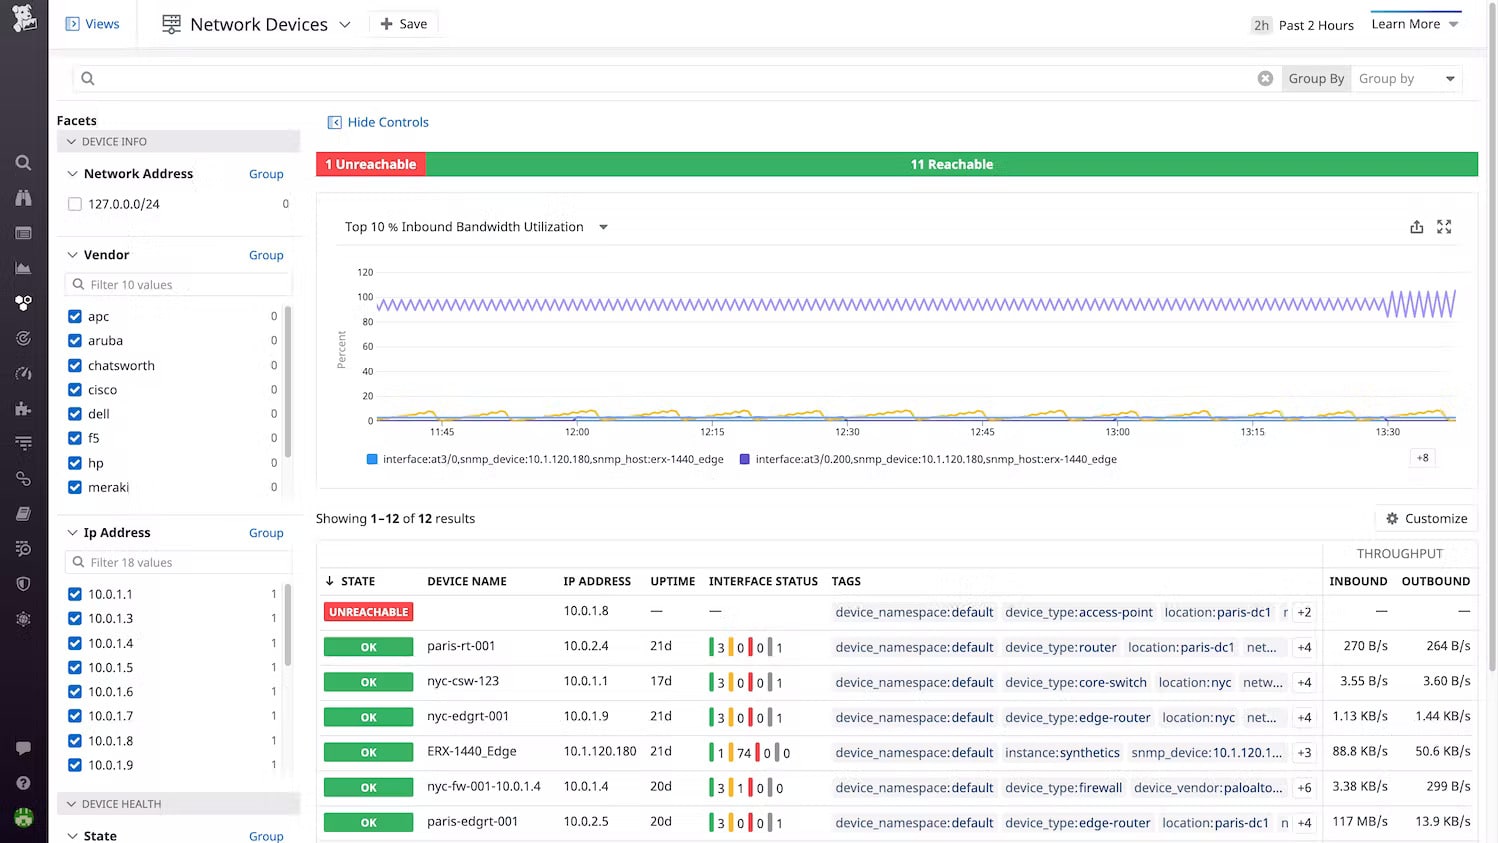
Datadog Network Device Monitoring is a cloud platform. It differs from Nmap in that it isn’t free to use. Also, it provides a network map – much in the form of the PRTG network map. This system creates a network inventory through an autodiscovery process. It details each interface on each device.
The monitoring tool searches a network for all of the switches and routers that connect it together and then scans each device to get its details, such as make and model. The tool will also list the ports and the devices that are connected to them.
As operations progress, the Network Device Monitor keeps checking on the network equipment through SNMP procedures. It requests status reports from device agents and then compiles these into live performance data in the Datadog console. Activity is shown in graphs and charts as well as tables.
The system provides alerts if a device agent reports a problem and it will also set performance expectation thresholds on all of the metrics that it gathers. You can customize these alerts and even rearrange the dashboard screens.
Who is it recommended for?
Although this system isn’t free, it is affordable. The subscription rate for the tool is levied per device. That is a good plan for a small business. The system automatically updates the inventory if a new device is discovered – which is a good security measure for identifying rogue devices.
Pros:
- Shows a live record of device performance
- Offers automated monitoring with alerts
- Provides a forecasting utility
Cons:
- Traffic analysis is a separate module
The Datadog system is a subscription service and the cloud-based monitor will install an agent on your network to gather data. You can examine this network monitor with a 14-day free trial.
5. Progress WhatsUp Gold

WhatsUp Gold is a real-time monitor with an autodiscovery function, which covers wired, wireless, and virtual environments. The software for this infrastructure monitoring tool installs on Windows Server 2008 R2, 2012, 2012 R2, and 2016. The first run of the utility will kick off the network discovery routines. These log all of the Layer 2 and Layer 3 devices (switches and routers) on your network and record them in a register. The discovery process also generates a network map. The logging system keeps running constantly so any changes in the network will be reflected in the map. Cloud-based services that your company uses also get included on the map and you can cover multiple sites to plot your WAN on one map.
Key Features:
- SNMP-based
- Autodiscovery
- Creates a network inventory
- Live network topology map
Why do we recommend it?
Progress WhatsUp Gold is an on-premises monitoring package that is centered on a network discovery service. This system includes an inventory and creation feature to track equipment statuses and it will also detail the interfaces on each device, much like Nmap. This system can be expanded by add-ons for other monitoring services.
The discovery process of WhatsUp Gold uses Ping and SNMP routines. The type of devices is also registered. This helps the monitor adjust processes accordingly for each type of equipment. A detailed popup attached to each icon in the map will show you details about that piece of equipment.
The statuses of the devices in the network system are monitored with SNMP. The map shows the health of each device with color: green for good, yellow for warning, and red for bad. So, you can see at a glance how all of those pieces of equipment are doing. Network link status is also highlighted with color: green for good, yellow for warning, and red for congested.
Who is it recommended for?
WhatsUp Gold is suitable for mid-sized businesses. The software runs on Windows Server and it sets itself up through its autodiscovery process. This would be ideal for small businesses. However, this is a paid system and they would be more likely to go for one of the free tools on the list.
Pros:
- An on-premises package for Windows Server
- Network inventory and map are constantly updated
- Suitable for networks of all sizes
- Provides live network monitoring
Cons:
- No SaaS version
You can get a Network Traffic Analysis add-on for WhatsUp Gold to get deeper intelligence on the performance of your network. This gives you greater troubleshooting capabilities through the insights on network performance both by link and end-to-end. A capacity planning scanning tool helps you predict demand and expand resources where necessary.
Nmap: An Essential Network Administration Tool
Ultimately, if you’re looking for a tool that allows you to target systems within your network and navigate around firewalls, then Nmap is the tool for you. Though it is not as glamorous as some of the other network analysis tools on the market, it remains a core part of most IT administrators’ toolkits. Ping scans and port scans are just the tip of the iceberg when talking about what this platform is capable of.
If you’d like to learn more about Nmap, an extensive community website is full of guides and information to help you get the most out of your experience. You can access the Nmap documentation over at the tool’s site. Once you get past the learning curve, you’ll not only have more transparency over your network, but you will be able to safeguard your systems against future threats. Just start out by learning the basics and you’ll do just fine with NMap.
How to use Nmap FAQs
Is scanning with Nmap illegal?
It isn’t illegal to scan ports on your own system. It isn’t even illegal to scan ports on someone else’s public-facing infrastructure. It is illegal to break into a system by using the information you gain from using Nmap.
What is the Nmap aggressive mode?
Aggressive mode is activated by the -A option on the command. This activates a bundle of options: OS detection (-O), version detection (-vS), script scanning (-sC), and traceroute (-traceroute). If you want to use those four functions, it’s a lot quicker to just type -A.
How long do Nmap scans take?
Nmap takes about 21 minutes for each host connected to the network.
Do you have a Nmap cheat sheet I can use?
Yes, we do – click on Comparitech Nmap Cheat Sheet.
