


Network performance and management is important for organizations of all sizes. Today, networks are used for data transfers, communication, and collaboration on a global scale. Almost every digital interaction depends on a stable and efficient network. But, with the increase in network complexity, maintaining these networks using traditional tools and practices is not possible. Also, no organization can compromise on its network performance. Hence, to make it easier to identify issues within the network, traceroute tools can be used.
A traceroute tool is a network diagnostic tool that allows network administrators and IT teams to trace the path that data packets follow from the source device to the final destination. Whether you use Windows or Linux-based tools, these enable admins to track every hop a data packet takes, along with the information on the time it took to reach its destination. Thus, enabling IT administrators, network engineers, and cybersecurity teams to pinpoint where delays, packet loss, or routing failures occur.
These tools can be a great benefit, especially for organizations with hybrid cloud infrastructures, remote workforces, or global digital services. With the introduction of traceroute tools, the team members no longer need to invest their time and energy into figuring out the cause behind slowdowns or outages. In fact, many companies are switching to these tools to troubleshoot performance issues.
Here are a few more pain points that have resulted in the high demand for traceroute tools:
- Your team members are finding it harder to diagnose network performance issues due to multiple routers, firewalls, and service providers in the communication path.
- Teams have no or less visibility into where and why data is being delayed or dropped. A common problem in hybrid and cloud-native infrastructures.
- Troubleshooting issues manually takes a lot of time, especially when dealing with distributed systems.
- Security teams are unable to find unusual routing patterns that may have resulted in compromised paths or malicious rerouting.
By investing in traceroute tools, team members will be able to overcome these challenges. They will have deeper visibility into how their network traffic flows and where exactly it encounters issues. Further, they will be able to identify the root cause of latency, bottlenecks, or disruptions in real-time and support faster resolution.
The only problem with these tools is not all traceroute tools offer the same capabilities. Some provide basic outputs, while others come with advanced features that deliver better results. With a wide range of options in the market, choosing the right traceroute tool that fits your organization’s size and complexity can be a big challenge.
In this guide, we will review some top traceroute tools you can rely on. Further, what all key factors and methodologies you must keep in mind when reviewing and evaluating these tools.
Our goal is to help you find the best traceroute tools that help track network issues in real-time by tracking their network path.
Here is our list of the best traceroute utilities and tracert software tools:
- ManageEngine OpManager (FREE TRIAL) Offers comprehensive monitoring and troubleshooting capabilities that surpass traditional tools like traceroute and tracert, making it our top choice. Start a 30-day free trial.
- SolarWinds Traceroute NG Vital free tool for troubleshooting network connection issues. Provides an analytical view from source to the destination hosts.
- VisualRoute Favored for the GUI visualizations (see screenshots in mini-review below), also offers good reporting and even diagnostics.
- Path Analyzer Pro Simple and efficient tool for both Mac and Windows users, with comprehensive reports.
If you need to know more, explore our vendor highlight section just below, or skip to our detailed vendor reviews.
Βest traceroute tools and tracert software highlights
Top Feature
Runs local traceroute from server, pinpoints internal connectivity issues
Price
Starts at $95 for 10 devices
Target Market
Organizations of all sizes monitoring network infrastructure, tracing data
Free Trial Length
30-day free trialAdditional Benefits:
Features:
Top Feature
Tracks evolving network paths with continuous TCP and ICMP tracing
Price
Free
Target Market
IT teams, network admins, organizations needing continuous connectivity analysis
Free Trial Length
Free tool
Read more ▼
Top Feature
Visualizes traceroute performance with an intuitive response time graph
Price
Lite free non-business use, Home from $59.95/computer, Business from $89.95/computer
Target Market
IT teams managing distributed networks or remote offices, network analysts
Free Trial Length
VisualRoute Lite is free for non-business use
Read more ▼
Top Feature
Consolidates WHOIS DNS routing data in one view
Price
Unlicensed evaluation free, Personal Snapshot $29.95, Personal Premier and Business Premier 1 or 5 or 10 users
Target Market
Security teams, organizations hardening identity in Active Directory and Entra ID
Free Trial Length
Free unlicensed evaluation
Read more ▼
Key Points To Consider Before Purchasing a Traceroute Tool
Traditional tools are no longer enough to manage the network complexities and track these routes in real-time. However, with Traceroute tools in practice, network administrators and IT professionals can better track the path that data follows and identify the areas causing trouble faster.
During our research, we even came across various such tools that offered similar features and functionalities. So, what are the key pointers that you should not miss when purchasing a traceroute tool for your organization? Let’s take a look at them.
- Visualization and Reporting: One of the key factors to look at in the tool is its user interface and reporting capabilities. An intuitive interface helps IT teams and network administrators to work better and faster. Further, with graphical interfaces, admins can easily understand complex network paths, thanks to visually appealing network maps, like NetPath or Open Visual Traceroute. Team members can even store and display historical traceroute data for analysis. With access to built-in reporting systems, team members can even view historical traceroute data for analysis and monitor issues over time.
- Advanced Features: Most traceroute tools come with the ability to identify data packet routes and measure hop-by-hop latency. To stand out, you must also look for advanced features during the selection process. Proactive network management requires tools that provide real-time updates of metrics like packet loss and response times as well as continuous monitoring. Hence, look for a tool that comes with packet capture and analysis capabilities. Further, it integrates well with other network monitoring and management tools. If your network has firewalls that prevent ordinary ICMP requests, you may need to have firewall bypass capabilities. Also, whether you can define the protocol (ICMP, TCP, or UDP) for traceroute activities using the tool.
- IPv4 and IPv6 Support: Modern networks use both types of internet addresses, i.e., IPv4 and IPv6. Hence, it is important to have a tool that can trace and analyze routes for both IPv4 and IPv6 addresses. A tool that supports both has less chance of missing out on key data paths or diagnosing issues.
- Platform Compatibility and Deployment Options: Different teams use different operating systems, for example, some rely only on Windows, while a few prefer Linux or macOS. In such a case, it is important to keep in mind platform capability. This factor ensures that the traceroute tool works well on the platforms your team uses. Also, consider the deployment option availability, such as a standalone application or a web-based service. If your team is spread out or works remotely, it is important to check if it is a cloud-based tool or not. Thus, allowing users to access it from anywhere.
- Security and Compliance: If your traceroute tool collects or stores data, it needs to be secure and compliant with your organization’s data policies. Especially in large organizations or industries like finance or healthcare, security compliance is a must when using any network tool.
- Cost and Support: Traceroute tools come in various pricing models. Some platforms offer free solutions, while a few have launched paid versions with different levels of features and support. Consider your budget and the level of support you require. Further, don’t miss to look into vendor’s support resources and documentation availability.
To dive deeper into how we incorporate these into our research and review methodology, skip to our detailed methodology section.
What is traceroute or tracert?
Traceroute and tracert are two commands that run tools used for network diagnostics and help with resolving connectivity issues by tracing the paths data packets take while traveling from their origins to their destinations.
Related post: What is Matt’s TraceRoute?
The syntaxes
On a Windows machine an admin would use the tracert command; while on a Linux or Mac OS one they would use the “traceroute” command instead. The syntaxes for the commands are:
tracert [-d] [-h maximum_hops] [-j host-list] [-w timeout] [-R] [-S srcaddr] [-4] [-6] target_name
traceroute [-46dFITUnreAV] [-f first_ttl] [-g gate,…] [-i device] [-m max_ttl] [-p port] [-s src_addr] [-q nqueries] [-N squeries] [-t tos] [-l flow_label] [-w waittimes] [-z sendwait] [-UL] [-D] [-P proto] [–sport=port] [-M method] [-O mod_options] [–mtu] [–back] host [packet_len]
Although the original tools were initially conceived to run from the CLIs (Command Line Interfaces), there are now more “flashier” versions with remarkable GUIs (Graphical User Interfaces). In this article, we will explore some of the best tools for traceroute and tracert.
Screenshots of traceroute and tracert
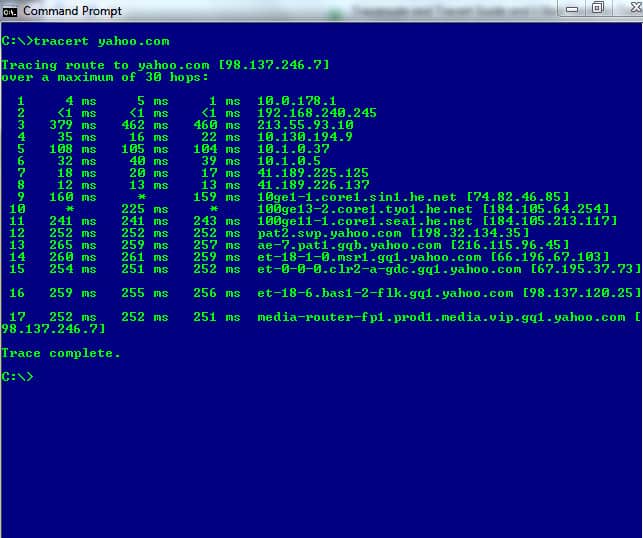
In the image below, the tracert command is running on a Windows machine and traces the path data packets would need to traverse if it had to reach the www.yahoo.com domain.
On a Linux machine the same CLI command using the traceroute keyword syntax to trace the path to google.com would look like:
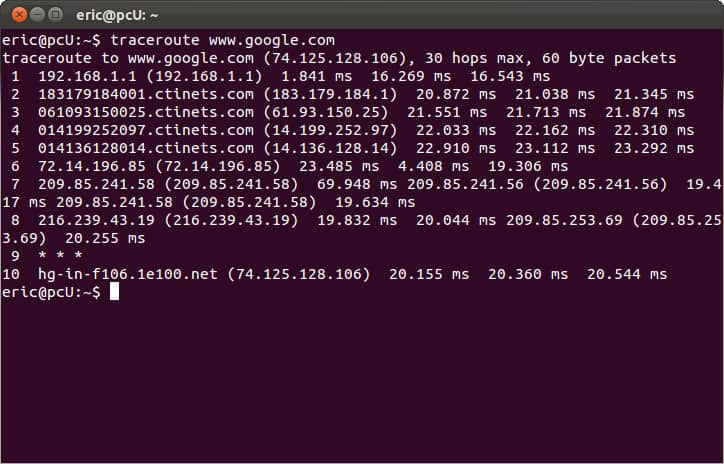
As we can see from the two images, once the command is executed, the program sends out a query across the network. This is to see which routes can be used to transport data packets between the origin machine’s network and the destination’s network.
Trivia: A tracert command from a Windows operating system machine sends out an ICMP (Internet Control Message Protocol) echo request, while a traceroute command from a Linux (or Mac) machine uses the UDP (User Datagram Protocol). The response, however, is always sent back in ICMP, regardless of what the sending host’s operating system is.
How do tracert or traceroute work?
To see how traceroute/tracert works, let us take a look at a breakdown of what occurs once a tracert or traceroute command has been sent:
- The command sends an IP packet out to the target device or network and starts monitoring for reports that are sent back in the form of replies from connected intermediary devices like routers and switches.
- The packets “hop” around from one device to the next and send back replies that help figure out their round-trip-times (RTTs). RTT is defined as the length of time taken for a packet to be sent out and then for a reply to come back confirming it has reached its intended destination.
- Whenever the packets hit a device and bounce back a reply, the admin also gets a bit of information detailing its IP address and device name (if it has one).
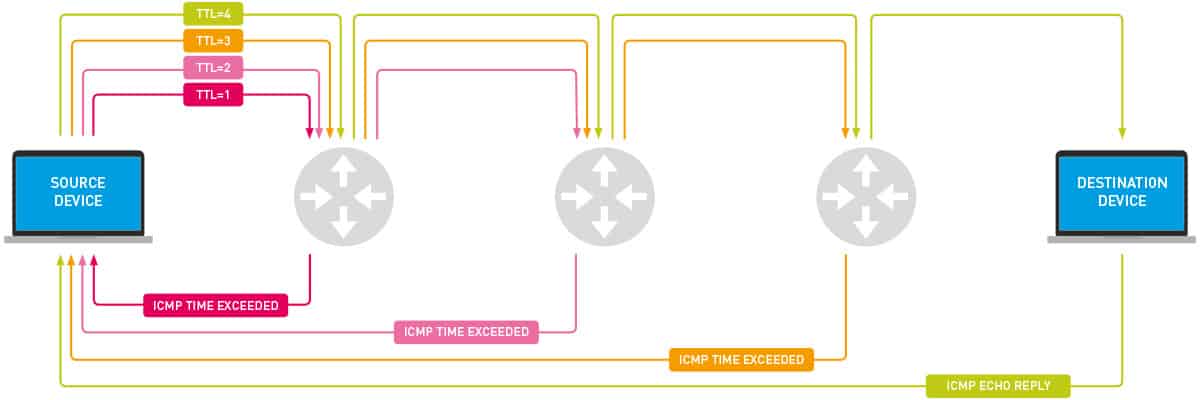
- Every time a packet is sent out, it is assigned a TTL (Time to Live) value that defaults to a maximum of 30 hops (but can be changed at will). We can see the advantages of the TTL by looking at what happens as the packet travels or hops across the network:
Step 1: When the first packet is sent out it is assigned a TTL of 1. When it reaches the first network device the TTL is reduced by 1 (making it 0 and hence dropping the packet) and a response is sent back to the source. This returning message will close a transport cycle allowing for the RTT to be calculated. If the replying device was the intended target, then the process ends with a “Resolved” message. If not…
Step 2: A second packet will then be sent with a TTL of 2. It passes through the device identified in Step 1 (where it loses a TTL value) and moves on to the next connected device beyond it. When it reaches a second device, it drops a TTL (making it 0) and a reply is sent back to the original host.
Step … n: The packets keep going out with increasing TTL values (until the maximum is reached) and the replies keep returning with a little more detail about the network that connects the origin and destination hosts.
Step “maximum no. of hops”: Finally, when the packet with the maximum number of hops is sent out, one of two things can be expected:
- Either, the destination host is reached and the network path is resolved or,
- The last packet will lose its TTL value, get dropped, and end with a “maximum number of hops reached” error message indicating the host couldn’t be reached.
A little bit more about the TTL
The TTL value determines the number of intermediate routers or other connecting devices that are going to be traversed as the packet travels towards the destination host. The traceroute/tracert command launches packets with TTL values starting at 1 and gradually increasing with each subsequent outgoing packet.
The TTL values decrease every time the packet hops to a device. Any packet whose TTL value reaches zero, is discarded and a “Time Exceeded” ICMP error message is generated and sent back to the original host.
Proceeding in this way, the networking tool uses the packets and reply messages to build a list of routers that data has to traverse through, until the destination is reached and returns an “ICMP Echo Reply” message.
How does traceroute or tracert help network admins?
Once the network path has been mapped out, a network admin can simply look at it, follow the paths that were taken by consecutive packets. They can see for themselves where the problem is (in case of non-delivery of the packets) or that everything works just as well as it should.
Then, all that remains is to fix disconnected routers and tweak the ones that have a high latency or packet loss rate.
The best traceroute tools and tracert software
Our Comparitech team came across a wide range of tools that could help trace data packet paths within the network. Most of these tools had similar features and functionalities. To bring you the best tools, we performed thorough research and shortlisted tools based on our methodologies and factors that are essential. Rather than limiting our search to features, we even covered other aspects, such as price, support service quality, user feedback, etc., that would make the whole process of selecting the right tool easier for you.
Here is our list and an in-depth review of Traceroute tools that guarantee quick identification of network issues and faster solutions.
1. ManageEngine OpManager (FREE TRIAL)
Best for: Organizations of all sizes can invest their time, energy, and money into these tools to monitor their network infrastructure and trace data.
Price: Available in Standard, Professional, and Enterprise editions with both annual subscription and perpetual license models. The editions page lists starting prices of $95 for 10 devices for the Standard edition, $145 for 10 devices for the Professional edition, and $4,595 for 250 devices for the Enterprise edition. OpManager also offers a 30-day free trial, a Free Edition for 3 devices and two users, a fully functional online demo, and a free customized demo, plus the option to request a personalized price quote.

ManageEngine OpManager provides extensive monitoring and troubleshooting features that go beyond the capabilities of traditional tools like traceroute and tracert.
ManageEngine OpManager’s Key features:
- Real-Time Network Monitoring: Continuous monitoring of network performance to detect issues promptly.
- Automated Workflows: Streamlined processes for routine network management tasks.
- Advanced Alerting: Notifications based on customizable thresholds to ensure immediate response.
- User-Friendly Interface: Intuitive design simplifies navigation and management.
- Extensive Customization: Adaptable settings to fit various network environments.
- Integration Capabilities: Seamless integration with other ManageEngine products for enhanced functionality.
Unique Buying Proposition
What really stands out to users in OpManager is people don’t need to switch between tools to run traceroutes. The traceroute feature is built directly into the product, making network troubleshooting quick and seamless for users. The tool automatically traces the path from the server to the destination device and displays key network performance details that makes it easier to find and fix issues.
Feature-in-Focus: Runs local traceroute to pinpoint internal connectivity issues
OpManager allows users to run a traceroute directly from the local server to any device. Thus, helping identify if the problem is within your own network and solve local connectivity issues before proceeding with monitoring external paths.
Why do we recommend it?
We recommend ManageEngine OpManager for its comprehensive network monitoring capabilities that go beyond basic traceroute and tracert tools. Its advanced features and ease of use make it an excellent choice for network administrators.
Who is it recommended for?
ManageEngine OpManager is recommended for IT professionals and network administrators who need a robust and scalable solution for managing and monitoring their network infrastructure. Its extensive features are ideal for medium to large organizations.
Pros:
- Comprehensive Monitoring: Provides a complete view of network performance, surpassing the capabilities of traceroute and tracert.
- Automated Tasks: Automates routine network management tasks, saving time and reducing human error.
- Custom Alerts: Offers advanced alerting based on user-defined thresholds, ensuring timely issue resolution.
- Easy to Use: The intuitive interface makes it accessible for users of all skill levels.
- Seamless Integration: Integrates well with other ManageEngine products, enhancing overall functionality.
Cons:
- High Learning Curve: Advanced features may require a steep learning curve for inexperienced users.
EDITOR'S CHOICE
ManageEngine OpManager is our top network performance monitor because it provides comprehensive monitoring and troubleshooting capabilities that surpass traditional tools like traceroute and tracert. The platform offers real-time network visibility, automated workflows, and advanced alerting systems. I particularly appreciate its user-friendly interface that simplifies network management tasks. Additionally, OpManager supports extensive customization, making it adaptable to various network environments. Its integration with other ManageEngine products further enhances its functionality and value.
Download: Get a 30-day free trial
OS: Windows, Linux, Cloud-based
2. SolarWinds Traceroute NG
Best for: IT teams, network administrators, and organizations who demand continuous analysis for connectivity issues and want to deliver optimal network performance must try this tool.
Price: Buyers can simply download the tool for free by visiting their official page.

SolarWinds is one of the biggest players in the network performance monitoring market. They are the makers of some impressive tools including the Traceroute NG – an easy-to-use, yet efficient network connection monitoring tool.
Traceroute NG – the tool that makes it all clear
With Traceroute NG, an administrator would have access to accurate single-path analysis visibility via CLI from the source to the destination hosts. It would effectively identify the number of hops, respective IP addresses, hostnames, packet loss, and latency.
SolarWinds Traceroute NG’s Key Features:
- Free to use: Free forever, not a free trial
- Graphical frontend: A competent implementation of the command line traceroute with a graphical interface
- Continuous scanning: An option to run the traceroute repeatedly
- Protocol option: Choose to probe connections to a specific port
- Write out results: Create a text file with the traceroute results
Other great features admins can expect from Traceroute NG include:
- It detects path changes and gives due notification
- The tool allows for continuous probing that yields an iteration number for the user
- Both IPv4 and IPv6 networks are supported and can be analyzed
- The path number and trace information can be saved in a .txt log file
- It is easy to copy data from the tool’s GUI to the clipboard
- The “switch” command allows admins to alternate the probe type between ICMP and TCP
- It allows for simultaneous logging (via the logging command) as well as probing
- DNS lookup can be enabled or disabled
Unique Buying Proposition
When presenting this to your buying team, inform them that SolarWinds Traceroute NG gives IT teams instant visibility into the flow of data across their network paths. It not only maps the routes but also shares critical insights such as IP addresses, hostnames, packet loss, and latency. Thus, enabling team members to pinpoint performance bottlenecks, misconfigured routers, or connection failures and perform faster root cause analysis.
Feature-in-Focus: Tracks evolving network paths with continuous TCP and ICMP tracing
SolarWinds Traceroute NG is not a one-time diagnostic tool. Instead, it provides real-time visibility through continuous probing. As your network paths evolve, it automatically detects and reflects changes, making it easier to catch the issues. What really stands out to users is its support for both TCP and ICMP network path analysis. This feature ensures more accurate and flexible tracing.
Why do we recommend it?
SolarWinds Traceroute NG has two big advantages: it is the product of a highly respected brand and it is free to use. This system uses both ICMP (Ping) and TCP methods to check on the connection metrics of each hop in a route to a given destination. This system can be run continuously, looking for path changes.
Who is it recommended for?
Any network manager would benefit from using this tool. Its continuous mode will raise an alert if a path changes. This is an indication that a network device is experiencing problems. So, the tool is an automated network device monitor as well as a free Traceroute package. The software runs on Windows.
Pros:
- Dual stack: Can run with IPv4 and IPv6 addresses
- Path change detection: If it is run continuously, the tool will spot route changes
- Alerts: Activate alerts for anomalies, such as path changes
- DNS resolution: Shows hostnames when they are available
- Connection statistics: Shows packet loss and latency
Cons:
- Available for Windows: Won’t run on macOS or Linux
SolarWinds Traceroute NG is a free tool and can be downloaded at Solarwinds.com
3. VisualRoute
Best for: IT teams managing distributed networks or remote offices or network analysts might find it a perfect fit.
Price: Buyers can download VisualRoute Lite free for non-business use, while paid licenses are offered under Home/Personal Use Licensing and Business Use Licensing, with Home/Personal Use prices from $59.95 for one computer and Business Use prices from $89.95 for one computer.
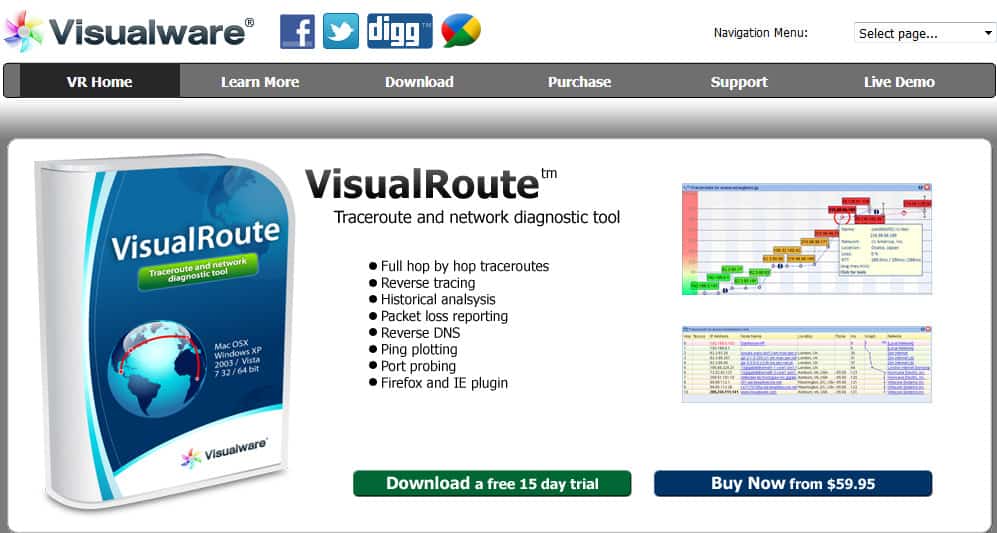
For network administrators looking for an exciting little tool that can perform as well as any of the more complex traceroute tools out there, they will certainly find it all in VisualRoute. This visual traceroute network tool is a joy to use as its GUI makes work a lot of fun.
VisualRoute’s Key Features:
- Shows a route on a map: The interface shows a map as well as a table of traceroute results
- Statistics storage: Store and recall route data
- Reverse tracing: Examines a connection to a customer device
- Troubleshooting: Good for case-by-case performance analysis
VisualRoute – reporting and diagnostics at its best
Administrators can get analytics results and reports that give advice like, “In general this route offers a good throughput, with hops responding on average within 68ms. However, all hops after hop 12 in network ‘[Network for 130.117.50.246]’ respond slightly slower than average.”
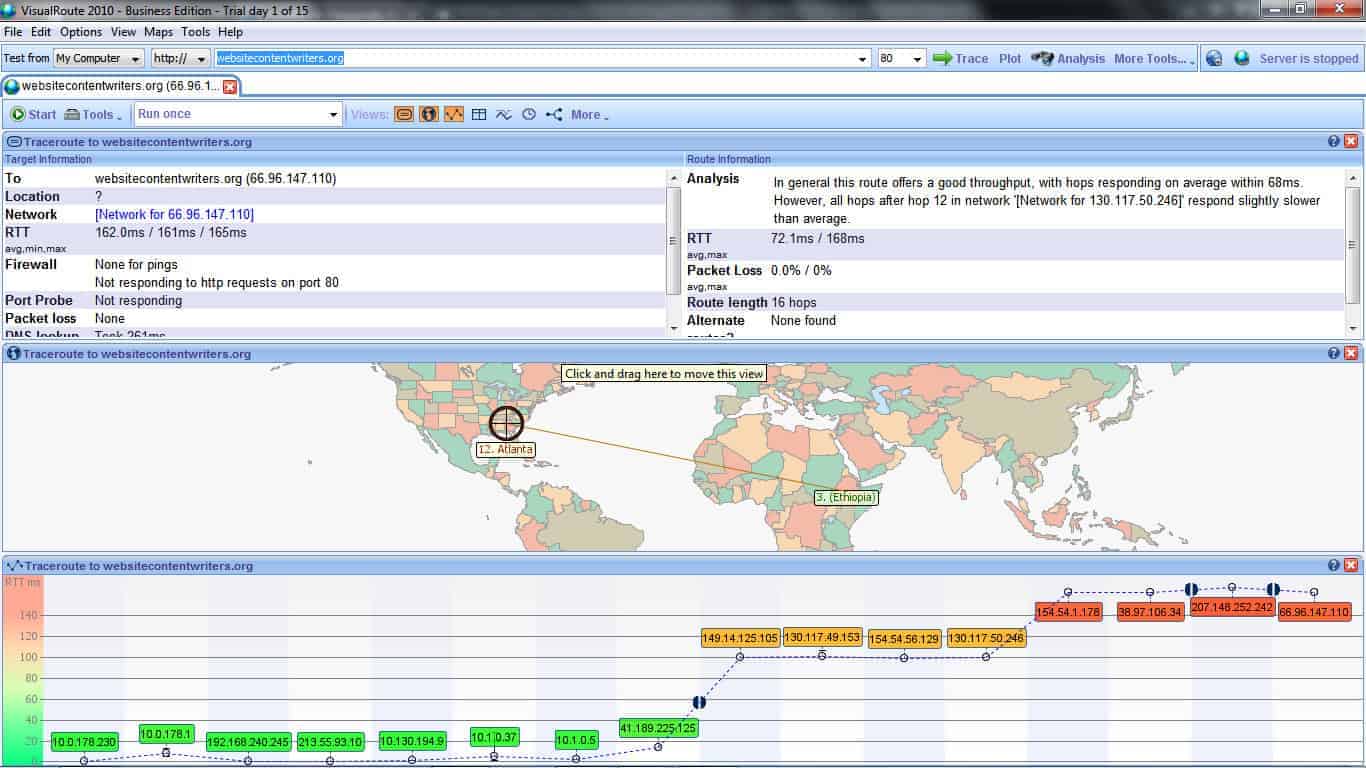
Taking a look at more features, though, it becomes quite obvious that VisualRoute is indeed a serious tool:
- A graphical map of the traceroute result makes it easy to comprehend and consume the data.
- Although VisualRoute’s main purpose is to map network paths, it goes above and beyond to perform several other essential network diagnostics with more tools like:
- Reverse tracing with remote agents so admins perform a reverse trace between two locations without actually being in either of the locations.
- Reverse DNS lookup allows for the discovery of IP addresses behind a domain name.
- Ping plotting to gauge and capture response times of IP addresses over a given time and have the data available in informative graphs.
- Storage of tracert data for future reference and performance comparison.
- Sending out of continuous tracert commands over measured time intervals makes it easy for admins to monitor any performance degradations that could occur over time.
Unique Buying Proposition
One thing users will appreciate is remote network diagnosis. Whether you’re troubleshooting a connection from a remote location or distance, VisualRoute’s web-based portal allows users to launch trace routes, visualize response times, and manage remote agents seamlessly. Thus, allowing IT teams to address network issues faster from anywhere.
Feature-in-Focus: Visualizes traceroute performance with an intuitive response-time graph
VisualRoute’s route graph view transforms complex traceroute data into an intuitive visual format. Rather than sifting through raw hop-by-hop details, users can instantly assess performance using the graph’s focus on response times at each network node.
Why do we recommend it?
VisualRoute provides a useful visual representation of all of the links in a route and also shows a world map that illustrates the source and destination of a connection. This is a useful system for examining internet connections. While the world map won’t help you with local network testing, the route graph will.
Who is it recommended for?
VisualRoute is a nice tool for use by small businesses. It is likely that larger businesses will already have connection testing utilities in their system-wide monitoring tools. This system isn’t free, so buyers should decide whether those graphics are worth paying for because without them, the free SolarWinds tool would do just as well.
Pros:
- Response time graphs: Time series performance line graphs
- Port probing: Trace and Ping to a specific port
- Continuous mode: Run Traceroute to a destination continuously and get an alert when the path changes
- Route comparison: View two Traceroute results side by side
Cons:
- Only suitable for internet connections: Doesn’t map networks
4. Path Analyzer Pro
Best for: Security teams and organizations aiming to harden their identity infrastructure, uncover and address vulnerabilities in Active Directory and Entra ID.
Price: Buyers can download and evaluate Path Analyzer Pro for free in an unlicensed version, or choose from paid licenses, with the Personal Snapshot edition priced at $29.95 and additional Personal Premier and Business Premier options for 1, 5, or 10 users.

Path Analyzer Pro is a visual traceroute tool that administrators with Mac machines can use alongside their Windows brethren as it works on both platforms. It is an amalgamation of tools that, apart from the main traceroute purpose, offers features that help with performance testing, DNS, Whois, and address resolution features.
Path Analyzer Pro’s Key Features:
- Multiple platforms: Available for Windows and macOS
- Visual representation: See a line graph of path speeds per link
- Reports: Useful for demonstrating performance facts to non-technical colleagues
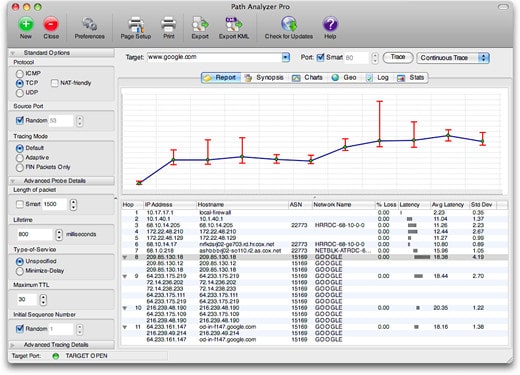
Path Analyzer Pro – simple yet impressively efficient
Some of the features that admins can expect from their Path Analyzer Pro include:
- A concise and to-the-point GUI that even novices can easily master.
- Excellent time performance that sees admins getting results back 20 times faster.
- Elaborate, yet comprehensible, reports that can either be consumed on the platform or exported for other remote users. They have impressive graphics detailing every aspect of a network.
- Map-based location of IP addresses with zoom, pan, and details.
- E-mail address tracing that can be used by crime stoppers and fighters to dig up more details about spammers or senders of unsolicited email messages
Unique Buying Proposition
In my professional opinion, Path Analyzer Pro not only provides basic IP-level hops, but also true layer-4 path discovery by using TCP, UDP, and ICMP protocols. Further, whether you’re investigating firewall behavior or path bottlenecks, the tool uncovers what traditional tools miss.
Feature-in-Focus: Consolidates WHOIS, DNS, and routing data in one view
Path Analyzer Pro’s Synopsis feature removes the need to switch between lookup tools. The program compiles all the important information you require in a single, consolidated view, eliminating the need to manually query five or ten different WHOIS services, registrars, DNS records, and network routers.
Why do we recommend it?
Path Analyzer Pro from Vostrom is a Traceroute tool that offers a visualization of the route. The system also includes an email source checker, which is a nice feature that few other Traceroute tools offer. Like VisualRoute, this tool can provide a world map showing the route.
Who is it recommended for?
Path Analyzer Pro is available for Windows and macOS. It offers more features on Macs than on PCs because the Windows version isn’t able to send out TCP-based tests. This isn’t a free tool and while it has similar functions to VisualREoute, it is more expensive.
Pros:
- Protocol analysis: Implement Traceroute to a specific port
- VPN testing: Examine how a VPN changes the route
- Connection troubleshooting: Examine the performance of connections to home-based workers
Cons:
- Not available for Linux: Only available for Windows and macOS
traceroute and tracert will draw the network for you
If you are a network administrator, then you will truly appreciate the capabilities of the three best traceroute and tracert tools we have just seen. Using one or all of them will allow you to draw an accurate picture of your network and the connectivity that lies beyond it. Make use of the tools and you will always have a clear image of what your network looks like.
Our Methodology for Choosing the Traceroute Tool
Organizations looking to invest in tools that simplify network path analysis and troubleshooting of routing problems should consider the following factors. Having a reliable traceroute tool that aligns with organizational goals has become essential. But, with so many options, determining the right one is a challenging task. Hence, we have come up with a few key factors that will make it easier to select the right tool for your organization.
1. Readable Route Layout
Make sure the selected tool displays the path that packets take when traveling across the network. It must provide hop-by-hop details that will ease the process of identifying the root cause of the issue. Further, a clean, readable layout will enable network admins to interpret routing behavior faster and figure out delays or anomalies.
2. Accurate Hop Timings
When analyzing network performance, keeping a record of hop timings is important. This information enables network admins to understand how long each hop took and pinpoint exactly where latency was introduced. This further helps identify the slow connections and problematic network segments.
3. Repeatable Test Options
Dynamic routing can cause network pathways to change frequently. Monitoring and keeping track of such information with traditional tools is impossible. Hence, try to invest in a modern tool that allows network admins to run repeat tests at various intervals and track path changes over time. These insights will help monitor irregularities and better understand network activity.
4. IPv4 and IPv6 Compatibility
As more networks transition to IPv6, it has become essential to invest in a traceroute solution that supports both IPv4 and IPv6 protocols. With access to such a tool, team members will be able to troubleshoot any type of modern network architecture.
5. Export Capabilities
Another major factor that a buyer must look for in their tool is its export capabilities. Being able to export traceroute results helps with reporting and deeper analysis. Whether you want to share it with your team members to import data into other network analysis tools, export features are advantageous.
6. Free Trial Version
Before putting your money into any tool, having the benefit of testing its features for free is a blessing. There are various tools in the market that offer 7 to 30 days of free trial sessions. Thus, enabling purchasers to assess its usability, reliability, and performance. Look for such a feature in your selected tool as well to reduce the risk of making wrong decisions.
7. Real Value for Investment
Even if you are choosing a free tool over paid tools, you are investing your time to evaluate and implement the tool. Make sure the free tool offers rich features, intuitive use, and consistent performance.
8. Comprehensive Network Diagnostic Features
Rather than going through multiple tools in the market that guarantee quick network path analysis, we recommend selecting a traceroute tool that comes with advanced features like DNS resolution, packet loss insights, and location-based hops. A complete toolkit that results in faster troubleshooting.
9. Support and Documentation
One of the key points that you should not miss is their support services. Whether you’re new to traceroute or dealing with a unique network issue, a tool that offers thorough documentation and a responsive support team is a great choice.
Broader B2B Software Selection Methodology
Features and functionalities are important when selecting a tool for your organization. But there are other parameters as well that play a crucial role in choosing the right software tool for your B2B business. Instead of determining a tool based on its performance, our team takes into account a wide range of other critical factors as well that make the decision-making process easier.
We aim to provide buyers with in-depth, practical insights that go beyond surface-level evaluations. Most platforms often overlook key factors like vendor support, scalability, and user feedback. However, our team ensures that each minor detail related to the vendor and their product is assessed.
Here are a few factors that our team usually keeps in mind when evaluating a tool:
- Is the price model reflecting the features and value the tool delivers? Is it capable of solving operational challenges that businesses frequently face?
- Can the tool scale in case the business grows or expands in the future? Will it be able to handle more data and user demands?
- What do existing customers think about the tool? How was their experience and feedback?
- How efficient or skilled is the vendor’s support team when responding to tickets?
- How well does the tool perform when compared to other similar tools in the market?
Most of these points are covered in our reviews, but if there is something more, the team tries to highlight it clearly in the reviews for informed decisions. Get more information on our software evaluation process using the B2B software methodology page.
Why Trust Us?
We understand that informed business decisions start with honest, accurate, and thoroughly researched information. So, our expert team makes efforts to go beyond their set limit and share insights that are fruitful. Comparitech has been a top platform for various businesses looking for in-depth software reviews and tools in the market. Our team’s dedicated effort and research work have turned us into a trusted source. Every time reviews are published, the technical team ensures that all points are given proper attention.
Rather than just limiting the research to software performance, our dedicated team thinks about every aspect that may help the business in the long run. Be it product features, vendor information, or updates on their support services, the team pays proper attention to all. Further, Comparitech experts acknowledge user feedback and job satisfaction level insights to learn about their environment. Over the years, presenting these useful insights to our readers has made us a trusted resource.
traceroute Tools & tracert FAQs
What does a route issue mean?
A route issue means that there is a problem somewhere on the path to the destination device. Usually, if there is an issue with one of the routers on a path to a faraway place, the neighboring routers will know about the problem and route traffic around the faulty node. Route issues are more likely to happen on your own network and be caused by an error in a routing table.
What is the difference between Traceroute and Tracepath?
Traceroute is an older utility and tracepath was created as a slight improvement. The main difference between the two is that tracepath gives the MTU without it being specifically requested. The MTU is available in the output for traceroute, but you have to add on an extra option in order to get it. One other old difference between the two was that traceroute was only available to superusers on Unix/Linux. However, it is now available to any user just like tracepath.
Why is Traceroute so slow?
Traceroute takes a lot longer than Ping to report back on a path because traceroute reports back on each node. So, if you are tracing a path over three nodes, traceroute goes out to the first node then gets a response, then it goes out to the second node and waits for a response, then it goes out to the third node and then gets a response, then it goes to the destination and waits for a response. All of that waiting and repeated probing means that Traceroute has more work to do than Ping, which just sends a message to the destination and waits for a response.
Why do I need traceroute or tracert tools?
Traceroute and tracert are invaluable network diagnostic tools used to track the path that data takes as it travels from one device to another over the internet or a local network. These tools are crucial for identifying and troubleshooting network connectivity issues, particularly when data packets experience delays or fail to reach their destination.
The primary function of traceroute (on Linux/macOS) or tracert (on Windows) is to trace the route that packets follow as they pass through routers and intermediate devices between the source and destination. By showing each hop along the way, these tools help network administrators and IT professionals pinpoint where problems are occurring. If there is network congestion, packet loss, or latency issues at a specific hop, traceroute/tracert can provide key insights into where the breakdown is happening.
Another important use case is identifying network routing inefficiencies. If data is taking an unexpectedly long or convoluted route, traceroute can help identify suboptimal paths or routing loops, allowing network engineers to adjust routing protocols or configurations to improve performance. These tools can also assist in diagnosing DNS issues by showing the time it takes for data to reach various DNS servers, which can highlight problems with DNS resolution.
Ultimately, traceroute and tracert are essential for diagnosing a wide range of network issues, whether it’s identifying slow connections, understanding routing paths, or troubleshooting connectivity problems, providing network teams with actionable insights for faster resolution.
Image credits:
SolarWinds Traceroute NG screenshot
Linux traceroute screenshot
Route demonstration screenshot
Example of hops and replies screenshot
