

What can you do with Wireshark?
Wireshark is an incredibly versatile and powerful tool used for network protocol analysis and troubleshooting. It allows users to capture and examine network packets in real-time, making it an invaluable asset for network administrators, cybersecurity professionals, and anyone looking to gain insights into network traffic. With Wireshark, you can perform a variety of tasks that help identify issues, optimize performance, and secure your network.
- Packet Capture and Analysis: The core function of Wireshark is to capture network traffic. By intercepting and analyzing packets on a network, it allows you to see the details of data being transmitted, including source and destination IP addresses, protocols, and application-level data. This can help troubleshoot issues like slow network performance or connection failures.
- Network Troubleshooting: Wireshark is essential for identifying and diagnosing network problems. By analyzing captured packets, you can pinpoint the root cause of issues such as packet loss, latency, or network congestion. It also helps in detecting configuration errors, faulty devices, and connectivity problems within the network.
- Security Monitoring: Wireshark provides deep visibility into network traffic, making it a critical tool for security professionals. It can be used to detect unauthorized access attempts, malware communications, or data exfiltration. By filtering and inspecting suspicious traffic, you can identify potential security threats and mitigate them before they cause damage.
- Protocol Analysis: Wireshark supports a wide range of network protocols, including HTTP, DNS, TCP/IP, and many others. It enables detailed inspection of how different protocols are being used on your network, helping to identify inefficiencies, misconfigurations, or vulnerabilities.
- Network Performance Optimization: By analyzing packet-level details, Wireshark can help identify bottlenecks or areas where network traffic can be optimized. This is particularly useful for improving application performance, optimizing bandwidth usage, and enhancing overall network reliability.
Overall, Wireshark is a comprehensive network analysis tool that provides detailed visibility, helping professionals monitor, troubleshoot, and secure their networks more effectively.
How to Use Wireshark
As mentioned above, Wireshark is a network protocol analysis tool. At its core, Wireshark was designed to break down packets of data being transferred across different networks. The user can search and filter for specific packets of data and analyze how they are transferred across their network. These packets can be used for analysis on a real-time or offline basis.
The user can use this information to generate statistics and graphs. Wireshark was originally known as Ethereal but has since established itself as one of the key network analysis tools on the market. This is the go-to tool for users who want to view data generated by different networks and protocols.
Wireshark is suitable for novice and expert users alike. The user interface is incredibly simple to use once you learn the initial steps to capture packets. More advanced users can use the platform’s decryption tools to break down encrypted packets as well.
Wireshark Core Features
Below is a breakdown of Wireshark’s core features:
- Capture live packet data
- Import packets from text files
- View packet data and protocol information
- Save captured packet data
- Display packets
- Filter packets
- Search packets
- Colorize packets
- Generate Statistics
Most users use Wireshark to detect network problems and test their software. As an open-source project, Wireshark is maintained by a unique team keeping service standards high. In this guide, we break down how to use Wireshark. Further information can be found on Wireshark’s official user guide.
How to Download and Install Wireshark
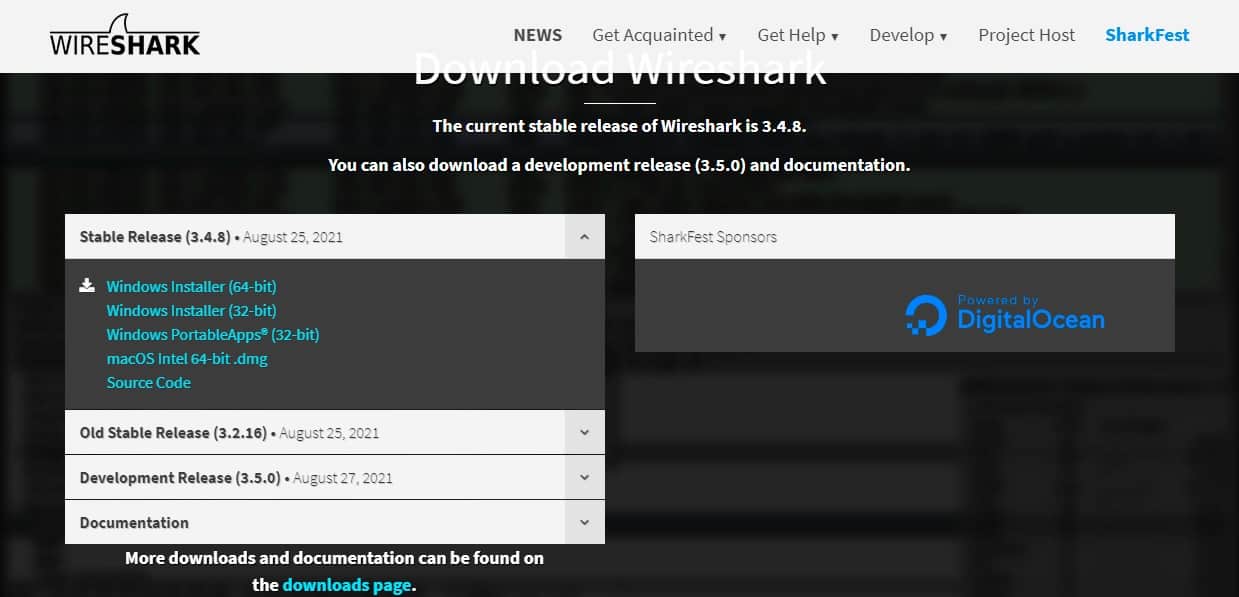
Before using Wireshark, the first thing you need to do is download and install it. You can download Wireshark for free from the company website. To have the smoothest running experience, it is advised that you download the latest version available on your platform from the “stable release” section.
Install on Windows
Once you’ve downloaded the program you can start the setup process. During installation, you may be prompted to install WinPcap. It’s important to install WinPcap as without it you will be unable to capture live network traffic. Without WinPcap you will only be able to open saved capture files. To install, simply check the Install WinPcap box.
Let’s look at this in more detail.
Select the installer for your Windows architecture (64-bit or 32-bit) click on the link to download the package.
Once the installer is on your computer, follow these steps:
- Click on the downloaded file to run it. Click Yes in the User Account Control window.
- Click Next in the opening screen of the installer.
- In the License Agreement screen, click the Noted button.
- Leave all of the defaults in the Choose Components screen. Click the Next button.
- Leave all settings as they are in the Additional Tasks screen and click on Next.
- In Choose Install Location, just click on Next.
- In the Packet Capture screen, leave the consent box checked and click the Next button.
- In the USB Capture screen, check the Install USBPcap box and press the Install button.
- Let the installation progress. During the process, you will be presented with a consent screen for Npcap. Click on I Agree.
- In the NPcap Installation options screen check Restrict Npcap driver’s access to Administrators only, Support raw 802.11 traffic (and monitor mode) for wireless adapters, and Install Npcap in WinPcap API-compatible Mode. Click on Install.
- When the Npcap setup has finished. Click on Next and then Finish to dismiss that dialogue window. The Wireshark installation will continue.
- In the Installation Complete screen, click on Next and then Finish in the next screen.
Look in your Start menu for the Wireshark icon. Click on it to run the utility.
Install on Mac
To install Wireshark on Mac you first need to download an installer. To do this, download an installer such as exquartz. Once you’ve done this, open the Terminal and input the following command:
<% /Applications/Wireshark.app/Contents/Mac0S/Wireshark>
Then wait for Wireshark to start.
Install on Unix
In order to run Wireshark on Unix, you need a couple of other tools installed on your system first. These are:
- GTK+, The GIMP Tool Kit and Glib, both from the same source.
- You will also need Glib. You can get familiar with both tools at https://www.gtk.org/
- libpcap, which you get from http://www.tcpdump.org/.
After installing the above supporting software, and downloading the software for Wireshark, you need to extract it from the tar file.
gzip -d wireshark-1.2-tar.gz
tar xvf wireshark-1.2-tar
Change to the Wireshark directory and then issue the following commands:
./configure
make
make install
You can now run the Wireshark program on your Unix computer.
How to Capture Data Packets
One of the core functions of Wireshark as a network analysis tool is to capture packets of data. Learning how to set up Wireshark to capture packets is essential to conducting detailed network analysis. However, it’s important to note that it can be difficult to capture packets when you’re new to Wireshark. Before you start to capture packets, there are three things you need to do:
- Make sure that you have the administrative privileges to start a live capture on your device
- Choose the correct network interface to capture packet data from
- Capture packet data from the correct location in your network
Once you’ve done these three things, you’re ready to start the capture process. When you use Wireshark to capture packets, they are displayed in a human-readable format to make them legible to the user. You can also break packets down with filters and color-coding if you wish to see more specific information.
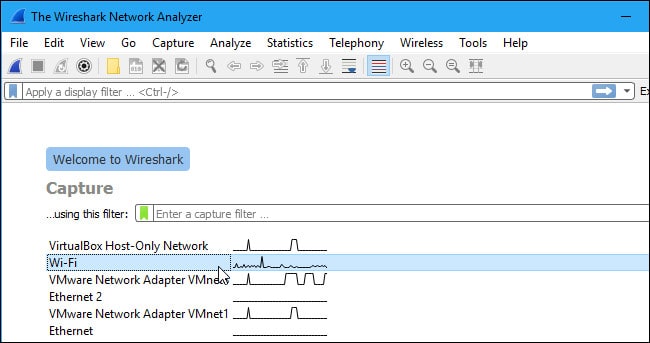
When you first open up Wireshark, you’ll be met by the following launch screen:
The first thing you need to do is look at the available interfaces to capture. To do this, select Capture > Options. The “Capture Interfaces” dialog box will then open as shown below:
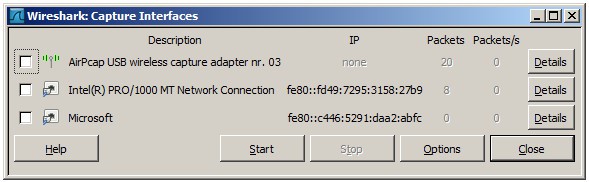
Check the box of the interface you want to capture and press the Start button to start. You can select multiple interfaces if you want to capture data from multiple sources simultaneously.
On Unix or Linux, the dialog box is shown in a similar style like this:

You can also start Wireshark by using the following command line:
<¢ wireshark -i eth0 —k>
You can also use the shark fin button on the toolbar as a shortcut to initiate packet capturing. Once you click this button, Wireshark will start the live capture process.
If you want to stop capturing, click the red stop button next to the shark fin.
Promiscuous Mode
If you want to develop an overhead view of your network packet transfers, then you need to activate ‘promiscuous mode’. Promiscuous mode is an interface mode where Wireshark details every packet it sees. When this mode is deactivated, you lose transparency over your network and only develop a limited snapshot of your network (this makes it more difficult to conduct any analysis).
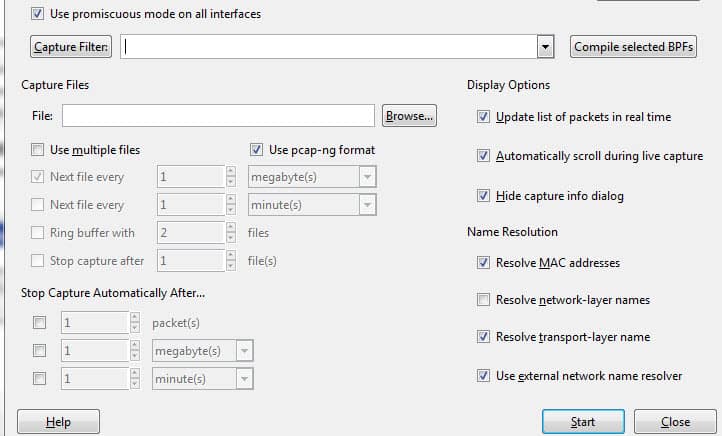
To activate promiscuous mode, click on the Capture Options dialog box and click promiscuous mode. In theory, this should show you all the traffic active on your network. The promiscuous mode box is shown below:
However, this often isn’t the case. Many network interfaces are resistant to promiscuous mode, so you need to check the Wireshark website for information on your specific hardware.
On Windows, it’s useful to open Device Manager and check whether you have your settings configured to reject promiscuous mode. For example:
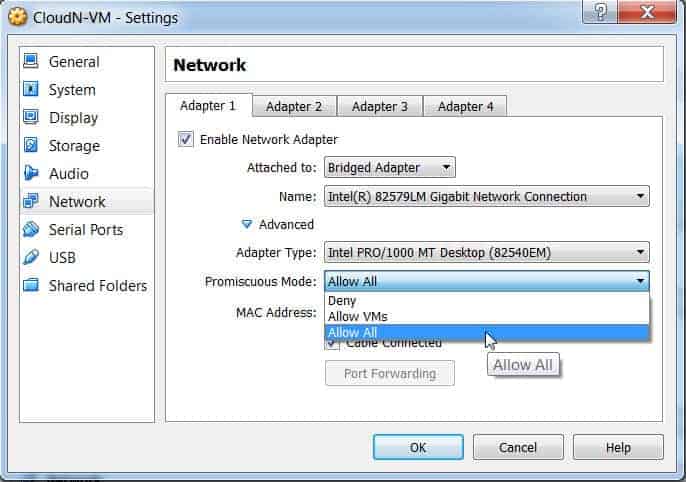
(Simply click on network and then make sure that your promiscuous mode setting are set to Allow All).
If you have your settings set to “reject” promiscuous mode, then you’re going to limit the number of packets Wireshark captures. So even if you have promiscuous mode enabled on Wireshark check your Device Manager to make sure that your interface isn’t blocking any data from coming through. Taking the time to check through your network infrastructure will ensure Wireshark receives all the necessary packets of data.
How to Analyze Captured Packets
Once you’ve captured your network data, you’ll want to look at your captured packets. In the screenshot below you’ll see three panes, the packet list pane, the packet bytes pane, and the packet details pane.
If you want more information, you can click on any of the fields in each packet to see more. When you click on a packet, you’re shown a breakdown of its internal bytes in the byte view section.
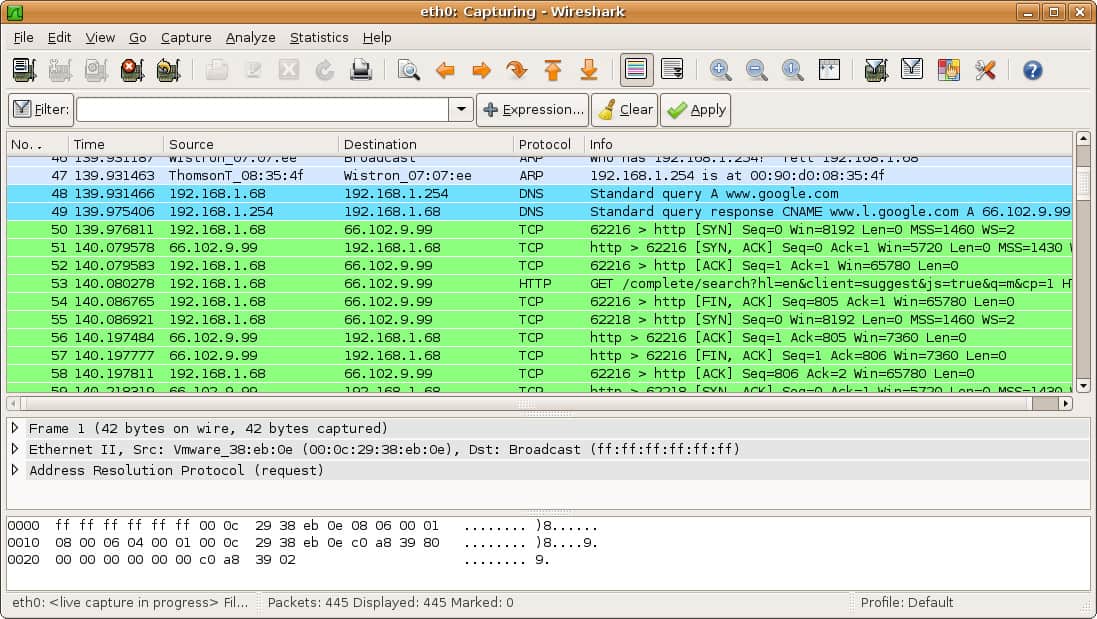
Packet List
The packet list pane is shown at the top of the screenshot. Each piece is broken down to a number with time, source, destination, protocol and support information.
Packet Details
Packet details can be found in the middle, showing the protocols of the chosen packet. You can expand each section by clicking on the arrow next to your row of choice. You can also apply additional filters by right-clicking on the chosen item.
Packet Bytes
The packet bytes pane is shown at the bottom of the page. This pane shows the internal data of your selected packet. If you highlight part of the data in this section, its corresponding information is also highlighted in the packet details pane. By default, all data is shown in hexadecimal format. If you want to change it to bit format, right-click the pane and select this option from the context menu.
How to use Wireshark to Analyze Network Performance
If you want to use Wireshark to inspect your network and analyze all active traffic, then you need to close down all active applications on your network. This will reduce traffic to a minimum so you can see what is happening on your network more clearly. However, even if you turn off all of your applications, you’ll still have a mass of packets being sent and received.
Using Wireshark to filter these packets is the best way to take stock of your network data. When your connection is active, thousands of packets are transferring through your network every second. This means it’s vital that you filter out the information you don’t need to get a clear picture of what’s going on.
Capture Filters and Display Filters
Capture Filters and Display Filters are two types of distinct filters that can be used on Wireshark.
Capture Filters and Display Filters are two types of distinct filters that can be used on Wireshark. Capture Filters are used to reduce the size of incoming packet capture, essentially filtering out other packets during live packet capturing. As a result, capture filters are set before you begin the live capture process.
Capture Filters are used to reduce the size of incoming packet capture, essentially filtering out other packets during live the packet capturing. As a result, capture filters are set before you begin the live capture process.
Capture Filters can’t be modified once a capture has been started. On the other hand, Display Filters can be used to filter data that has already been recorded. Capture Filters determine what data you capture from live network monitoring, and Display Filters dictate the data you see when looking through previously captured packets.
If you want to start filtering your data, one of the easiest ways to do this is to use the filter box below the toolbar. For example, if you type in HTTP in the filter box, you will be provided with a list of all HTTP packets captured. When you start typing, you’ll be met with an autocomplete field. The filter box is shown below:
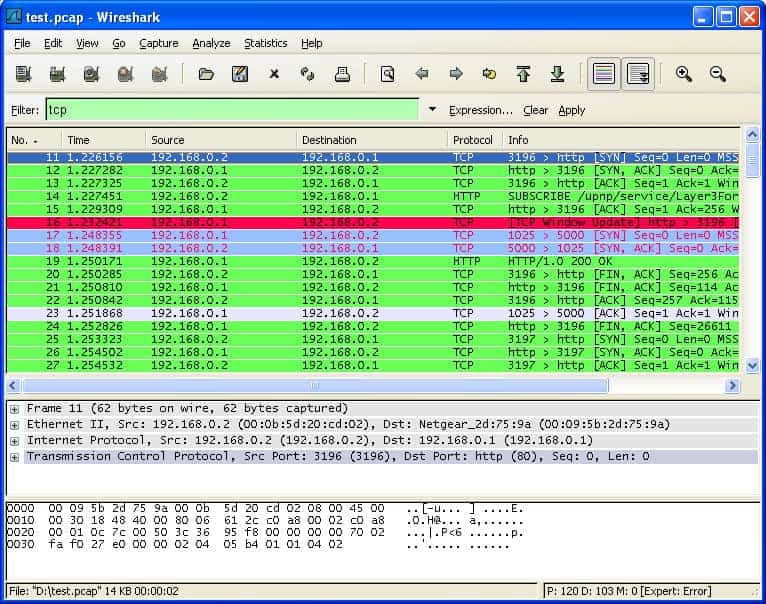
You can use hundreds of different filters to break down your packet information, from 104apci to zvt. An extensive list can be found on the Wireshark website here. You can also choose a filter by clicking on the bookmark icon to the left of the entry field. This will raise a menu of popular filters.
If you choose to set a capture filter, then your changes will come into effect once you start recording live network traffic. To activate a display filter, simply click on the arrow to the right of the entry field. Alternatively, you can click Analyze > Display Filters and choose a filter from the list of defaults.
After choosing a filter, you can view the TCP conversation behind a packet. To do this, right click on the packet and click Follow > TCP stream. This will show you the TCP exchange between the client and server.
If you want more information about Wireshark filtering, Wireshark’s guide to display filters is a good point of reference.
Using Color Coding
In addition to filtering which packets are shown or recorded, Wireshark’s color-coding facility makes it easier for the user to identify different packet types according to their color. For example, TCP traffic is denoted by light purple and UDP traffic is denoted by light blue. It’s important to note that black is used to highlight packets with errors.
On Wireshark’s default settings, there are around 20 colors you can choose from. You may edit, disable or delete these. If you want to turn off colorization, click on the View menu and click Colorize Packet List field to turn it off. If you’d like to view more information about the color-coding on Wireshark, click View >Coloring Rules.
Viewing Network Statistics
To view more information on your network, the statistics drop-down menu is incredibly useful. The statistics menu can be located at the top of the screen and will provide you with several metrics from size and timing information to plotted charts and graphs. You can also apply display filters to these statistics to narrow down important information.
The Wireshark statistics menu is shown below:

In this menu are a variety of options to help you break down your network information.
Statistics Menu Selections
Here are some of the core sections:
- Protocol Hierarchy – The Protocol Hierarchy option raises a window with a complete table of all captured protocols. Active display filters are also displayed at the bottom.
- Conversations – Reveals the network conversation between two endpoints (For example exchange of traffic from one IP address to another).
- Endpoints – Displays a list of endpoints (a network endpoint is where protocol traffic of a specific protocol layer ends).
- IO Graphs – Displays user-specific graphs, visualizing the number of packets throughout the data exchange.
- RTP_statistics – Allows the user to save the content of an RTP audio stream directly to an Au-file.
- Service Response Time – Displays the response time between a request and the network’s response.
- TcpPduTime – Displays the time taken to transfer data from a Protocol Data Unit. Can be used to find TCP retransmissions.
- VoIP_Calls – Shows VoIP calls obtained from live captures.
- Multicast Stream – Detects multicast streams and measures the size of bursts and the output buffers of certain speeds.
Visualizing Network Packets With IO Graphs
If you want to create a visual representation of your data packets, then you need to open IO graphs. Simply click on the statistics menu and select IO graphs. You’ll then be met by a graph window:
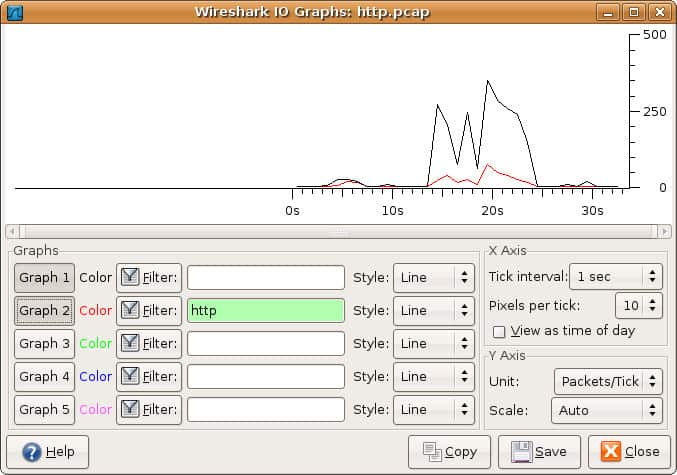
You can configure IO graphs with your own settings according to the data you want to display. By default only graph 1 is enabled, so if you want to activate 2-5 you need to click on them. Likewise, if you want to apply a display filter for a graph, click the filter icon next to the graph you want to interact with. The style column allows you to change how your graph is structured. You can choose between Line, FBar, Dot, or Impulse.
You can also interact with the X and Y axis metrics on your graph as well. On the X-axis, the tick interval sections allow you to dictate how long the interval is, from minutes to seconds. You can also check the view as time of day checkbox to change the time of the X-axis.
Under the Y-axis section, you can change the unit of measurement from any of the following options: Packets/Tick, Bytes/Tick, Bits/Tick, or Advanced. The scale allows you to choose the scale of measurement for the Y-axis of the graph.
Once you press save the graph is then stored in a file format of your choice
How to Use Sample Captures
If you want to practice using Wireshark but your own network is unavailable for whatever reason, using ‘sample captures’ is a great alternative. Sample captures provide you with another network’s packet data. You can download a sample capture by going on the Wireshark wiki website.
The Wireshark wiki website features a variety of sample capture files that can be downloaded across the site. Once you’ve downloaded a sample capture you can use it by clicking File > Open and then clicking on your file.
Capture Files can also be found from the following sources below:
Expanding Wireshark’s capabilities
Although Wireshark is a great packet sniffer, it isn’t the be-all and end-all of network analysis tools. You can expand Wireshark and support it with complementary tools. A wide community of supporting plugins and platforms can enhance Wireshark’s capabilities.
Try out these Wireshark additions to improve your analytical capabilities:
- Elastic Stack with Wireshark Use Wireshark as a feed to Elasticsearch and its related data management modules to create a better analysis environment than Wireshark provides by itself. The Elastic Stack products are free to use.
- NetworkMiner is another analytical tool that acts on feeds from Wireshark. This tool comes in both a free and paid version.
- Show Traffic displays live traffic data, identifying packets by protocol.
A full network analysis tool, such as the SolarWinds monitor explained below, would also be a good addition to your IT admin toolkit.
SolarWinds Network Performance Monitor: 360-Degree Network Management
As one of the leading network management solutions on the market, SolarWinds Network Performance Monitor provides the user with extensive network monitoring functions to keep their network safe. From monitoring bandwidth to latency across a network, the user can track all live changes through the performance analysis dashboard.
The live performance analysis dashboard provides an overview of the user’s real-time network infrastructure. A visual display shows all active network connections and devices. This makes it easier for the user to spot unauthorized devices.
The user-friendly interface allows users to define their own alerts so that they can be notified when unusual changes occur on their network. If a new device attempts to connect, this can be flagged by the system. The live data generated on the analysis dashboard can also be converted into reports to generate further insights.
- Multi-Vendor Networking Monitoring – Identify and resolve multi-vendor performance issues.
- Wireless Network Monitoring – View performance metrics from access points, wireless devices and clients.
- Identify Network Dead zones – View heatmap of wireless network and identify areas with weak signal.
- Performance Analysis dashboard – View your entire network performance on one timeline. Drag and drop network performance data to create a live data visualization.
- Intelligent Alerts – Users define how alerts are generated. Choose which trigger conditions will generate an alert on the dashboard.
Wireshark: Simple and Versatile
That concludes our breakdown of how to use Wireshark. Whether you’re a new user or a Wireshark veteran, this platform is an extremely versatile network analysis tool. If you’re looking to get the most out of Wireshark, it is highly recommended that you do additional research on the Wireshark website.
This is even more important if you’re looking to use more advanced features and create your own protocol dissectors. Wireshark’s official user guide offers the most comprehensive body of guidance on the subject.
Don’t forget to use external plugins and supporting software programs from SolarWinds as they can dramatically increase the depth of your future analysis efforts. If you’d like more information about optimizing your network, check out our in-depth guide on network analyzers.
How to use Wireshark FAQs
Can Wireshark see all network traffic?
Wireshark will see all traffic intended for the port that it is connected to. It won’t see traffic on a remote part of the network that isn’t passed through the switch being monitored. It will only pick up traffic sent to the monitored port. However, it is possible to get the switch to replicate all the traffic on all of its connections and forward that onto one switch port, which will be where you should connect the device hosting Wireshark.
Does Wireshark affect network performance?
No. Wireshark is a listener, it doesn’t generate traffic. However, if you set a switch on the system to duplicate all passing traffic to send to the Wireshark-monitored port then network traffic will be increased and performance could be impaired.
Is it illegal to use Wireshark on a public wifi?
It is not illegal to use Wireshark anywhere, however, there are some illegal activities that can be facilitated by Wireshark. Think of Wireshark as being like a telescope. It is not illegal to look through the air with a telescope at passing cars, but it is illegal to use it to look through someone’s window.

