Since 2014, the US government has suffered 1,283 breaches affecting more than 200 million records. Based on the average cost per breached record (as reported by IBM each year), we estimate these breaches have cost government entities nearly $30.4 billion from 2014 to mid-November 2023.
The number of government breaches hit an all-time high in 2019 with 226 reported, up from 160 in 2018. Since then, figures have steadily declined year-on-year with 182 breaches in 2020, 154 in 2021, and 120 in 2022. However, 2023 has already broken this trend with 137 recorded breaches so far (up to mid-November).
2023 has also seen a huge uptick in breached records with 22.4 million affected so far in total–over four times 2022’s figure of 4.9 million. The average number of records affected per attack also far surpasses the figures seen over the last four years. An average of 400,246 records have been impacted in government breaches throughout 2023 compared to 76,130 in 2022, 39,469 in 2021, 42,005 in 2020, and 17,427 in 2019.
That said, 2018 is still the biggest year for total and average breached records. 83 million were impacted in total (60 million of these stemmed from one breach on the US Postal Service) and 1.2 million on average.
As these figures rise, hackers are once again making a big impact on government entities. The true extent of breaches often isn’t felt for months, if not years, so the figures for this year could increase even further.
So, what are these data breaches costing the government, how have government breaches developed over time, and what trends have we seen in recent years?
Our team of researchers has collated information on government data breaches dating back as far as 2014. We’ve searched through state data breach reports, federal reports, news, press releases, and industry reports to create an extensive list of breaches that have affected government agencies across the United States.
Breach definitions: Card (debit/credit card not via hacking, e.g. skimming), Hack (outside party or malware), Insd (insider–employee or customer), THRD (third-party vendor or processor), Phys (paper documents), Port (portable devices, e.g. laptops, memory sticks, and hard drives), Rans (ransomware), Stat (stationary computer), Disc (unintended disclosure, e.g. sensitive information posted publicly), Unkn (unknown). Phishing attacks aren’t listed separately here, but they may be the method used to initiate hacks and ransomware attacks.
Key findings
From 2014 to November 2023:
- 1,283 government entities suffered data breaches
- 201,184,801 records were affected because of these breaches
- The cost of these affected records was nearly $30.4 billion
- 2019 was the biggest year for breaches with 226 in total, followed closely by 2020 with 182
- 2018 had the highest number of records affected– 84,794,645 in total
- California had the most breaches overall (148) and the District of Columbia had the highest number of records affected overall (92.4 million). DC’s vast number of affected records stems from many government offices being based there
- The most common type of breach was ransomware with 415 breaches. Those that involved hacking were the second-largest breach type with 266 breaches
- Cities were the most-affected government entity type from 2018 to mid-Nov 2023 with 237 breached, while counties were breached 162 times during the same time period
Which state had the most government data breaches from 2014 to mid-November 2023?
When looking at the number of government records affected per 100,000 people, DC records a whopping 13.4 million per 100,000 people. However, as many of the breaches in this state affected the entire nation, it wouldn’t be fair to use this in our comparison.
When excluding DC, Indiana records the highest number of records affected per 100,000 people with 234,774 records in total. Washington recorded the second-highest number of records affected per 100,000 people with 154,767.
A further four states have more than 100,000 records per 100,000 people, these are Oregon (141,466), Louisiana (135,849), Maine (118,241) and Montana (100,189).
More than half of all states (27) reported more than 10,000 breached records per 100,000 people.
With 148 separate breaches, California had the most government data breaches during this time period, significantly higher than any other state. Texas and Florida were the second-highest states for government breaches with 92 and 68 respectively. They were followed by Massachusetts with 54 breaches, the District of Columbia (50), and Georgia (46).
The District of Columbia recorded a significantly high number of breached records (92.4 million). As mentioned, this is due to many government entities being based there. Therefore, the records affected in DC likely impact many residents across all states in the US. Hence why we have excluded it from the above map.
California also had a high number of breached records at 24.6 million. The vast majority of these records came from the California Secretary of State breach in 2017 when 19.2 million voter records were left exposed on an unprotected database.
Indiana saw 15.9 million records affected across just 25 breaches. Nearly all of these came from the breach on the Government Payment Service, Inc. The District of Columbia, California, Indiana, and Washington were the only states to have more than 10 million breached records.
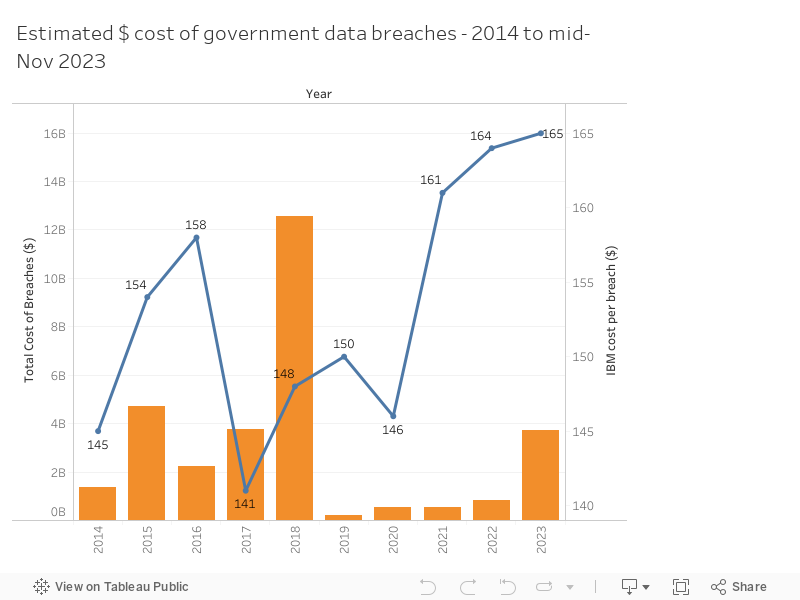
The cost of government data breaches by year
According to IBM, the average cost per record involved in a breach in 2023 is $165–a slight increase on 2022’s cost of $164. 2023’s figure is the highest IBM has recorded over the last nine years, with 2017 being the lowest at $141.
Using IBM’s yearly data on the cost per breached records, we’ve estimated how much these breaches have cost government entities.
From the start of 2014 to mid-November 2023, we estimate data breaches have cost US government organizations nearly $30.4 billion.
While this figure sounds relatively high for these 1,283 data breaches, the true costs are likely much higher. This is largely due to the fact that some figures are unavailable for the number of records involved in these breaches.
As the 2023 IBM study reveals, data breaches within organizations labeled “critical infrastructure,” e.g. the public sector, are often much higher. It found that the average cost of a data breach within this category was $5.04 million–(a 4.6 percent increase from 2022) and $1.26 million higher than organizations within non-critical infrastructure, e.g. services, hospitality, and entertainment.
The top 5 biggest government data breaches (since 2014)
- The US Postal Service, 2018 – 60 million records: A flaw led to the exposure of 60 million users’ account details – something USPS was warned about a year prior.
- The Office of Personnel Management, 2015 – 21.5 million records: Hackers stole the information of 21.5 million former and current US government employees.
- California Secretary of State, 2017 – 19.2 million records: Voter records for more than 19 million people were available for all to view after a database was left unprotected.
- Government Payment Service, Inc., 2018 – 14 million records: GovPayNow.com, which is used by thousands of local and state governments, leaked over 14 million customer records, including names, phone numbers, addresses, and the last four digits of the payer’s card.
- Georgia Secretary of State, 2015 – 6 million records: A massive data breach occurred when Brian Kemp’s office released data, including personally identifiable information, to political parties, the media, and other subscribers who buy voter information (legally) from the state.
In joint fifth place is the Louisiana Office of Motor Vehicles, which was breached in May 2023 as part of the MOVEit transfer breach. It reported 6 million records were affected as a result of the breach. Other MOVEit victims with high breached record figures were Colorado Department of Health Care Policy & Financing (4.2 million breached records) and Oregon’s Department of Transportation (3.5 million breached records).
What type of government entities were most affected from 2018 to mid-November 2023?
To get a more granular look at how government data breaches have developed in recent years, we’ve explored the number of breaches and records affected by government entity type from 2018 to present. Data is more readily available for these years.
Just over 24 percent of the government breaches (237) we found from 2018 to mid-November affected city governments. This was considerably higher than counties that featured in second place with a total of 162 breaches. These were closely followed by law enforcement (136) and departments of health and towns (both with 75 breaches).
The 237 breaches in cities affected more than 1.2 million people. The worst breach for records affected was in the City of Tomball, Texas. The city’s network was hit with a ransomware attack in December 2022, which affected 400,000 records.
Other large-scale breaches on cities included:
- The City of Tucson, AZ – 2022: 123,513 records were breached after suspicious activity on the city’s network.
- The City of Independence, MO – 2020: 113,579 records were breached after a ransomware attack occurred on city systems.
- The City of Harrisburg, PA – 2021: 72,000 people’s data was mishandled after a city employee set up an unauthorized Google account to share information relating to COVID-19 exposure.
- The City of Pensacola, FL – 2019: 60,000 people were affected after a ransomware attack.
- The City of Whitehall, OH – 2022: 36,694 records were breached in another ransomware attack by the ALPHV/BlackCat group.
County governments accounted for 16.5 percent of the total breaches suffered across this time period with 162 in total and 3 million people affected. Some of the biggest were:
- Allegheny County, PA – 2023: As part of the MOVEit transfer data breach in May 2023, 967,690 records were breached in Allegheny county.
- Pierce County, WA – 2022: 463,110 registered voters in Pierce County had their private data accidentally shared by an employee who uploaded a spreadsheet after receiving a public records request.
- Denton County, TX – 2021: 326,417 residents had their personal information exposed, including COVID-19 vaccination information, due to a vulnerability in a third-party app.
They were closely followed by law enforcement agencies (14%) with 136 police departments, sheriff’s offices, prisons, and other entities suffering breaches. Some of the largest breaches across law enforcement included:
- Caddo Parish District Attorney’s Office, LA – 2021: Caddo DA discovered its computers had been infected with malware, which led to 230,188 records being affected.
- Defense Information Systems Administration, MD – 2019: Personal information of 200,000 people was compromised at the Defense Information Systems Administration. It took nearly a whole year to notify individuals of the breach.
- U.S. Customs and Border Protection, DC – 2019: 184,000 images including photos of people’s faces and license plates were compromised as part of an attack on a federal subcontractor at a single land border entry point which remained unnamed.
How is 2023 looking for government data breaches so far?
With just over a month left of 2023, this year is projected to be a record-breaking year for government data breaches. So far this year, 137 recorded government breaches affected 22.4 million records. The number of breaches are already greater than the 120 breaches seen last year. The number of records involved is over four times the number breached in 2022 (5 million).
IBM’s 2023 report on the cost of data breaches suggests the figures involved in each breached report are at an all-time high of $165. Based on the reports we’ve found so far, this equates to a cost of nearly $3.7 billion in breached records for 2023 from January to mid-November alone. This is the first time figures have exceeded $1 billion since 2018.
Ransomware in particular remains a dominant threat for government agencies. It accounts for nearly half the number of attacks carried out this year so far (63). According to the data collated by our US ransomware tracker, government agencies see average ransoms of over $920,000. Three government agencies are known to have paid up. San Bernardino County Sheriff’s Department paid $1.1 million to its hackers, the Township of Montclair paid $450,000, and Hinds County paid $300,000.
In many cases, the cost of the ransom demand is often less than the cost of trying to recover systems or safeguard stolen data.
Methodology
Using state reports, government reports, news, press releases, and industry reports, we collated all of the records of data breaches that have occurred within federal, state, county, and city government and military departments. Where possible, the figures for the breaches have been assigned to the state where records were affected. However, in some cases, the figures will be allocated to the state where the department involved is headquartered. This is due to several states often being affected and a breakdown of figures per state being unavailable.
Furthermore, there may be some instances where the breach occurred in a previous year but wasn’t brought to the attention of the authorities until later on. Not every breach comes with a figure for the number of reports affected. It may be unknown or may be below the threshold imposed by the state. BlueLeaks was logged as one breach due to the wide range of entities affected (for which there is no exact figure). It was also logged as “US” because we cannot pinpoint it to a specific state.
Figures for previous years may have changed since our last study due to updated reports with exact breach dates.
Third-party breaches were added this year and breach types have been updated from 2018 to mid-November 2023.
Each breach was categorized into one of 25 government organization types, which are as follows:
- Animals and Food
- Board of Commissioners
- Child and Family Services
- City
- County
- Department of Corrections and Rehabilitation
- Department of Economic Opportunity
- Department of Education
- Department of Health
- Department of Human Services
- Department of Information Technology
- Department of Labor
- Department of Public Works
- Division of Elections
- Finance
- Housing Authority
- Law Enforcement
- Other
- Park District
- State
- State Bar
- Town
- Transportation Authority
- Utilities
- Veterans
A handful of breaches may appear in this study and our medical data breach study. This is due to some attacks on government entities, e.g. Department of Health, affecting medical data. Public hospitals and medical centers (aside from ones run by Veteran Affairs) aren’t included, however. There also are a few occasions where ransomware breaches may appear under Education or Healthcare in our map of worldwide ransomware attacks as they affect schools or healthcare organizations, but, as they are government businesses, they are included in this study.
Data researcher: Charlotte Bond
You can see the full list of sources used in this study here.