

There are many different metrics that can be used to measure the speed of data transfers throughout a network. Being able to tell the speed of your service provides you with a metric to measure network performance. Throughput and latency are some of the most common ways that networks are measured. Measuring the level of throughput or latency can help to identify performance issues on your network.
However, these concepts aren’t the same thing. In this article, we’re going to look at the difference between latency and throughput and how they can be used to measure what is going on. Before we do that, we’re going to define what latency and throughput are.
Latency and Throughput definitions
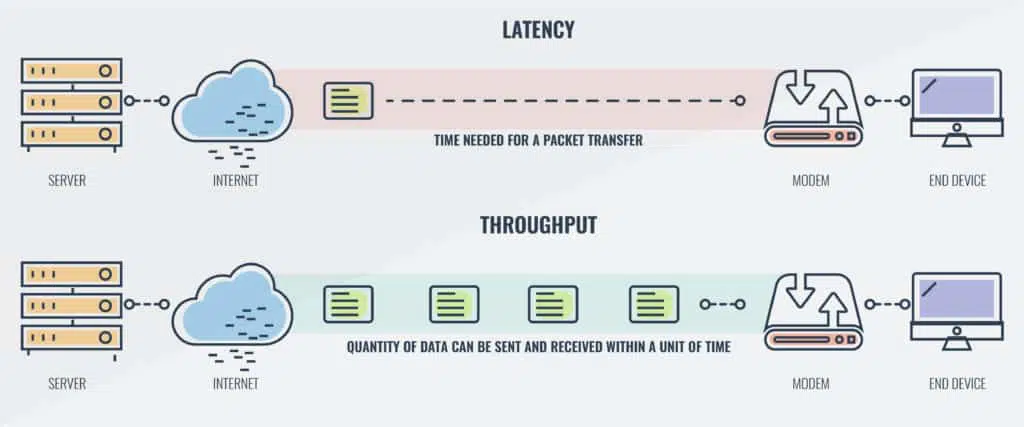
Latency – The time taken for a packet to be transferred across a network. You can measure this as one-way to its destination or as a round trip.
Throughput – The quantity of data being sent and received within a unit of time
We’re going to look at these individually in further detail below. But first, we’re going to compare the two directly.
These are the best tools for measuring network throughput and network latency:
- SolarWinds Network Bandwidth Analyzer Pack EDITOR’S CHOICE Essential network bandwidth analysis and performance monitoring tools comprising of the Network Performance Monitor and the NetFlow Traffic Analyzer. Start a 30-day free trial.
- SolarWinds Flow Tool Bundle (FREE TOOL BUNDLE) Free tool for monitoring flow traffic within the network.
- Site24x7 Network Monitoring (FREE TRIAL) Cloud-based system installs a data collection agent to map the devices on the network, monitor traffic and more.
- Paessler PRTG QoS Round Trip Sensor Analyze the quality of the network connection that communicates via two network probes.
The relationship between Throughput, Latency, and Bandwidth
The relationship between throughput and latency is underpinned by the concept of bandwidth. Bandwidth is the name given to the number of packets that can be transferred throughout the network. If you were to think of a pipe, a physical pipe restricts the quantity of content that can transfer through the pipe. In the context of a network, this is how many packets can be transferred at once.
The time it takes for a packet to travel from the source to its destination is referred to as latency. Latency indicates how long it takes for packets to reach their destination. Throughput is the term given to the number of packets that are processed within a specific period of time. Throughput and latency have a direct relationship in the way they work within a network.
Putting it another way, the relationship between these three are as follows:
- The maximum bandwidth of a network specifies the maximum number of conversations that the network can support. Conversations are exchanges of data from one point to another.
- Latency is used to measure how quickly these conversations take place. The more latency there is, the longer these conversations take to hold.
- The level of latency determines the maximum throughput of a conversation. Throughput is how much data can be transmitted within a conversation.
Naturally, the amount of data that can be transmitted in a conversation decreases the more network latency there is. This is because it takes longer for data to be transmitted within the conversation because packets take a longer time to reach their destination. Now we’re going to take a look at these concepts in further detail.
Related post: The difference between Throughput and Bandwidth
What is network latency?
First and foremost, latency is a measure of delay. This measure of delay looks at the amount of time it takes for a packet to travel from the source to its destination through a network. Generally, this is measured as a round-trip but it is often measured as a one-way journey as well. Round-trip delay is most commonly used because computers often wait for acknowledgments to be sent back from the destination device before sending through the entirety of the data (this verifies that there is a connection to send the data to).
As a consequence, the presence of latency indicates that a network is performing slowly. The higher the amount of delay the longer it takes for a packet to reach its destination. This results in services that are slow and choppy. For example, if you were typing something into a remote device there could be a couple of seconds of delay before what you’ve typed shows up on the screen.
Latency vs Bandwidth
Latency and bandwidth are two very different concepts that have a close relationship with each other. Latency measures the speed of packet transfers whereas bandwidth is used to refer to the maximum capacity of the network. The simplest way to explain the relationship between the two is that bandwidth refers to how big the pipe is, and latency is used to measure how fast the contents of the pipe travels to its destination.
These two have a cause-and-effect relationship. For instance, the less bandwidth you have the longer it will take for your data to reach its destination, and the more latency you will have. Likewise, the more bandwidth you have the faster packets will reach their destination. This is the case even if you have low latency.
What causes network latency?
Network latency can be caused by a range of issues but generally, it comes down to the state of routers and the distance between your network devices. The more routers a packet has to travel through the more latency there is because each router has to process the packet. In most cases, this latency isn’t noticeable but when traffic travels across the internet it can be more pronounced (because the number of routers the packet passes through increases).
The distance that a packet travels can also have a significant influence on the amount of latency within a network. A packet that travels around the world would have at least 250 ms of latency. In enterprise-level networks, latency is present to a lesser extent. When packets travel across a network to their destination, they rarely travel to the node in a straight line. As such the amount of latency is dependent on the route that the packet takes.
On a well-designed network, efficient routes should be available so that packets arrive promptly at their destination. If the network is poorly-designed with indirect network paths then latency is going to be much more pronounced.
What is network throughput?
As we said earlier, throughput is the term used to refer to the quantity of data being sent that a system can process within a specific time period. Throughput is a good way to measure the performance of the network connection because it tells you how many messages are arriving at their destination successfully. If the majority of messages are delivered successfully then throughput will be considered high. In contrast, a low rate of successful delivery will result in lower throughput.
The lower the throughput is, the worse the network is performing. Devices rely on successful packet delivery to communicate with each other so if packets aren’t reaching their destination the end result is going to be poor service quality. Within the context of a VoIP call, low throughput would cause the callers to have a poor quality call with audio skips.
Related post: Network throughput definition
Throughput vs Bandwidth
Bandwidth is a term used to describe the maximum amount of data that can be transferred throughout your network. The maximum bandwidth of your network is limited to the standard of your internet connection and the capabilities of your network devices. Think of bandwidth as the limits of your network connection. In contrast, throughput is the actual data transfer rate that occurs on your network.
It goes without saying that throughput is lower than bandwidth. That is because bandwidth represents the maximum capabilities of your network rather than the actual transfer rate. This is most important to note during peak periods or when performance issues are rampant as throughput will often be lower than bandwidth.
What causes poor network throughput?
Poor network throughput can be caused by several factors. One of the main culprits is poor hardware performance. If devices like routers are experiencing performance degradation, faults, or are simply outdated then you can end up with low throughput. Likewise, if computer networks are congested with lots of traffic then packet loss will occur. Packet loss is where data packets are lost in transit. Low network throughput is often caused when packets are lost in transit.
How to measure latency and throughput
Latency is one of the most reliable ways to measure the speed of your network. Latency is measured in milliseconds. In the event that you want to measure the amount of data traveling from one point to another, you would use network throughput. Throughput is measured in bits per second (bps) in the form of megabits per second (Mbps) or gigabits per second (Gbps). Throughput is the rate at which packets reach their destination successfully within a specific time period. While you can calculate throughput numbers, it is simpler to measure it with bps rather than running a calculation.
Why are network latency and throughput important?
Both network latency and throughput are important because they have an effect on how well your network is performing. If latency is too high then packets will take a longer amount of time to reach their destination. The more time it takes for packets to reach their destination, the slower devices, services, and applications will operate within the network. Likewise, the lower the amount of throughput, the lower the number of packets being processed in a specific time period.
The moment latency gets too high or throughput falls, then your network is going to grind to a halt. This is the point at which services will start to perform sluggishly as packets fail to reach their destination at a speed that can sustain the full operation of your network.
It is important to measure network latency and throughput because it allows you to check that your network isn’t falling victim to poor performance. There are many ways that you can measure latency and throughput but the simplest way is to use a network monitoring tool. This type of tool will be able to tell you when latency and throughput have reached problematic levels.
Tools for measuring network throughput
Our methodology for selecting tools to measure throughput and latency
We reviewed the market for bandwidth monitoring software and analyzed the options based on the following criteria:
- The ability to communicate with switches and routers through packet flow protocols, such as NetFlow and sFlow
- A device health tracker based on SNMP
- Packet capture or sampling options
- A protocol analyzer to segment traffic volumes by application
- Analysis utilities
- An assessment period provided by a free trial or a money-back guarantee
- Value for money represented by tools that will repay their cost
SolarWinds Network Bandwidth Analyzer Pack (FREE TRIAL)
Given the effects of network throughput on your network performance, it is important to monitor for it. To do this you need a network monitoring tool. There are many different tools you can use, but one of the best is SolarWinds Network Bandwidth Analyzer Pack. This solution can measure network throughput to monitor the flow data of throughput alongside the availability of network devices.
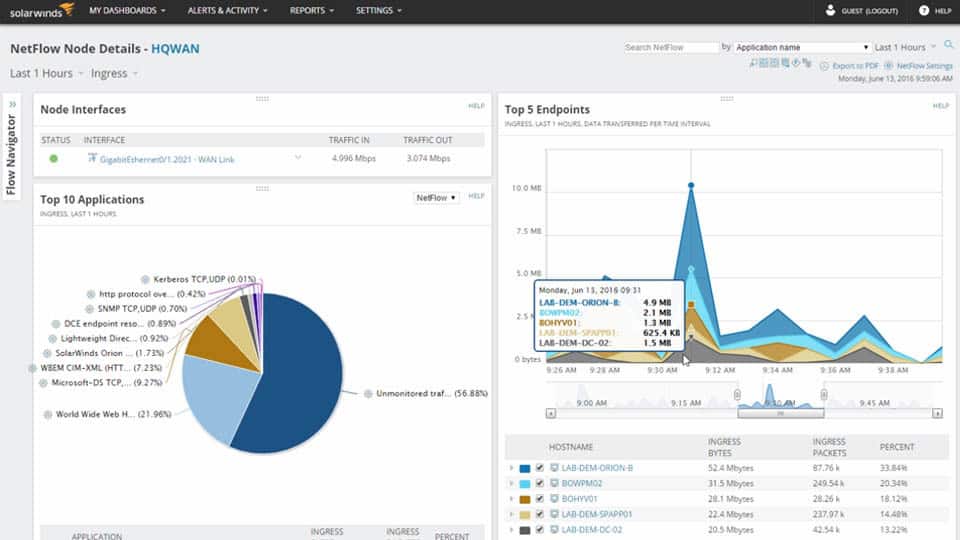
SolarWinds Network Bandwidth Analyzer Pack is a good choice for addressing network throughput because it helps you to point to the root cause. You can detect performance issues within your network and take steps to address them so that throughput stays high.
This package is a bundle of two SolarWinds tools: the Network Performance analyzer and the NetFlow Traffic Analyzer. This is a very useful combination of services for latency and throughput management because the first of these systems watches the activities of network devices and the second tracks traffic flows.
Key Features:
- Network device monitoring
- Traffic analysis
- Traffic shaping assistance
- SNMP feedback
- Packet analysis
Why do we recommend it?
The SolarWinds Network Bandwidth Analyzer Pack includes the Network Performance Monitor and the NetFlow Traffic Analyzer tools from SolarWinds. The Network Performance Monitor concentrates on tracking device issues and the NetFlow Traffic Analyzer deals with issues such as traffic throughput rates and congestion. Combining these two tools gives you a number of extra services, such as NetPath, which enables you to test a connection end-to-end across a network. All of the functions in this pack can have thresholds placed on the statistics that they produce. If data crosses these levels, you receive an alert.
Operational network monitoring is automated because both SolarWinds tools include an alerting system. Performance thresholds, such as throughput or latency expectations trigger alerts if they are crossed. These alerts draw technicians back to the monitoring console, so you can assume that everything on the network is working fine unless you get a notification.
These two SolarWinds tools combine to provide path analysis in a system called NetPath. This lets you look at traffic between two given points. It is a visual traceroute but it gives you bandwidth capacity and utilization data for each link in the path. The visual representation of the entire route is very helpful in promoting problem recognition and it can also help you to identify bottlenecks and problematic devices.
Who is it recommended for?
The pack is a good choice for busy network administrators because it provides automated network monitoring, freeing up the administrator’s time for other tasks. The Bundle also offers tools for troubleshooting and problem resolution. This is an on-premises package and it is only available for Windows Server.
Pros:
- Covers all aspects of network monitoring
- Identifies bottlenecks and overloaded links
- Records issues such as packet loss and capacity limits
- Offers path analysis tools
- Implements traffic shaping
Cons:
- Not available as a cloud service
The Network Bandwidth Analyzer Pack is a software bundle that installs on Windows Server. You can take advantage of their 30-day free trial.
EDITOR'S CHOICE
The SolarWinds Network Bandwidth Analyzer Pack is superb for diagnosing and detecting network performance issues. The UI makes it easy to narrow down bandwidth hogging culprits and general traffic patterns, even down to hop-by-hop granularity when needed.
Download: Start 30-day Free Trial
Official Site: https://www.solarwinds.com/network-bandwidth-analyzer-pack/registration
OS: Windows Server 2016 or later
SolarWinds Flow Tool Bundle (FREE TOOL BUNDLE)
The SolarWinds Flow Tool Bundle includes three simple, but powerful facilities:
- NetFlow Configurator
- NetFlow Replicator
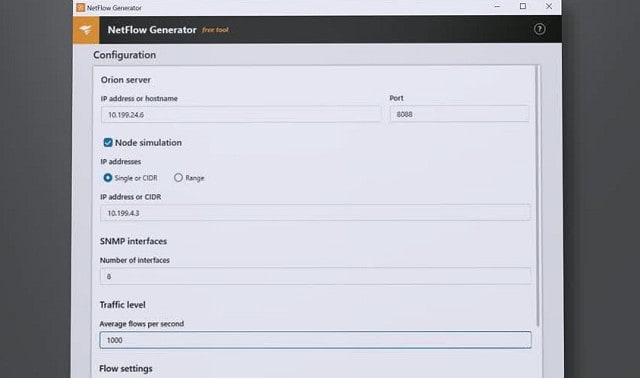
- NetFlow Generator
You don’t get any impressive graphical data representations with these three utilities. Instead, you get straightforward interfaces that will help you utilize the NetFlow v5 messages that your Cisco routers generate. NetFlow is a network protocol developed by Cisco that collects packet information as it passes through the router.
You can use the NetFlow Configurator in the Flow Tool Bundle as a standard interface that contacts a given Cisco router and sets up its NetFlow functions to send data to your collector.
Key Features:
- Three free tools
- Front-end for router setup
- Router testing utilities
- Traffic emulation
Why do we recommend it?
If you access the free trial of the SolarWinds Network Bandwidth Analyzer Pack, liked it, but don’t want to buy it, you should opt for the SolarWinds Flow Tool Bundle. This is a free package that is an alternative to the more comprehensive paid package of tools. There are not nearly as many utilities in the free option but it does include NatPath, which enables you to measure latency and throughput.
The other two utilities in the bundle help you test the network and plan for increases in demand by using NetFlow analysis.
The NetFlow Replicator will send NetFlow packets to given destinations on your network. This enables you to study the capabilities of your infrastructure and helps you identify bottlenecks. The NetFlow Generator creates extra traffic for your network. This allows you to test the behavior of load balancers, firewalls, and network performance monitoring alerts.
Who is it recommended for?
SolarWinds Flow Tool Bundle is a good option for network administrators, working in small businesses, that just don’t have the budget to buy the full, paid SolarWinds package.
Pros:
- Runs on Windows
- Assists with traffic capacity testing
- Manages router settings
- Generates traffic
Cons:
- No version for Linux
The Flow Tool Bundle is a great free utility that gives you the ability to gain insights into the readiness of your network for expansions in services and demand.
Tools for measuring network latency
Site24x7 Network Monitoring
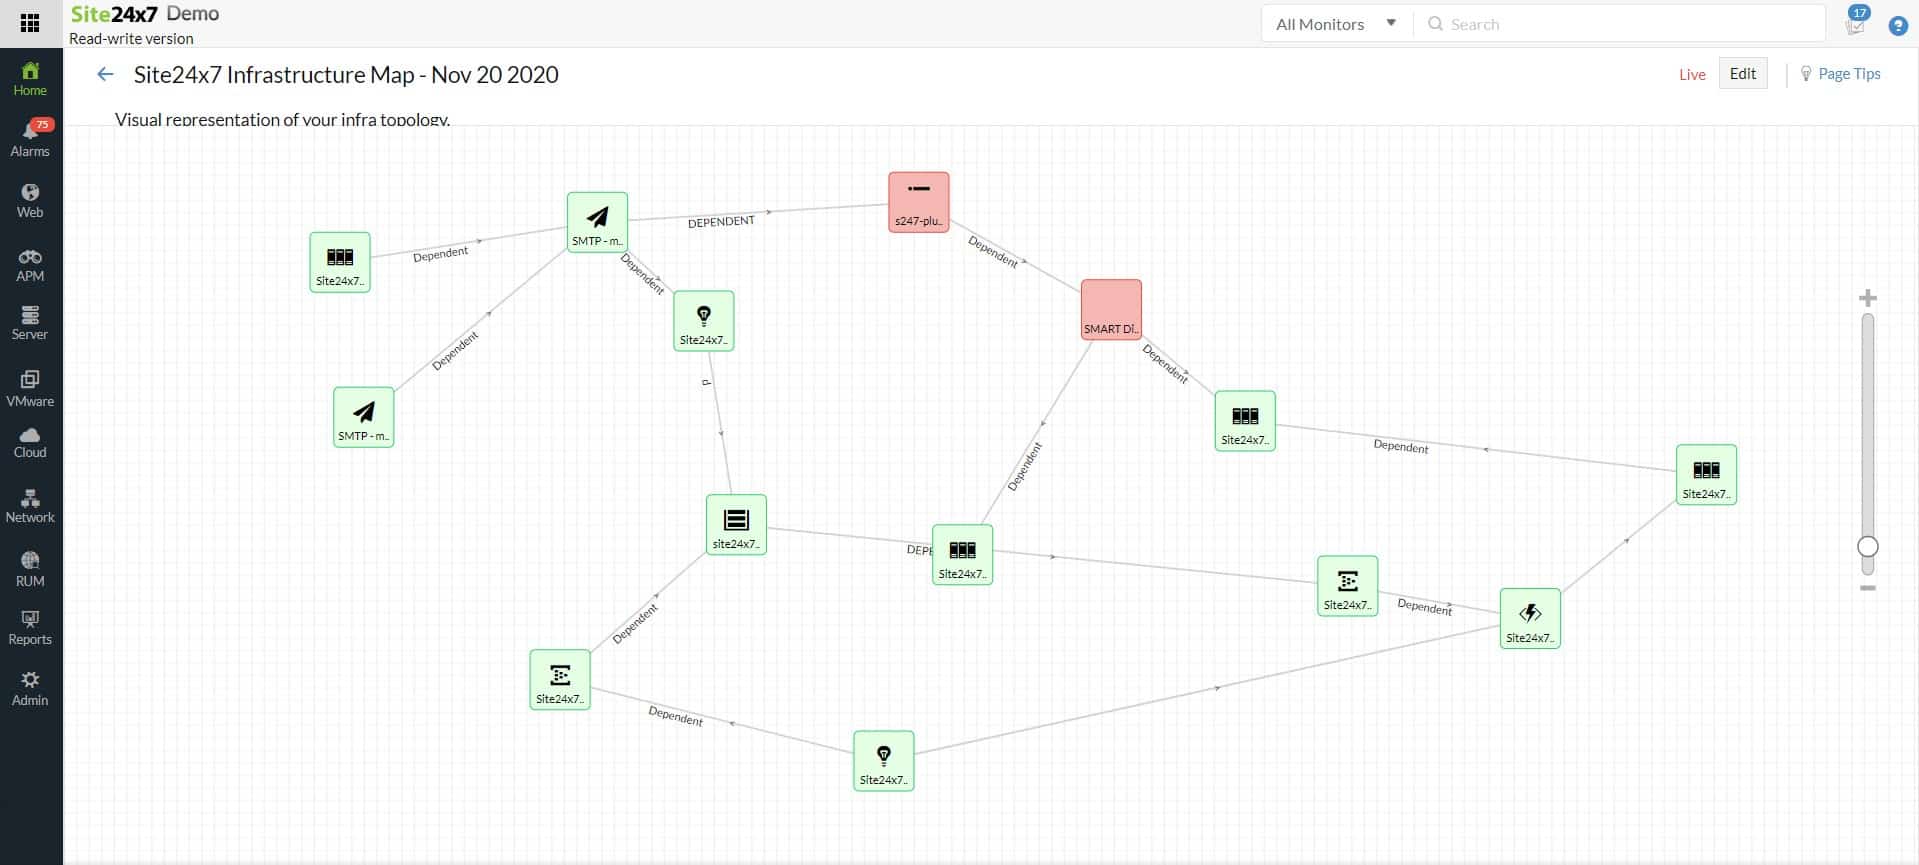
Site24x7 Network Monitoring is a cloud-based system that monitors a network by installing a data collection agent on one of its connected computers. This system detects all connected devices and creates a network inventory and topology map. The package also provides traffic tracking systems.
The console of the package displays the network and indicates the status of each device. It uses SNMP for device status monitoring and flow protocols for traffic tracking. The system can communicate with switches and routers using the NetFlow, IPFIX, sFlow, J-Flow, cFlow, AppFlow, and NetStream protocols.
Key Features:
- Network discovery
- Traffic tracking
- Network testing
Why do we recommend it?
Site24x7 Network Monitoring includes automated monitoring services and a menu of network troubleshooting tools. The package includes Ping and Traceroute tools to check on the typical journey of packets on specific routes. So, the monitoring system discovers problems and then the testing tools let you investigate those issues.
Both the network device status monitoring service and the traffic tracking system include performance expectation thresholds. These will trigger alerts if problems arise. Alerts appear in the dashboard for the Site24x7 system and can be forwarded to technicians by SMS, voice call, email, or Slack message.
The Site24x7 system saves time because it sets itself up and its alerts mean that technicians can assume that everything is running well unless they are notified otherwise. This enables support teams to get on with other tasks rather than sitting and watching the network monitoring console.
Who is it recommended for?
This package is a good choice for any business that runs a network. Traffic problems are detected quickly and the device status tracking could identify a reason for traffic flow problems very quickly. If no issue is immediately apparent, the troubleshooting tools in the package help with manual investigations.
Pros:
- Spots equipment failure
- Compares traffic volumes to full device capacity
- Identifies traffic pace irregularities
Cons:
- No on-premises version
Get started by registering for a 30-day free trial.
Paessler PRTG QoS Round Trip Sensor
Keeping track of the presence of latency helps you to measure the standard of your data connection and to identify that your service is performing well without any traffic bottlenecks. Paessler PRTG Network Monitor has a range of network latency monitoring features that make it ideal for this task. With PRTG Network Monitor you can monitor the bandwidth of your network to see the strength of your connection.
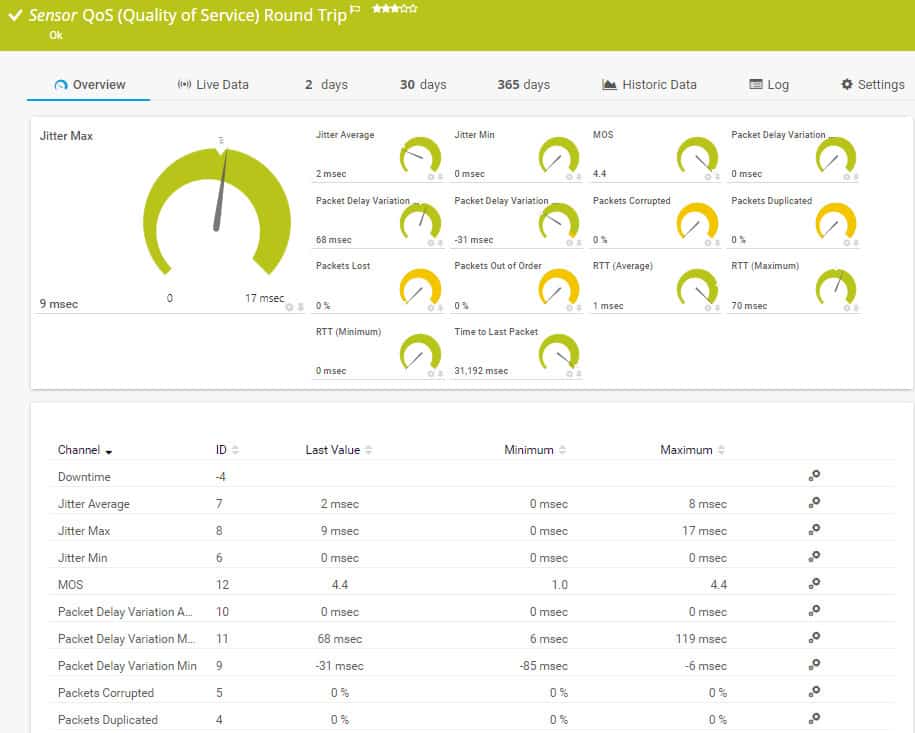
PRTG’s QoS Round Trip Sensor is one of many monitoring tools in the PRTG bundle. It offers a list of network transfer statistics, including the latency on a link and the jitter experienced in packet arrival rates.
Other factors that you can see with this sensor include packet loss, packets out of sequence, device downtime, duplicate packets, corrupted packets, re-transmissions, and Mean Opinion Score (MOS). This single sensor packs in a lot of data about network traffic behavior and there are many other tools that you can access in the PRTG package to fully monitor network performance.
Why do we recommend it?
The Paessler PRTG QoS Round Trip Sensor is one of the tools in a large bundle of monitors and you can get this system for free if you only activate 100 sensors. The QoS measurement sensor provides a lot of data, which is heavily focused on jitter. You get both the roundtrip time (RTT) and the time to last packet which help you calculate latency. Another monitor in the package called the HTTP Advanced Sensor will give you throughput data.
The PRTG system includes a series of performance thresholds out-of-the-box that you can choose to adjust. These track issues such as latency and throughput and they will trigger alerts if performance reaches unacceptable levels.
Other features in the PRTG package include device status monitoring with SNMP and traffic flow querying protocols, such as NetFlow, IPFIX, sFlow, and J-Flow. The package has an autodiscovery function that automatically creates an asset inventory and draws up a network topology map. You can query any individual device or link for traffic statistics by clicking on an entry in the inventory or an icon in the network map.
Who is it recommended for?
Any network administrator would benefit from having PRTG for all-around network monitoring, not just for latency and throughput tracking. This system includes autodiscovery of network devices, network mapping, and constant device health checks through SNMP.
Pros:
- Traffic tracking metrics
- Alerts for performance impairment
- Latency and throughput statistics
Cons:
- No network management tools, only monitoring
PRTG is a software package that runs on Windows Server and it is available for a 30-day free trial.
Network throughput network baselines
One of the most important pieces of information you need to know when measuring network throughput is your network baseline. Network baselining is where you measure the performance of your network in real-time. In other words, network baselining is about testing the strength of your live connections. Network baselining is where you monitor your network router traffic to identify trends, view resource allocation, view historic performance, and identify performance anomalies. Baselining your network provides you with a frame of reference for you to call upon when monitoring your network’s performance.
For monitoring your network throughput, you would want to keep track of factors like resource utilization and network traffic to see how well the network is performing. Setting up network baselines can be as simple or as complex as you want them to be. The first steps are to draw up a network diagram to map your network and to define a network management policy. The network diagram provides you with a roadmap to your devices and the policy determines which services are permitted to run on your network.
Site24x7 packages all of its monitoring and management tools in plans, so you get server and application monitoring services included in the network monitoring system. You can investigate the Site24x7 platform with a 30-day free trial.
How to reduce latency and throughput
If you’ve established that latency and throughput are a problem in your network then there are some steps you can take to eliminate the problem.
Monitor endpoints
One way to limit network latency is to start monitoring your endpoints. Endpoints are a source of latency because they can be used to run bandwidth-intensive applications. These bandwidth hogs or top talkers take up network resources and increase latency for other key services. Monitoring these endpoints with a tool like SolarWinds Network Performance Monitor or Paessler PRTG Network Monitor allows you to make sure that it isn’t rogue applications causing your latency problems.
Look for network bottlenecks
Sometimes the cause of latency comes down to network bottlenecks. A network bottleneck occurs when the flow of packets is restricted by network resources. There are a number of different ways to resolve bottlenecks but one is improving your LAN design. Segmenting your network into VLANs can help to improve performance. You also want to make sure that server network cards can run at a higher speed than nodes within your network.
Restart your hardware
Restarting your hardware when facing performance issues is troubleshooting 101. Restarting your router clears the cache so that it can start running like it was in the past. This can also be applied to your computers as well. While this seems like a simple solution you’d be surprised how many performance issues can be resolved by implementing these basic steps.
Monitor throughput and latency for QoS
Monitoring your latency and throughput is the only way to make sure that your network is performing to a high standard. If there’s both a high latency connection and low throughput then your available bandwidth is being put to poor use. The sooner you know about it the sooner you can take action and start troubleshooting. Without a network monitoring solution, it’s going to be much harder to keep track of these entities. Failure to keep track of these will result in poor network performance.
The moment you see that there’s the presence of latency for instance, you know that packets are taking too long to reach their destination. This can lead to throughput which limits the number of packets that can be sent during a conversation. This means it is time to start troubleshooting for the cause of latency and throughput.
After monitoring your network conditions you can then look for various fixes in your network to see if the problem is eliminated. If the problem persists then you simply continue until you find the root cause. Once you’ve finished troubleshooting you should have found the origin of the problem and fixed it. By having clear metrics to act on from a network monitor you can maintain your performance as soon as possible.
See also: What is QOS?
Latency vs Throughput FAQs
How to increase throughput capacity in a network?
Throughput is a function of network capacity. So, the only way to truly increase throughput is to increase capacity through investing in new infrastructure. It is possible to give the appearance of improved throughput speeds by prioritizing time-sensitive traffic, such as VoIP or interactive video.
How to measure application latency?
There are two options when measuring application latency:
- Round-trip time (RTT), which is the time it takes a packet to get to an address and then return. This only requires monitoring software to be installed at one point on the network.
- Time to first byte (TTFB) the time it takes a packet to reach an address. This requires monitoring software to be active at both the start and finish point of the test route.
Can hardware limitations increase latency or throughput?
Hardware capacity is the biggest limitation on throughput. An overloaded switch or router will queue traffic in order to buy time. This slows down the delivery time of all traffic passing through that device. The bandwidth of the cable used on a network also imposes a limit on the amount of traffic that can circulate at optimum speed.
How to solve throughput issues with capacity planning?
The future requirements for network capacity should be easy to predict. All traffic will increase over time, so just spotting a trend rate of growth will enable you to spot when current infrastructure capacity will be exhausted. This gives you time to plan the acquisition of more infrastructure. Another point at which capacity planning is required is when the organization plans to add on users or new applications, increasing demand on the network.
Should I measure latency using ping or ipref?
- ping is the classic tool for measuring latency because it gives the round-0trip time in its summary report.
- The iperf utility is good for measuring throughput because it measures the network’s packet transfer rate.
What is the difference between lag, latency and ping?
Ping is a utility that sends a packet to a given destination, expecting it to be instantly bounced back. Latency is the time that packet takes to go there and back. Lag is a period of delay. So, ping a node to find the latency and estimate what lag will be encountered on the network between your computer and the computer at the address you pinged.
What is the difference between network delay and network latency?
In common parlance, delay and latency mean the same thing. However, the strict meanings of the terms are that network delay is the time the first bit in a packet takes to get from A to B, whereas latency is the time it takes for the entire message to arrive at the destination. Some factors, such as packet fragmentation will increase latency without increasing delay.
What is latency-sensitive data?
Latency sensitive data is any information that needs to arrive in a timely manner, otherwise the users would notice the delay. For example, a delay on a voice signal for a VoIP call would be noticeable to the user. If an email took a second longer to arrive, no one would notice. The VoIP transmission is latency-sensitive, the email is not.

