

As your organization grows, so does the number of servers, devices, and services you depend on. The term “system” covers all of the computing resources of your organization. Each element in the system infrastructure relies on underlying services or provides services to components that are closer to the user
Here is our list of the best system monitoring software & tools:
- NinjaOne EDITOR’S CHOICE This cloud-hosted SaaS platform automatically creates system documentation and implements continuing monitoring. It also provides endpoint management automation tools, such as a patch manager. Get a 14-day free trial.
- SuperOps RMM (FREE TRIAL) A SaaS platform that provides remote monitoring and management tools for MSPs to supervise the networks of their clients. Start a 14-day free trial.
- ManageEngine Applications Manager (FREE TRIAL) Monitors on-premises applications, virtual infrastructure, and cloud systems with live performance tracking and root cause analysis functions. Available for Windows Server and Linux. Get a 30-day free trial.
- Site24x7 Server Monitoring (FREE TRIAL) Cloud-based monitoring service that tracks the performance of networks, servers, applications, and Websites.
- ManageEngine OpManager Nexus (FREE TRIAL) A unified system monitoring platform that provides visibility into your system components for quick troubleshooting. Start a 30-day free trial.
- SolarWinds Server & Application Monitor Comprehensive monitoring system that includes a drill-down view of all of the resources and services that support each application.
- Sematext Infrastructure Monitoring This package of system monitoring services supervises the performance of networks, servers, containers, cloud platforms, and applications. Get it as a SaaS package or run it over Docker.
- Paessler PRTG Network Monitor Covers networks, bandwidth usage, servers, and applications. This tool is free for up to 100 sensors.
- Atera An IT infrastructure monitoring and management system that is delivered from the cloud and intended for use by MSPs.
- N-able N-sight A remote monitoring and management tool that enables central IT departments to manage IT resources on several remote sites.
- Nagios XI and Nagios Core – Nagios XI is a paid monitor and Nagios Core is free. Both can be extended by thousands of add-ons that are available from the user community forum.
In networking, it is typical to think of a system as a layered stack. User software sits at the top of the stack and system applications and services on the next layer down. Beneath the services and applications, you will encounter operating systems and firmware. The performance of software elements needs to be monitored as an application stack.
Users will notice performance problems with the software that they use, but those problems rarely arise within that software. All layers of the application stack need to be examined to find the root cause of performance issues. You need to head off problems with real-time status monitoring before they occur. Monitoring tools help you spot errors and service failures before they start to impact users.
The system stack continues on below the software. Hardware issues can be prevented through hardware monitoring. You will need to monitor servers, network devices, interface performance, and network link capacity. You need to monitor many different types of interacting system elements to keep your IT services running smoothly. Here we’ll look at six sophisticated system monitoring packages for Windows and Linux.
Why do system performance monitoring?
Knowing whether a computer has issues is fairly straightforward when the computer is right in front of you. (Knowing what’s causing the problem? That’s harder.)
But a computer sitting by itself is not as useful as it could be. Even the smallest small-office/home-office network has multiple nodes: laptops, desktops, tablets, WiFi access points, internet gateway, smartphones, file servers and/or media servers, printers, and so on. That means you are in charge of “infrastructure” rather than just “equipment.” Any component might start misbehaving and could cause issues for the others.
You most likely rely on off-premises servers and services, too. Even a personal website raises the nagging question, “Is my site still up?” And when your ISP has problems, your local network’s usefulness suffers. You need an activity monitor. Organizations rely more and more on servers and services hosted in the cloud: SaaS applications (email, office apps, business packages, etc); file storage; cloud hosting for your own databases and apps; and so on. This requires sophisticated monitoring capabilities that can handle hybrid environments.
Bandwidth monitoring tools and NetFlow and sFlow based traffic analyzers help you stay aware of the activity, capacity, and health of your network. They allow you to watch traffic as it flows through routers and switches, or arrives at and leaves hosts.
But what of the hosts on your network, their hardware, and the services and applications running there? Monitoring the activity, capacity, and health of hosts and applications is the focus of system monitoring.
System monitoring software essentials
In order to keep your system fit for purpose, your monitoring activities need to cover the following priorities:
- Acceptable delivery speeds
- Constant availability
- Preventative maintenance
- Software version monitoring and patching
- Intrusion detection
- Data integrity
- Security monitoring
- Attack mitigation
- Virus prevention and detection
Lack of funding may cause you to compromise on monitoring completeness. The expense of monitoring can be justified because of it:
- reduces user/customer support costs
- prevents loss of income caused by system outages or attack vulnerability
- prevents data leakage leading to litigation
- prevents hardware damage and loss of business-critical data
Expense on system monitoring reduces costs in other areas of the IT budget.
Read more: How to CPU Benchmark Test
Some basic system monitoring software tools
Anyone who’s curious about their workstation or laptop’s performance has likely encountered Windows Task Manager or Linux’s ps and top. (The more experienced know of Sysinternals on Windows and htop, atop, pgrep, and pstree on Linux.)
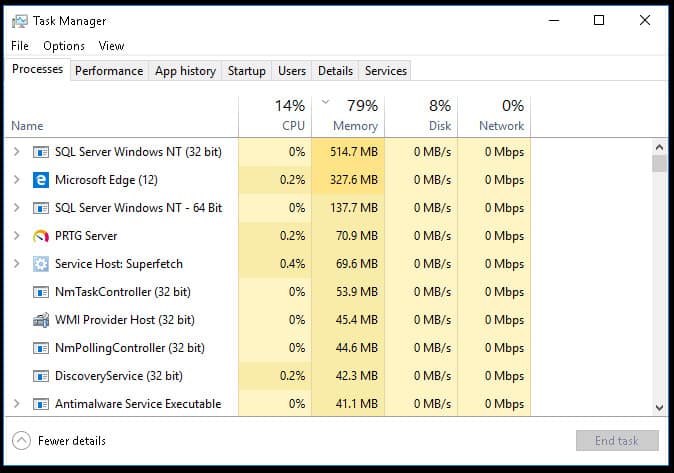
Task Manager is a good example of the basic activity monitoring information you can learn about a host, starting with what processes are running and which currently consume the most resources.
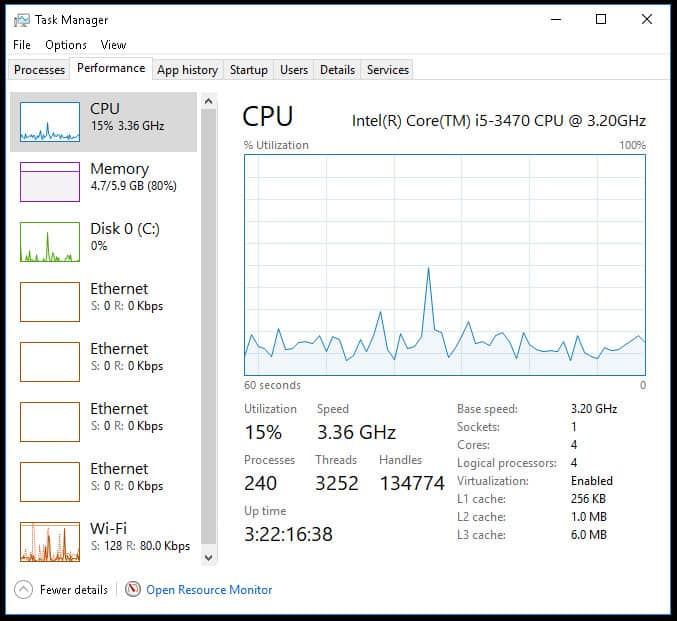
Climb up a level and it will show you current and recent utilization for key resources like CPU, memory, disk, and network connections. Other tabs will show you more details on running processes, operating system services, and other key data.

Unix and Linux have analogous tools, like top.
Task Manager and top provide a continuously updating display of utilization. These simple real-time monitoring utilities are good for basic ad hoc monitoring of a single machine, to see what’s running and what’s consuming the system’s resources.
Minimum system monitoring software capabilities
A more sophisticated system monitoring package provides a much broader range of capabilities, such as:
- Monitoring multiple servers. Handling servers from various vendors running various operating systems. Monitoring servers at multiple sites and in cloud environments.
- Monitoring a range of server metrics: availability, CPU usage, memory usage, disk space, response time, and upload/download rates. Monitoring CPU temperature and power supply voltages.
- Monitoring applications. Using deep knowledge of common applications and services to monitor key server processes, including web servers, database servers, and application stacks.
- Automatically alerting you of problems, such as servers or network devices that are overloaded or down, or worrisome trends. Customized alerts that can use multiple methods to contact you – email, SMS text messages, pager, etc.
- Triggering actions in response to alerts, to handle certain classes of problems automatically.
- Collecting historical data about server and device health and behavior.
- Displaying data. Crunching the data and analyzing trends to display illuminating visualizations of the data.
- Reports. Besides displays, generating useful predefined reports that help with tasks like forecasting capacity, optimizing resource usage, and predicting needs for maintenance and upgrades.
- Customizable reporting. A facility to help you create custom reports.
- Easy configurability, using methods like auto-discovery and knowledge of server and application types.
- Non-intrusive: imposing a low overhead on your production machines and services. Making smart use of agents to offload monitoring where appropriate.
- Scalability: Able to grow with your business, from a small or medium business (SMB) to a large enterprise.
The best system monitoring software & tools
Our methodology for selecting system monitoring tools
We reviewed the market for system monitoring software and analyzed the options based on the following criteria:
- A package that combines network server, and application monitoring
- Options for remote system monitoring
- Nice to have utilities that can be used by managed service provider technicians as well as inhouse IT departments
- Options to monitor cloud resources and internet-based assets, such as websites
- Network discovery and automated software inventory compilation
- A free trial for a cost-free assessment period or a money-back guarantee
- A good price for a full set of tools that provide all monitoring needs
- Ease of installation and use, including the availability of documentation, community forums, and support
- Commitment to continual updates, improvements, and ongoing maintenance.
- Real-world problem-solving applicability and a robust feature set.
1. NinjaOne (FREE TRIAL)
NinjaOne – formerly NinjaRMM – is a SaaS package that offers a bundle of remote monitoring and management services. This is a product that was designed for managed service providers (MSPs) so it can monitor multiple sites and multiple business systems simultaneously. The service enables the complete separation of client system information. While it is a good tool for MSPs, the system can also be used by IT Operations departments that have multiple sites to manage.
Key Features:
- Endpoint Task Automation: The tool has task automation, so you don’t need technical or manual help to install, set up, patch, or maintain.
- Auto Remediation: Users can deploy condition-based scripts to automatically detect missing applications, missed reboots, or any other stopper services on the network.
- Form-Based Script Deployment: Don’t worry if you are not good with coding. You can create scripts using easy scripting languages for deployment.
- Flexible Reporting: Users can easily get reports of all the devices. Data can be further added, arranged according to characteristics, and filtered according to view preference.
- Multi-Platform Support: Manages devices across various operating systems, including Windows, Mac, Linux, SNMP, and VMware.
Why do we recommend it?
NinjaOne is another cloud platform that provides remote monitoring and management (RMM) services. The SaaS package provides technician tools and also includes a ticketing system for incident and team management. The system includes a high degree of automation, which includes software deployment and patch management. Monitoring include an autodiscovery service.
The service will scan the network of an enrolled system and log all connected devices. It then installs agents on endpoints and scans for software. The package includes network, endpoint, and software monitoring services. Tools within the service facilitate manual tasks but most of the system aims for completely automated monitoring and management processes. The advantage of NinjaOne is that it can squeeze as much value as possible out of each qualified technician working for the MSP.

An unusual feature of this RMM package is that it includes a ticketing system. This is a service that is usually included in professional services automation (PSA) bundles rather than RMMs. The ticketing system is a classic utility for Help Desk services. However, the NinjaRMM ticketing system can be used to manage the entire technician team.
An example of how the ticketing system operates lies with the performance alerting system that is built into the monitoring service. When a performance issue arises, the alert is channeled through the ticketing system for the attention of a suitably experienced technician. This system maintenance work can be threaded in with Help Desk tasks, making maximum use of the technician pool’s abilities.

The dashboards of NinjaOne are available in formats for technicians and for team managers. All of the console for this service is delivered from the cloud, so it isn’t linked to your own hardware and can be accessed from anywhere through any standard Web browser. This gives you the option of running a support team that is scattered geographically.
Who is it recommended for?
Although this package was designed for use by managed service providers, there is nothing to stop in-house IT departments from using it to manage their own IT assets. The package has a long list of large organizations that currently use the platform to monitor their own systems.
Pros:
- Highly Scalable: This tool is cloud-based and highly scalable to unlimited endpoints, allowing you to manage unlimited endpoints.
- Software Management: It is an all-in-one software deployment and management package that allows you to install, uninstall, monitor software installation, check inventory, deploy, and patch applications.
- Monitor and Alerts: This tool monitors your devices in real-time and immediately notifies technicians regarding the issues so that you can take quick actions.
- Patch Management: It supports automatic patching for MacOS, Windows, Linux, and up to 200 applications. You can evaluate and check various patches in the dashboard.
- Help Desk Ticketing System: A full task and team management service is built in.
Cons:
- Frequently Asks for Multi-Factor Authentication: NinjaOne often requires Multi-Factor Authentication (MFA), even after initial login sessions. Hence, the frequent need for MFA prompted by it multiple times in a single day can frustrate users.
NinjaOne doesn’t publish a price list but you can get a quote that matches your requirements. You can register to see a demo and NinjaOne is also available to start on a 14-day free trial.
EDITOR'S CHOICE
NinjaOne is our top pick for a system monitoring tool because it offers a powerful, all-in-one solution that simplifies IT management while delivering exceptional monitoring capabilities. Designed with ease of use and efficiency in mind, NinjaOne provides IT teams with the tools they need to monitor, manage, and maintain their systems effectively, whether they are working in small businesses or large enterprises. NinjaOne’s most important feature is its real-time system monitoring, which allows administrators to track the health and performance of endpoints across their network. It provides detailed insights into CPU usage, memory utilization, disk space, and network performance, enabling proactive identification and resolution of potential issues before they escalate. NinjaOne provides a range of dashboards, which include a technician console and a supervisor’s toolbox. The package also provides a template to support the creation of a user self-service portal. That includes both a knowledgebase option and a form to raise tickets. The tool includes IT management functions, such as patch management, remote access, and automated scripting. These allow IT teams to handle a wide range of tasks from a single platform. This integration not only streamlines workflows but also improves overall efficiency. NinjaOne’s cloud-based architecture ensures that teams can monitor systems remotely, making it an ideal solution for modern distributed workforces. Strong security measures safeguard sensitive data, ensuring compliance with industry standards.
Download: Access the 14-day FREE Trial
Official Site: https://www.ninjaone.com/freetrialform/
OS: Cloud-based
2. SuperOps RMM (FREE TRIAL)
SuperOps RMM is a cloud package of tools that support MSPs in their task of watching over the systems of clients. This bundle includes functions to monitor networks and endpoints and also supplies system management utilities.
Key Features:
- Automation: as it includes automation, you don’t need a technician for manual work. It handles assigning ticket payments, fixing routine issues, managing repetitive tasks, and more.
- Network Monitoring: You don’t need any training or implementation. The tool has a network monitoring feature that automatically scans networks for you, manages the added device, and reduces clutter across the network.
- Asset Management: It gives clear visibility into assets, remote background tools, and other modules to manage remote tasks and fix issues hassle-free.
- Intelligent Alerting: The intelligent alerting feature allows you to fully understand the client’s device, including how it’s performing and any issues that may be occurring.
- Patch Management: for advanced security, you can deploy patches and test patches to ensure productive performance.
Why do we recommend it?
SuperOps RMM is a rival to the Atera system. The package is delivered from the cloud on SaaS plans and is intended for use by MSPs the system modules offer Asset Management, Policy Management, Patch Management, and Alert Management. The system creates a productivity level of 150 endpoints per technician.
The monitoring features of SuperOps RMM offer automated network and endpoint status and performance tracking. It places thresholds of expected performance that trigger alerts if resource usage rises above an acceptable level. These alerts allow technicians to get on with other tasks, knowing that they will be drawn back to the monitoring console in time to take action should problems arise.

The RMM service includes a discovery module that polls an enrolled network for connected devices. This compiles an asset inventory and repeats in order to spot any system changes. The discovery service also logs operating system versions and installed software packages. This software inventory forms the basis for a patch management service.

An accompanying PSA package includes Service Desk features with a tasks routing system that can also be used to schedule technician time for maintenance jobs. The time that MSP staff spend on monitoring and management tasks for each client can be automatic ally fed through to a billing system.

All activity is logged, including those actions implemented manually and by automated processes. Many maintenance functions can be set up on schedules and it is possible to nominate a calendar of maintenance windows that can be used by automated processes, such as the Patch Management module to ensure that system management tasks don’t interfere with system availability.
Who is it recommended for?
The SuperOps system is suitable for managed service providers of all sizes because it is charged on a per-technician subscription. There are four plants and one of them is PSA-only, which means that you could use SuperOps to provide a team and incident management system and a different package for RMM tools.
Pros:
- Service Desk: It has a user-friendly and supportive service desk to handle tickets, collaborate with clients regarding workflow, and keep updated with system issues and other necessary information.
- Client Management: Client management features help you track SLAs, send quotes, manage invoices, audit work logs, and perform other tasks.
- Contract Management: It has a contract template that is easy to create and has various fields, such as hardware purchases, fixed payments, and more. You can customize it according to your contract needs.
- Automate Sourcing and Deployment: Users can deploy patches according to their schedule needs and patch type and help clients configure and reboot the system.
Cons:
- Need a Smooth Onboarding Process: Users faced a little bit of an issue with the onboarding process after the free trial expired. Hence, it would be great if there was a direct way to purchase the software after the trial expires.
The combination of RMM and PSA functions in a typical SuperOps plan means that the MSP gets all of the software it needs from this SaaS platform. There are four plans available and three of them include the system monitoring functions of the RMM bundle. You can access any of the plans on a 14-day free trial.
3. ManageEngine Applications Manager (FREE TRIAL)
ManageEngine produces a suite of system monitoring tools and its Applications Manager tracks the performance of a range of system resources from on-premises software, to Web services, cloud infrastructure, and virtual systems.
Key Features:
- Application Monitoring: Applications Manager keeps an eye on all your applications, whether they’re web-based, cloud-based, or on-premises. It constantly checks their performance and availability.
- Server Monitoring: It doesn’t stop at applications; it also monitors the servers that host these applications. This means it watches over your hardware, making sure everything runs smoothly.
- Database Monitoring: Databases are crucial for most applications. Applications Manager makes sure your databases are healthy and responsive, preventing any bottlenecks or downtimes.
- End-User Monitoring: This feature lets you see your application from the user’s perspective. You’ll know if your users are facing any issues, and you can address them before they become bigger problems.
Why do we recommend it?
ManageEngine Applications Manager is a similar system to the SolarWinds Server & Application Monitor. The package includes a discovery service that identifies all of the applications and services used by the business and produces an applications dependency map, which provides rapid root cause analysis when problems arise.
The on-site applications monitoring service is able to trace application dependencies, creating an application dependency map. This is a very useful service that enables the system to track through supporting services and identify the root cause of any performance issues that appear in user-facing software. The type of services that are included in this monitoring system are databases, mail servers, and Web servers.

The Applications Manager has a section of website performance monitoring services, which include availability and response time monitoring and synthetic monitoring, which runs tests on the interactive elements in Web pages.

Other functions in the Applications Manager allow the monitoring of virtualization systems. It is able to monitor VMWare, Hyper-V, Citrix, Red Hat Virtualization, and Kernel-based Virtual Machine. The system also has processes for monitoring container services, such as Docker. This service will show live statuses of servers and VMs and also recent activity.

All of the monitoring services in the Applications Manager include performance thresholds and if these get crossed, the system generates alerts. Those alerts can be set up to forward notifications to technicians by email or SMS message.
Who is it recommended for?
Like SolarWinds, Manage Engine produces a range of system monitoring tools and if you buy several of them, they can all be accessed through a single console. You can add on OpManager to get network monitoring as well. This software package will run on Windows Server, Linux, AWS, and Azure.
Pros:
- Performance Management: Applications Manager collects information about how your applications and servers are operating. This information allows you to enhance speed and improve user experience.
- Customizable Alerts: You do not have to sit and watch Applications Manager all day. This tool notifies you when something goes wrong so you can immediately act before it worsens.
- Root Cause Analysis: it identifies the root cause which helps you to figure out why something happened. Hence, you can fix the underlying problem instead of just treating the symptoms.
- Reports and Dashboards: It delivers simple statistical reports on dashboards to give you a complete view of how your system’s health and performance have changed over time.
Cons:
- User-Interface and Responsiveness Issue: Recently, some users have faced unresponsive software and poor user interface while loading critical IT issues.
ManageEngine Applications Manager is implemented as on-premises software that installs on Windows Server or Linux. It is packaged in three editions: Free, Professional, and Enterprise. The Free edition is limited to five running monitors. The Professional edition includes most of the infrastructure monitors of the tool with a few specialist services, such as distributed tracing, reserved for the enterprise edition. You can get a 30-day free trial of Applications Manager.
4. Site24x7 Server Monitoring (FREE TRIAL)
Site24x7 covers all of the aspects of system monitoring, giving you visibility on network, server, and application performance. This combination of competences is great for those who run virtualizations. The tool can monitor Microsoft Hyper-V and VMware and it’s also able to track the activities of Docker containers.
Key Features:
- MSP Monitoring: It helps in managing customer accounts and provides suitable support from endpoints. You can also monitor your customer account using customized logos and URLs while promoting your business.
- Performance Monitoring Using 80 Key Metrics: with the help of 80 key metrics, you can get detailed insight into disk usage, CPU processing, server health, and all other things to plan the optimal usage of a device.
- Process Monitoring: It includes analyzing the top process chart to pinpoint the issues; users can track the service and process behavior and solve it easily using start and stop automation.
- Resource Monitoring: It comes with a server monitoring tool that notifies users about background apps running and real-time changes to prevent unauthorized access.
Why do we recommend it?
Site24x7 Server Monitoring is part of a cloud platform. You sign up for the whole platform rather than for each individual module, so you get other services alongside the Server Monitoring unit. This provides a full stack monitoring system for networks, servers, applications, cloud systems, and Web assets.
As a cloud-based system, Site24x7 is location-neutral. Your entire infrastructure management team does not need to be physically located in the same building as the facilities being managed. The dashboard is accessed through a browser and there is also an app to gain access through mobile devices.
Server monitoring gives you constant updates on statuses that include CPU, memory, disk, network interface, software operating system, port, and file system checks. In total, the tool covers more than 30 different server performance factors.
The application monitoring screens in the tool give a constant live view of all activity on your network. It seeks out the causes of detected errors, down to analyzing lines of code.

Monitoring is not limited to one particular site. The Site24x7 package is able to reach across the network to check on multi-site systems and remote systems. If you don’t run your own servers, but use cloud resources, you can still deploy the Site24x7 monitor to get visibility on your network performance. The tool can monitor AWS and Microsoft Azure servers.
On-premises, Site24x7 can oversee devices running Windows, Windows Server, Linux, FreeBSD Unix, and OS X. The tool can give detailed activity data for each switch on your network and is also able to monitor wireless networks.

Site24x7 is offered in packages to suit website-driven businesses and MSPs as well as regular bricks and mortar companies. The service is charged for on a subscription basis and there is a restricted Free Edition that can monitor up to five servers.
Who is it recommended for?
Site24x7 offers four editions and each of these are priced in several plans – each provides the same modules but with varying capacity. The base pricing for all modules is suitable for small businesses and larger businesses add on extra capacity for higher fees. There is an edition available for managed service providers.
Pros:
- 100 Plugin Integrations: You can use over 100 built-in plugins to integrate with MySQL, Apache, and Nagios or create your own custom plugin using a Python script for effective data monitoring.
- Virtualization: Users can discover, monitor, and track the performance of VMware ESX, resource pools, critical devices, Kubernetes, clusters, and much more across your network.
- Cost-Effective Cloud-Based Service: This tool is the best choice for a startup that is tight on budget because it is a cloud-based service, and you don’t need heavy upfront investments in infrastructure.
- Flexible Alert Channels: It comes with multiple alert channels, which send push notifications to your Android and iPhone devices. Hence, MSPs can receive timely notifications about critical events and issues.
Cons:
- Complex Interface: If you are a new user of the site 24/7, you may find the interface a little bit complex, and issues with navigating through the various features and settings can be challenging.
You can get a 30-day free trial of the system. If you choose not to buy at the end of the trial period, you get switched over to the Free edition.
5. ManageEngine OpManager Nexus (FREE TRIAL)

ManageEngine OpManager Nexus, formerly OpManager Plus, is a comprehensive system monitoring software that correlates data from metrics, events, logs, traces, flow technologies, REST APIs, and webhooks to offer in-depth visibility into your system components. Its intuitive dashboards and automated remediation workflows also ease troubleshooting while improving your systems’ performance.
Key Features:
- Root cause Analysis: Tracks the root cause behind an issue and provides context for each alert, so you can troubleshoot quickly.
- Automated Workflows: Allows you to create workflows for automating routine tasks.
- Reports: Generates advanced reports related to capacity planning and historical trends for a better understanding of your systems.
- Alarms and Notifications: You can configure alarms and notifications to meet your specific requirements.
- Adaptive Thresholds: Uses ML algorithms to dynamically adjust baseline values to keep pace with the changing business environment.
Why do we recommend it?
OpManager Nexus provides detailed visibility into your IT infrastructure. It analyzes data from a wide range of sources to provide accurate information about the potential problems in your network and the required context to help with troubleshooting. A highlight for us is its well-designed dashboards that display all the relevant information in a way that is easy to understand. You can further drill down into these dashboards to get information about the specific aspects that you need.
Going beyond dashboards, it also creates layer 2 dependency maps, 3D floor and rack views, and other insightful reports that help you better understand the health and performance of your systems. It can also scale well to meet your growing needs.

Who is it recommended for?
This platform is a good choice for large enterprises, data centers, and organizations with large and distributed networks with thousands of devices. It can also be helpful for MSPs who are tasked with managing large client environments.
Pros:
- Critical Components: Analyzes the performance and health of your systems’ critical components to minimize disruptions.
- Flexible Configuration: Allows you to set the rules and configurations for alerts.
- Third-party Support: Monitors more than 450 vendors and 10,000+ devices.
- Application Performance: Provides information about your applications’ performance, including context-aware information that can be useful for fine-tuning them.
Cons:
- Overwhelming: It can be too overwhelming for non-technical users.
OpManager Nexus offers two pricing editions. The professional edition starts at $1,233 for 50 devices, while the Enterprise edition starts at $19,995 for 1000 devices. Both prices are for one year. Start a 30-day free trial.
6. SolarWinds Server & Application Monitor
The SolarWinds Server & Application Monitor (SAM) is part of the for-cost Orion suite of network monitoring and system management tools; we looked at components of the Orion suite in our article on the best sFlow traffic analyzers. Where the Server Health Monitor can meet the needs of a small shop, SAM can cover small businesses to large enterprises.
Key Features:
- End-to-End Monitoring: It diagnoses the tools and applications deeply and provides detailed information to troubleshoot critical warnings and achieve good performance across the server.
- Server Capacity Planning: Allows system admins to understand how the server and resources are used. Hence, critical issues can be prevented by understanding the peak and average capacity of the server and resource.
- Custom App Monitoring: Users can detect performance issues, CPU, memory, downtime, and response time for custom applications.
- Application Dependency Mapping: Users can create maps to monitor server activity and incoming network connections, such as port, service, and server, to gain a comprehensive understanding of critical insights and internal resource consumption.
Why do we recommend it?
SolarWinds Server & Application Monitor can operate as a standalone monitoring system that tracks all of your IT assets from user-facing software systems down to server resources. If you add on the SolarWinds Network Performance Monitor you will get a full stack system monitoring package. These two modules fit together.
As the name suggests, SAM monitors the system health and performance of server hardware and virtual servers from multiple vendors, as well as doing deep monitoring of many hundreds of applications. It can monitor multiple sites and cloud environments like Azure and AWS.
The SolarWinds Orion suite will auto-discover hosts and devices on your network. Then you can start to monitor them.
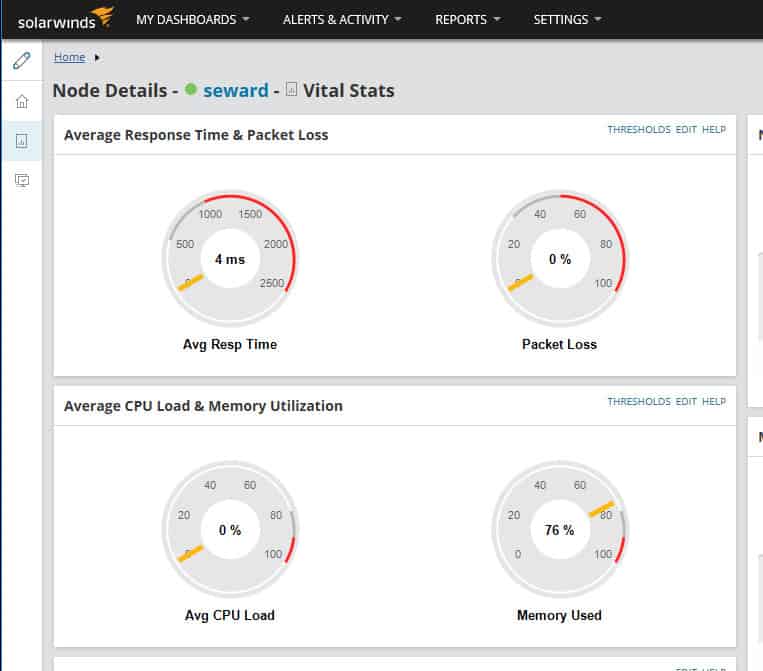
Once a server is identified and monitoring has been running, look under Node Details to see SAM’s display of the node’s performance and health data.
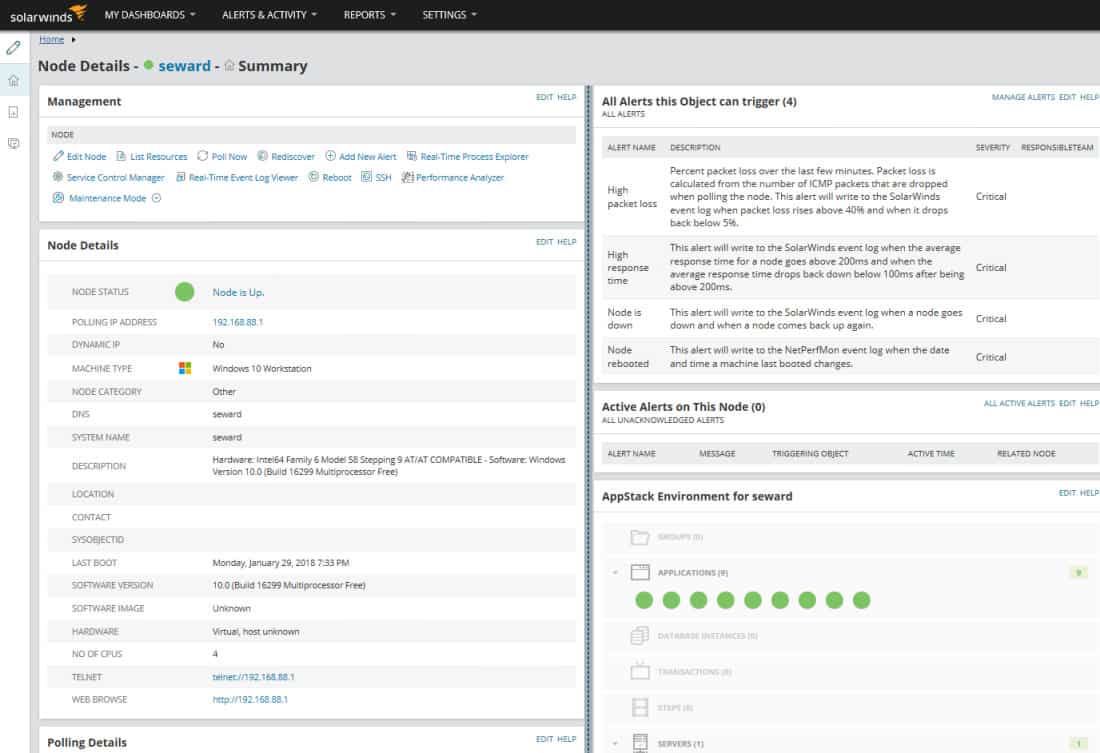
The server status data is displayed both graphically and in tables.
A second discovery scan is required so SAM can detect the applications running on the nodes previously discovered.
You can configure the application discovery scan to specify which applications SAM should look for. Then you provided the credentials SAM needs to access the information on the various nodes.
One SAM has detected applications and begun its regular scan, the Application Summary will show top-level status for applications running on your servers.
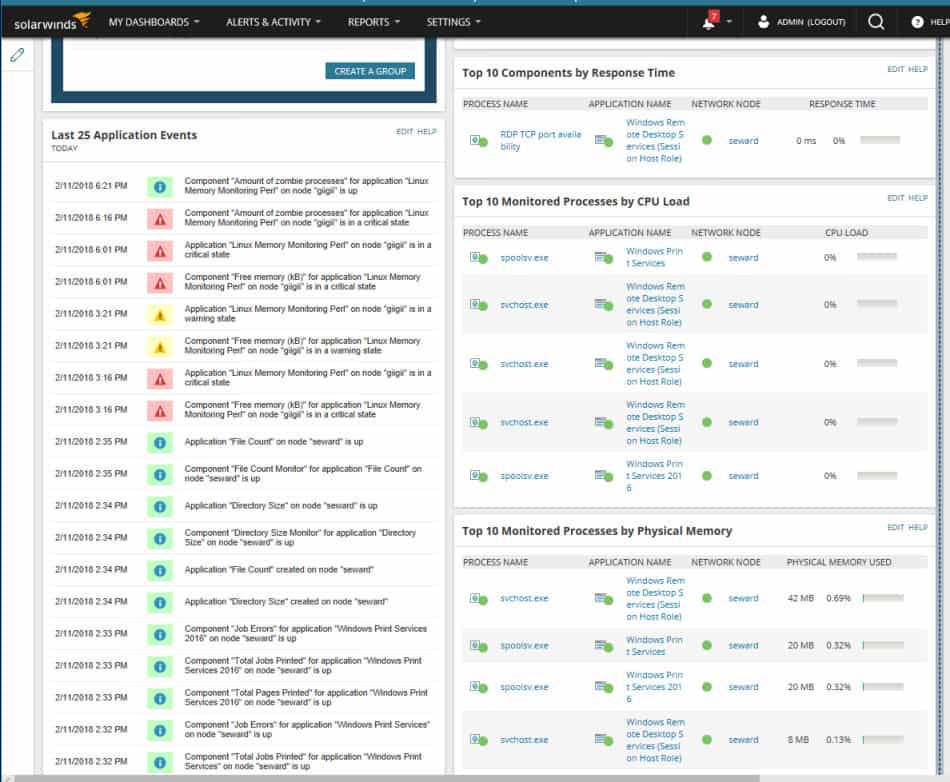
The summary includes application alerts and events, top 10 nodes by CPU load, by physical memory, virtual memory, I/O operations, etc.
SAM, working with the SolarWinds suite of network monitoring and management tools, provides a full range of features for customizable dashboards, analysis, alerting, reporting, etc.
SAM and the SolarWinds suite are enterprise-grade packages, so they are not cheap and call for considerable resources on the server hosting them. Most components tack on an additional charge. But if your network is large or growing, the SolarWinds suite with SAM is worth exploring.
Who is it recommended for?
This system is an on-premises package that runs on Windows Server. SolarWinds designed a collection of its monitoring system on a common platform, called Orion. This means that they will slot together and operate from a single console. The SolarWinds range of monitoring systems is suitable for use by large organizations.
Pros:
- 1200 Monitoring Templates: With the use of 1200 monitoring templates, you can monitor your server and various custom apps across all public, private, and hybrid cloud environments.
- Configure Alerts: Users can set warning messages and critical thresholds regarding dependency issues like network latency, packet loss, TCP connection problems, and more.
- Monitor Apps and Infrastructure Health: This tool provides insights about apps and infrastructure health and detects hardware failure to optimize proper resource usage.
- Dependency Mapping Software: It has dependency mapping software that gives visual data about network communication and issues.
Cons:
- The Trouble with Multiple Instance Management: Users find that some of the updates and app maintenance are complex. Also, the app is not scalable enough for multiple customizations and large or tough implementations.
Consider trialing the Hybrid Systems Monitoring pack. This bundle brings you greater system monitoring capabilities because it includes the Server & Application Monitor together with the Virtualization Manager, the Log Analyzer, and the Server Configuration Manager. All of these tools slot together into a single console. The software runs on Windows Server and is available for a 30-day free trial.
7. Sematext Infrastructure Monitoring
Sematext Infrastructure Monitoring is a good choice for monitoring hybrid systems. This package will check on networks, servers, cloud platforms, containers, and applications. It is able to link together service dependencies that provide instant root cause analysis when problems arise.
Key Features:
- Infrastructure Monitoring: Sematext comes with amazing inbuilt tools that help complete infrastructure monitoring and provide a real-time view of your organization regarding anomalies and other issues.
- Log Management: Sematext is an ELK service that extracts business KPIs and metrics to help understand user log reports and dashboard information.
- Real-User Monitoring: It helps you detect anomalies in real-time and analyze the real user data to deliver guaranteed customer satisfaction by working on the issues quickly.
- Server Monitoring: By monitoring the server, users can get detailed information about resource usage, CPU, disk usage, network load, IO, and much more.
Why do we recommend it?
Sematext Infrastructure Monitoring is a product of a company that specializes in log analysis. This product implements live system monitoring by the same route – cloud-based log processing. All monitoring systems pick up the system messages generated by equipment and software, so really, the Sematext method is no different from its system monitoring rivals.
The base package of Sematext Infrastructure monitoring tracks the availability of all devices and endpoints on the network and the resource availability of servers and cloud platforms. Monitoring applications requires the addition of integrations. These are free to use if you only require a 30-minute data retention period. However, there is a charge per agent, which means per application per device, if you want to keep performance metrics for longer.
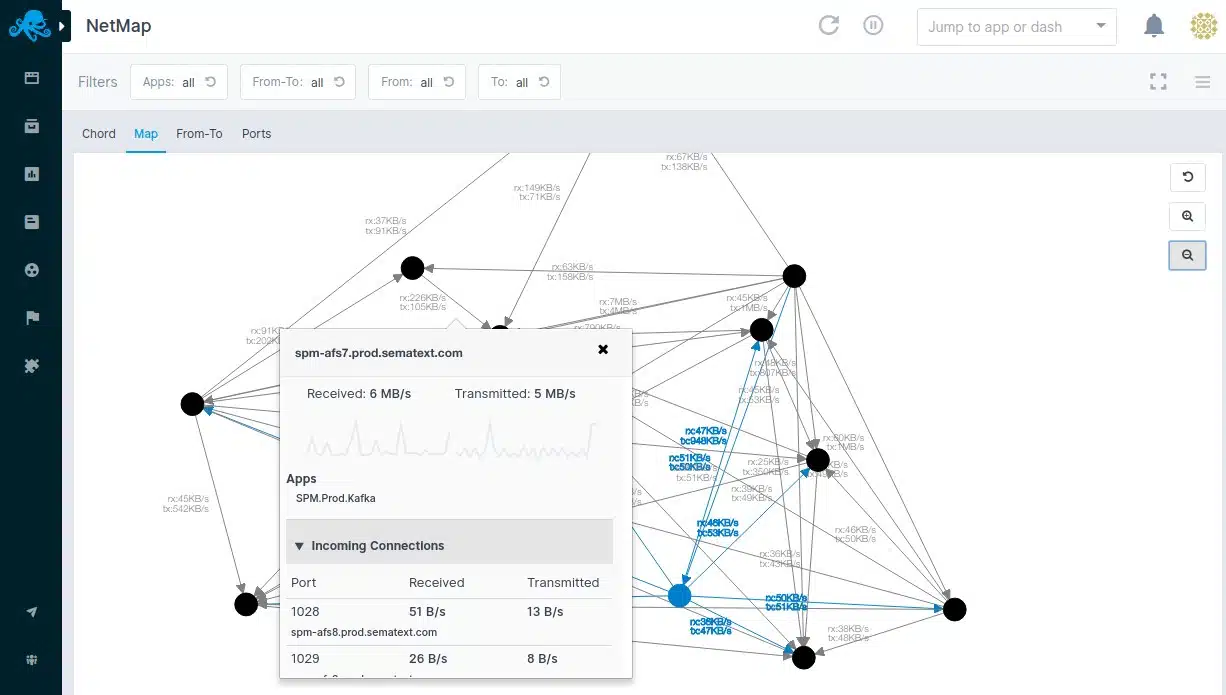
The network monitoring service in the Sematexrt package includes a discovery system and an automatic network topology mapping function. This network map is tied to the hardware inventory, which is also generated automatically. The map shows details of each node as you hover the mouse over it and links in the plan display current throughput speeds.
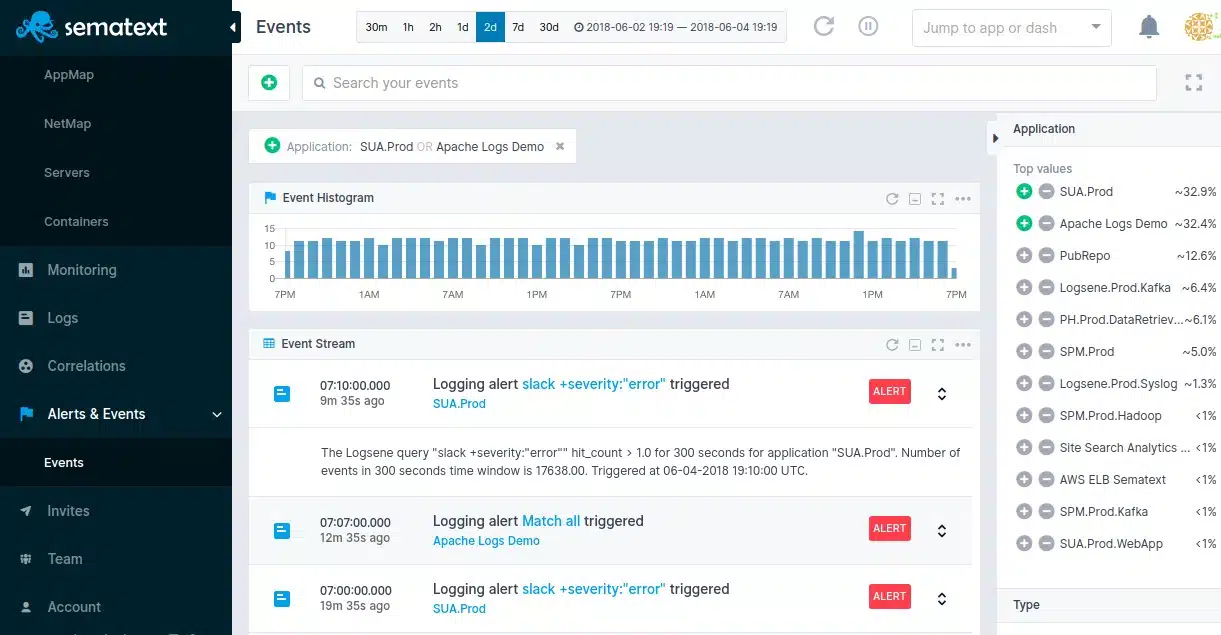
The different metrics that the system tracks can have performance thresholds placed on them. When these are crossed, you will receive a notification by email, Slack, or Webhooks. System errors can also trigger alerts and you can see these in the console of the Sematext system.
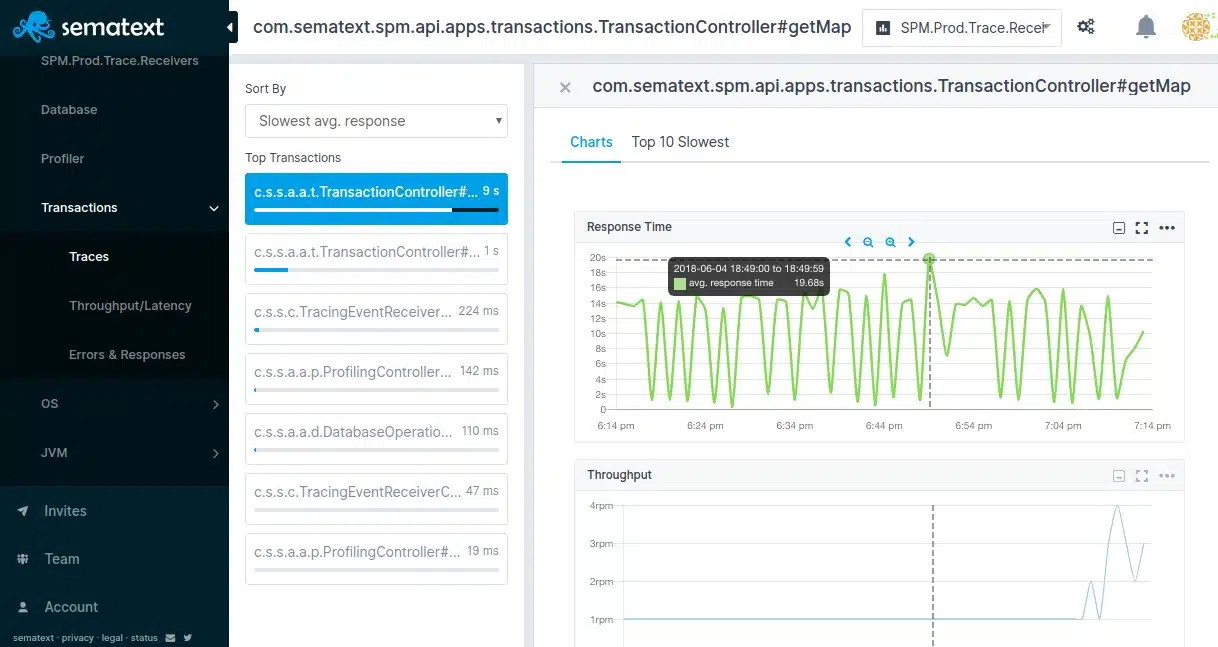
Application monitoring can drill down to distributed tracing and code profiling. The code profiling service is able to show program lines that are written in Java.
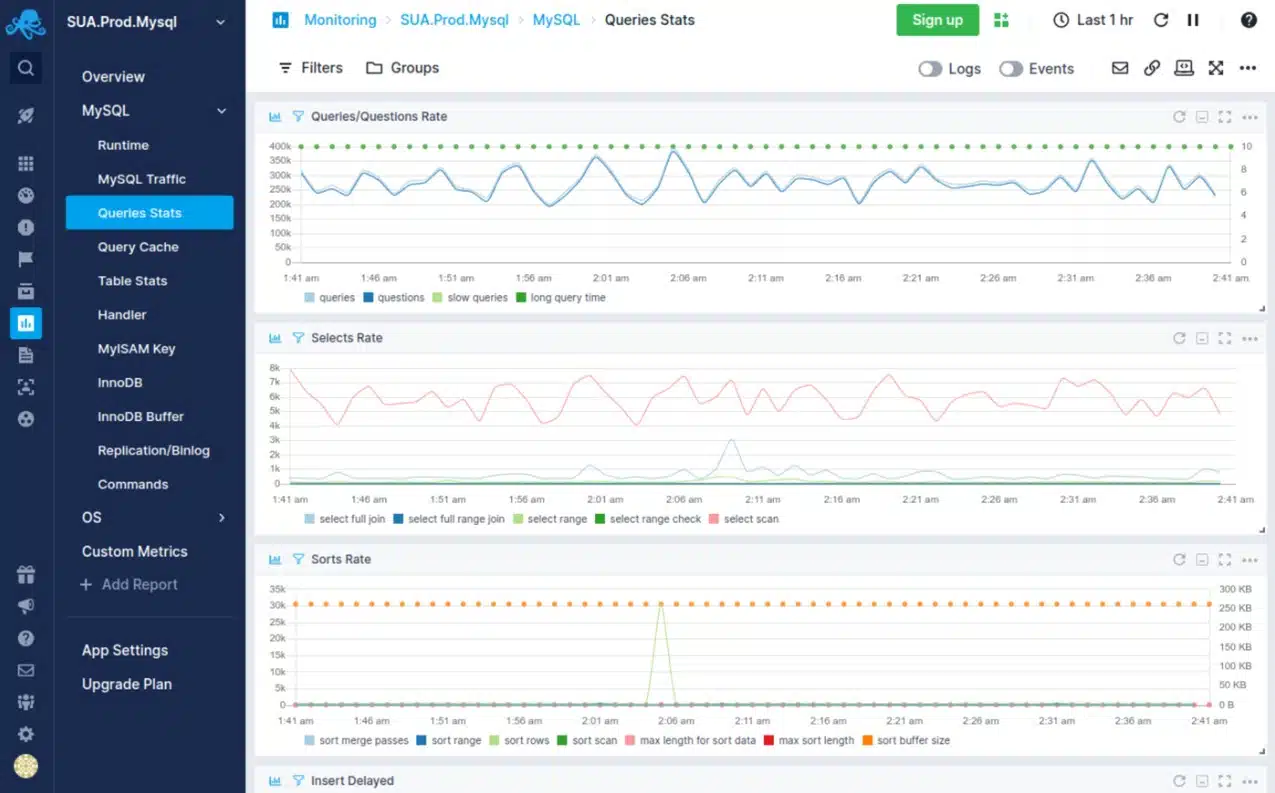
The Sematext Infrastructure Monitoring service’s application monitoring package is particularly strong at monitoring databases. The service monitors a long list of DBMSs, including those that run on cloud platforms.
Sematext Infrastructure Monitoring can be merged with other Sematext services, which include a log management package, a real user monitoring service, and a synthetic monitoring tool.
Who is it recommended for?
The Sematext system is a SaaS package delivered on the cloud. However, you can get the software and run it on Docker. The Infrastructure Monitoring service has three plans and the first of these, Basic is free. That plan for small businesses is limited to monitoring five devices.
Pros:
- Metrics and Log Alerts: Users can create alerts and use filters according to the log stream to get notified about application failure and data deviation.
- Event Streams: This tool includes event streams, which store IT operations and events to send alerts about weak parts of the app and the organization’s overall infrastructure.
- Seamless Integration with Various Apps: The tool is easy to integrate with ready-to-use monitoring agents and log shippers.
- Code Profiling for Java Code: This functionality enables system administrators to review and improve the performance of Java applications by finding bottlenecks, memory leaks, and other performance concerns.
Cons:
- Expensive Features: Some features may come with a high price tag, which can be expensive for some users or organizations with budget constraints. Also, many users find a lack of support when setting up certain features.
Sematext Infrastructure Monitoring is a SaaS package but you can also choose to download the software and run it on your own server over Docker. There is a free edition, called Basic, which is limited to monitoring five hosts. You can get either of the two paid plans on a 14-day free trial.
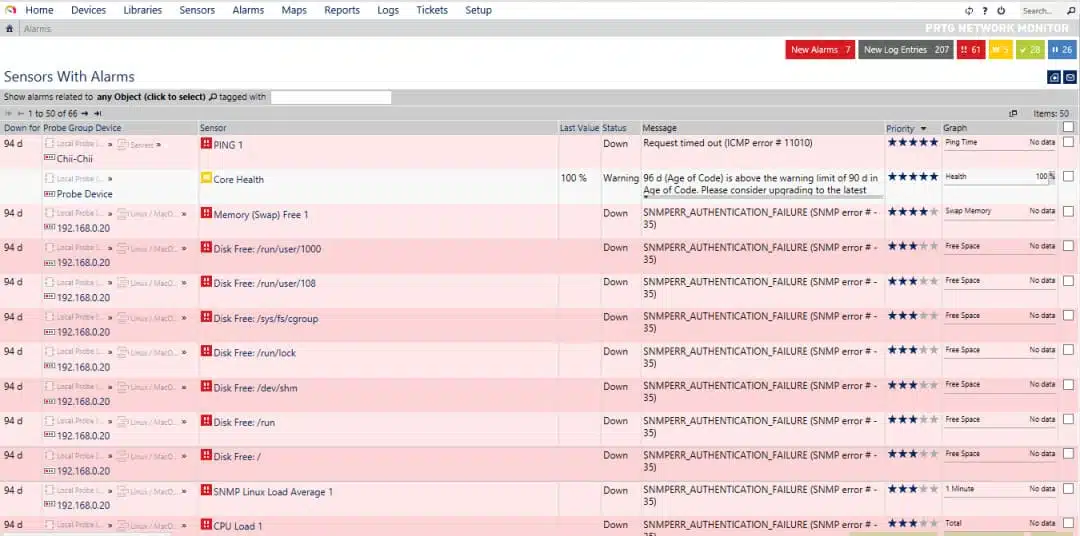
8. Paessler PRTG Network Monitor
The Paessler PRTG Network Monitor is a “batteries included” solution that monitors your servers and devices, network traffic, and more. PRTG can use NetFlow and sFlow, and we covered it in some detail in our exploration of free NetFlow traffic analyzers.
Key Features:
- Windows Monitoring: Users can monitor all details of their Windows servers and computers, including CPU usage, hard drive space, WMI, performance counters, and SNMP. It also monitors SharePoint, SQL, and other event logs.
- Quick Configuration: It has an auto-discovery feature that automatically finds devices on your network and sets up basic monitoring. This feature uses ping queries and predefined device templates to make the setup process smooth and effortless.
- Custom Monitoring: Your network is special, and the Applications Manager recognizes that. It provides “custom sensors” that allow you to personalize your monitoring to your network’s specific requirements and the applications you use.
- Load Balancing: Managing distributed networks can be difficult, but the Applications Manager makes remote probes easy to use. These probes enable you to monitor devices in external networks by deploying a probe on a server within that network.
Why do we recommend it?
Paessler PRTG Network Monitor is a bundle of system monitoring tools. While other system monitoring providers also produce system management tools, PRTG focuses on only creating monitoring services. This package includes a network discovery service, which creates an asset inventory and network map. Automated monitoring is based on those records.
The PRTG Network Monitor runs on Windows. It monitors mail servers, web servers, database servers, file servers, and virtual servers. PRTG can monitor multiple sites and cloud services. It uses SNMP, WMI, NetFlow, sFlow, ping, ssh, REST APIs, and packet sniffing.
Setting up the tool is a bit complex but a setup wizard and how-to video lead you through the steps. The tool will find many devices and servers via auto-discovery.
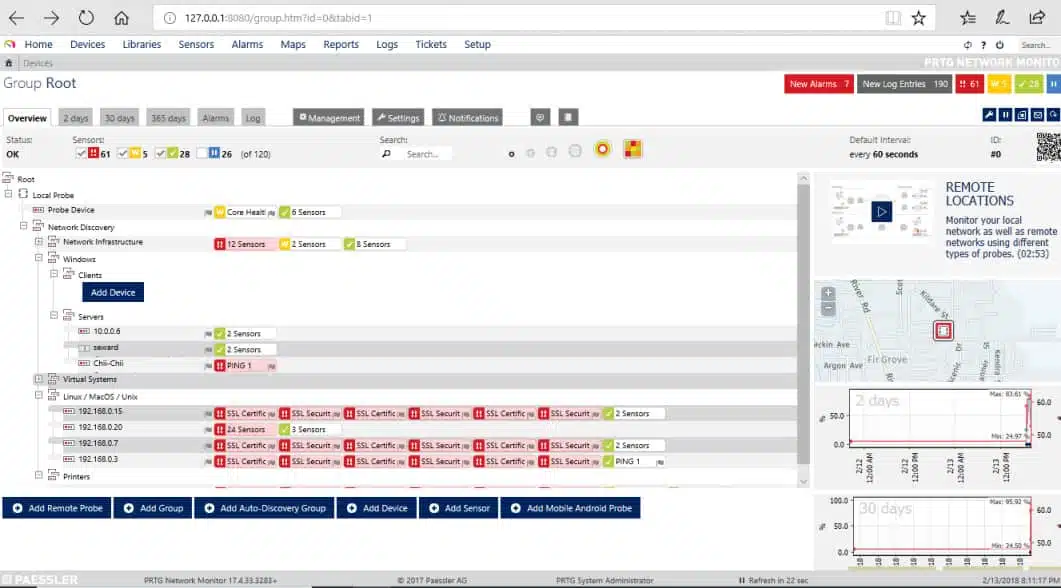
In the user interface, a primary view is the device tree showing the devices (including servers) in your network, and the sensors monitoring each.
On the server hardware side, its sensors can monitor CPU load, memory, disk, server room environment, etc. On the applications side, it comes with more than 200 sensor types for common network services, including HTTP, SMTP/POP3 (email), FTP, etc.
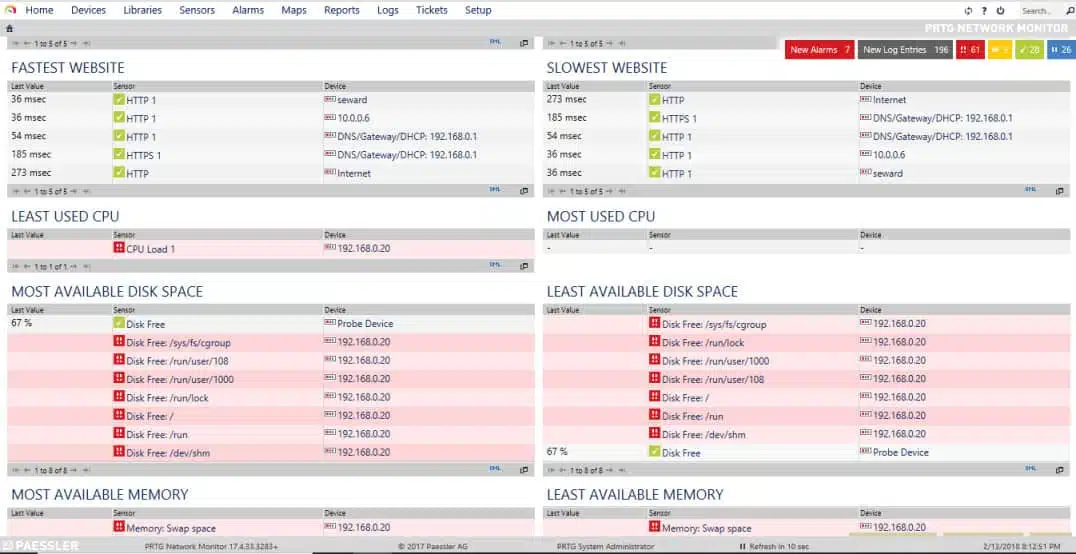
You can specify thresholds for alerts, and PRTG can send notifications of detected issues via several methods, including email and SMS. It provides a range of predefined reports and facilities for designing custom reports. Reports can also be scheduled.
Who is it recommended for?
The PRTG system is suitable for businesses of all sizes because you choose which of the monitoring services to turn on – you buy an allowance of sensors. That means that you don’t end up paying for features that you don’t need. You can use the package for free if you only activate 100 sensors.
Pros:
- SNMP, Performance Counters, and WMI: It combines a variety of technologies, including SNMP, performance counters, and Windows Management Instrumentation (WMI), to monitor Windows servers and desktops comprehensively.
- Agentless Monitoring: With Applications Manager, you don’t have to install agents on each device you wish to monitor. This agentless technique simplifies deployment and saves overhead, making monitoring more manageable and scalable throughout your network.
- Alarm System: This tool comes with an alarm system that notifies you of any critical issues or anomalies detected in your network. Hence, you can quickly address issues and minimize downtime.
Cons:
- Complex Sensors: Users feel that some sensors in Applications Manager have complex configurations. Hence, it requires additional time and expertise to set up effectively.
The free version is limited to 100 sensors after a 30-day free trial which you can download here. Because a sensor is an individual data stream, each server and device will typically require several sensors.
The free version of PRTG Network Monitor provides a well-stocked toolbox for monitoring a small network.
9. Atera
Atera is a remote monitoring and management system (RMM) designed for use by managed service providers (MSPs). The tool goes beyond system monitoring because it includes a large number of system administration utilities, such as a patch manager.
The Atera service enables the MSP technician to monitor the IT infrastructure of a client through the installation of agent software on that remote site. Once the service begins for a new client, the Atera system searches through the client network and logs all attached devices. This creates an equipment inventory and starts the monitoring process for each device.

Atera also searches all endpoints and servers to record what software is installed on the site. This search feeds through to license management functions in the system. Both the equipment search and the software log present opportunities for the MSP to adjust contracts to reflect exactly what infrastructure the service will monitor – many clients don’t know exactly what equipment and software they have on-site before the MSP contract begins.
Key Features:
- Remote Monitoring and Management: It includes monitoring system activities and offers complete visibility by sending automated alerts regarding pinpoints and issues.
- Patch Management: Patch management can really save you hours of time because it allows you to create customized schedules for all endpoints, giving you complete control over a busy environment.
- Network Discovery: Network discovery helps to see the full picture of all users across the network by running a security scan to get insights about all digital assets and open ports.
- Mac Remote Monitoring: it helps to manage the activity threshold. It sends an instant alert when the threshold exceeds its specified limit to immediately respond to system failure.
Why do we recommend it?
Atera is a complete system monitoring and management package. It is an RMM system, which means that it is intended for use by central IT support teams when managing remote assets. The platform includes automated monitoring processes that include performance thresholds that trigger alerts. System management is also highly automated.
The monitoring system includes the supervision of networks, servers, and applications. The server monitor checks on all of the standard performance issues of a server. These include CPU, memory, and disk capacity and utilization.
The performance of applications is closely linked to the statuses of the servers that host them. This is particularly true in the case of virtualizations. Atera can monitor a wide range of applications including web and email servers, databases, virtualizations, and communication services.

The Atera system includes monitoring modules for in-house use by the MSP. These include contracts management, client management, and team management.
Beyond monitoring processes, Atera includes Help Desk management software that includes remote access and chat facilities for use by the technicians manning the Help Desk.
Who is it recommended for?
Atera is a SaaS platform that was originally designed for use by managed service providers. That version is still available but now there is an adaptation of the system for use by IT departments, which have slightly different needs. Plans are levied per technician, which makes the system suitable for businesses of all sizes.
Pros:
- IT Automation: Atera offers all-in-one IT automation technologies that make routine tasks much easier. Hence, you can focus on other important tasks for more productive output.
- Reporting and Analytics: Its expert reporting and analytics features provide users with vital insights into their systems and operations. These reports help improve customer retention by proactively resolving concerns and offering useful insights to clients.
- Complete Activity Log: This tool records every action and command in the activity log, so users can monitor a comprehensive activity log for tracking.
- SNMP Monitoring: It allows users to monitor various devices such as printers, routers, and RAID systems to make sure network infrastructure has optimal performance and reliability.
Cons:
- Response Time for Handling Multiple Tickets: While it is not a major issue, some consumers may suffer slower response times when dealing with many tickets at the same time, especially during peak periods.
Atera is a cloud-based service, so the MSP doesn’t need to install any software to use it. All access to the dashboards of the service is made through a standard web browser. The service is charged for on a subscription basis with fees levied per technician per month. There is also a yearly tariff available, which works out cheaper.
10. N-able N-sight
N-able N-sight is a cloud-based remote monitoring and management software system. It can monitor networks, endpoints, mobile devices, servers, and applications. This service is not only a monitoring system. It can also automate many routine maintenance tasks and implement automated responses to status alerts or malicious activity.

Key Features:
- Complete Remote Management: N-sight offers full monitoring, alerting, and patch management for Windows, macOS, Linux, and iOS, allowing you to manage your whole network from a centralized location.
- Smart Patch Management: Patching your gadgets using N-sight is quick and simple. It guarantees that all of your devices and operating systems have the most recent patches installed, which helps to improve network security and reliability.
- Flexible Automation: you can customize device policies and automate routine tasks to improve efficiency with the help of 400 pre-configured scripts by simply dragging and dropping.
- Apple Device Management: For enterprises that use Apple devices, N-sight interacts smoothly with Apple Business Manager. This connection provides zero-touch deployment on iOS, iPadOS, and macOS devices, making device administration easier.
Why do we recommend it?
N-able N-sight is another SaaS package for use by central IT departments and managed service providers. This package includes some MSP management tools (Professional Services Automation), such as a ticketing system and a billing interface. The package aims to provide a technician productivity level of serving 100 endpoints.
As this system is resident in the cloud, it doesn’t matter where the monitored resources are physically located. They don’t have to be on the same site as the IT support team. The service is also able to include cloud resources into the monitoring system.
The endpoint and server monitoring functions of the system keep constant checks on the capacity and utilization of CPU, memory, and disk space on each machine. Other server monitoring functions include the management of virtualizations and the availability of patches and updates for services and software.
Network management services focus on the capabilities of the Simple Network Management Protocol (SNMP). The N-able N-sight system acts as an SNMP Manager, gathering status reports from device agents. Agent responses are interpreted into system data, which is shown live on the screens of the dashboard. SNMP also provides a system discovery function that will automatically document all network equipment.
The SNMP system includes an alerting mechanism. This means that technicians can work on other tasks and assume everything is OK with the network unless otherwise notified. The system alerts appear on the dashboard and can also be forwarded to key staff members via email or SMS message.

The dashboard offers summary screens for just about every category of equipment or service in the system. Each entry in a summary screen provides a link through to a details screen. Screens contain tables of data and also illustrative graphs and charts.
The system dashboard can be accessed from anywhere through a standard web browser or a special mobile app.
Who is it recommended for?
The N-sight system is primarily aimed at managed service providers – one module on the platform is called MSP Manager. However IT departments would also find this package useful. The service has a per-technician charge rate, which makes it very scaleable and suitable for businesses of all sizes.
Pros:
- Secure Remote Access: Users can securely access devices remotely due to their attended and unattended support. Moreover, you can use drag-and-drop file transfer and live chat for smooth collaboration.
- Ticketing & Billing: Users can automatically schedule and track tickets to improve support operations. The system also includes a customizable client portal and a mobile app for technicians to manage their work more effectively.
- Microsoft Cloud Management: Allows admin to manage all Microsoft tenancies, devices, resources, and people in Microsoft 365, Intune, and Azure, allowing cloud services to run smoothly within enterprises.
- Layered Security: You can easily integrate the N-sight tool with various other security apps such as antivirus (AV), endpoint detection and response (EDR), backup, password management, and web protection to provide layered security against a wide range of threats.
Cons:
- Data Retrieval Limitation: While N-sight has broad monitoring features, many users find that data from custom checks is only accessible via an API; hence, this is one of the cons and might require extra effort for customers who rely significantly on custom tests for their unique monitoring needs.
N-able N-sight is charged for by subscription with no setup fees. This makes the service appealing for startups because there are no upfront costs involved in starting to monitor remote systems with N-able N-sight. N-able offers a 30-day free trial for those who are interested in trying out the service
11. Nagios XI and Nagios Core
Nagios is an enduring standard in network monitoring. Nagios Core is the open-source free version, and Nagios XI is the commercial for-cost variant with additional features and automated assistance for configuration. Nagios has a reputation for being powerful, reliable, scalable, and extremely customizable – and being complex to configure.
Key Features:
- Multi-Tenant Capabilities: This tool allows multiple users to access the web interface. Each user receives a customized view, guaranteeing that clients see only their individual infrastructure components, hence improving privacy and clarity.
- Extendable Architecture: Due to its extendable architecture, you can easily integrate with in-house and third-party apps using multiple APIs to meet the unique needs of the business environment.
- Customizable Code: The best thing is that Nagios has an open-source and paid option based on open-source software, and users can access its source code to customize and modify it according to specific requirements or preferences.
- Problem Remediation: It supports quick problem remediation, so you can always stay aware of the issues. Furthermore, event handlers automatically restart broken applications and services, reducing downtime and ensuring system stability.
Why do we recommend it?
Nagios XI and Nagios Core are two versions of an open-source system monitoring package. The Nagios Core service is free to use and the developers created a more comprehensive monitoring package, which is based on the open-source system but it charged for. Both plans provide monitoring for networks, sever,s and applications.
The free version has a learning curve but also an active community. It monitors servers, services and applications, just like the commercial version. It includes reporting by email and SMS, a basic user interface (including the network map), and basic reports.
Nagios Core lacks auto-discovery, and you must learn to set up and maintain complex configuration. On the plus side, it does give you a lot of flexibility to customize and extend the tool. Community-developed addons can perform discovery and help you get started with configuration.
You can use the free 60-day trial to evaluate the for-cost version and, if you elect to go with the free one, save the auto-generated config files from /usr/local/nagios/etc before uninstalling your eval copy. You can then use those files as your starting point for your new install’s configuration.
The commercial version Nagios XI has a richer range of features, including automated support for discovering your devices and hosts, automatically configuring the tool, and commercially-supported addons. It has a much more sophisticated user interface and more advanced reporting that covers trends, capacity planning assistance, etc.
Nagios XI is built to run on Red Hat Linux and CentOS. For Windows, use a VM appliance with Hyper-V or VMware. It includes an auto-discovery tool and a configuration management wizard for adding a new device, host, or application).
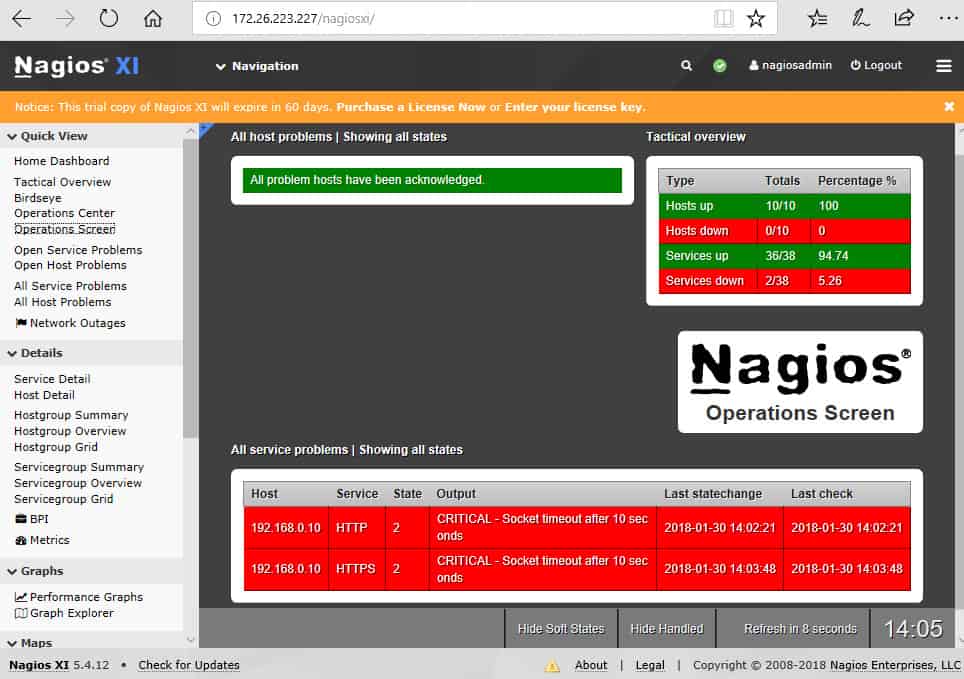
Once Nagios XI is installed and monitoring, the Operations Screen gives you a high-level view of the current state of the network, and the Operations Center lets you drill down to the items mentioned.

The Host Status page shows a summary of metrics for the monitored hosts. You can drill down to an individual host to see details including performance graphs, capacity planning info, alarms, etc.
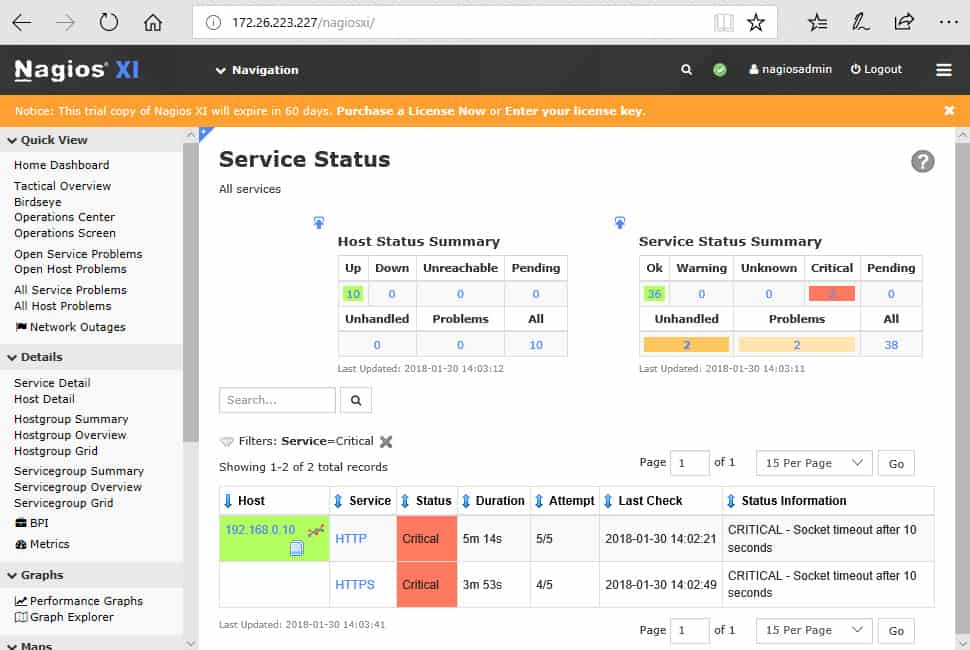
The Service Status page summarizes the state of the monitored services.
Nagios is a well-regarded solution for network monitoring. As with other tools that offer a fully-free vs commercial version tradeoff, you must decide whether you have (or will develop) the expertise and time to use the free tool, or whether it would be more cost-effective to pay for the automation and support of the commercial version.
Who is it recommended for?
The free Nagios Core service is interesting for small businesses. However, the tool’s interface is not very comprehensive and you would need to pair it up with a better front end, such as Kibana. Both packages can be expanded by plug-ins and there are thousands of them available for free.
Pros:
- Give Centralized View of Entire Infrastructure: It gives a centralized view and in-depth status information of system information. In case of any network outages, it quickly sends alerts to technical staff to look into it.
- Proactive Planning: you can proactively plan your downtimes when upgrading your system to ensure workflow is not affected.
- Effective Reporting: It also uses various third-party tools to send advance reports to ensure meeting SLAs.
- Stable and Reliable Platform: Nagios is a stable and trusted platform that monitors all the critical components of the system nonstop and is scalable up to 1000 nodes.
Cons:
- Free Version Limited to 7 Nodes Only: Though it offers a free trial, you can only monitor up to seven (7) hosts (nodes) and perform up to 100 host and service checks.
Choosing a System Monitoring Tool
Besides the tooling to monitor your systems, you need a protocol in place for solving problems and responding to incidents. Best practices for system monitoring call for forethought and attention to design.
Free tools are tempting, particularly if you are on a tight budget. The free versions of paid software are usually limited in their capacity so that they can only support small networks. Some freeware has worked its way into the toolkits of seasoned network administrators mainly out of familiarity. However, these underfunded tools are usually under-supported and glitch-laden.
Planning is a key stage when buying new monitoring software. You need to look for suites of monitoring tools that cover the whole system stack. Remember that spending on monitoring saves you money in other areas of the IT department and prevents loss of income to the business due to system failure.
System Monitoring Software FAQs
Where can I find device monitoring templates?
If your system monitoring tool operates on a template model per device type, they will probably have been shipped with the software bundle for that monitoring system. If you can’t find them, ask the Help Desk of the software provider for them. Another place to look for templates is on user forums for that tool.
Who in my organization is best to perform system monitoring?
The System Administrator in the IT department is responsible for system monitoring. In small businesses, the System Administrator IS the IT department. In larger organizations, different staff members will have responsibility for monitoring different services, for example, the DBA will be responsible for monitoring databases and the Network Manager or Network Administrator will be responsible for monitoring the network.

Well done! How do you stay updated on such relevant trends?