
Few resources carry as much important information as databases. Small oversights and mistakes can lead to database outages and losing some of your most important data.
Without the right database monitoring tools to manage these services, it is challenging to keep an eye on everything you need for which you need to monitor.
Taking your eye off the ball could very easily lead to your database metrics exceeding capacity limits.
Here is our list of the best database monitoring tools & software:
- Paessler PRTG Network Monitor (FREE TRIAL) Database monitoring functions are part of this all-in-one network, server, and applications monitor. Runs on Windows Server. Start a 30-day free trial.
- ManageEngine Applications Manager (FREE TRIAL) Includes monitoring screens for both SQL-based and NoSQL databases. Runs on Windows Server and Linux. Start a 30-day free trial.
- Site24x7 Server Monitoring (FREE TRIAL) An online monitoring package that includes SQL monitoring and analysis functions.
- Idera SQL Diagnostic Manager (FREE TRIAL) A specialist database monitor for MySQL or SQL Server. Start a 14-day free trial.
- Atera A remote management solution for managed service providers that includes database backup automation and supervision.
- Datadog Database Monitoring A cloud-based application monitoring service that includes database performance checks.
- SolarWinds Database Performance Analyzer Includes real-time performance monitoring plus analysis functions. Runs on Windows Server.
- dbWatch Database Control A data-base focused tool that unifies monitoring for all databases in an enterprise operated by SQL Server, Oracle, Sybase, MariaDB, MySQL, and Postgres.
- AimBetter This SaaS system remotely monitors database performance and includes the services of database experts for SQL Server, Oracle, and SAP.
- SQL Power Tools Logs database performance metrics and scans for anomalous behavior to detect any intrusions.
- Red-Gate SQL Monitor Real-time database monitor with color-coded statuses and some great data visualizations.
- Lepide SQL Server Auditing A database monitor that is prized for its cybersecurity features.
- ManageEngine Free SQL Health Monitor A competent free database performance monitor from a leading infrastructure management producer.
The Best Database Monitoring Tools
Databases grow. Larger table sizes and more access attempts put pressure on resources such as CPU and memory space for sorting. Gradually, a database that seemed to be working well can become cumbersome and slow, lacking sufficient resources to serve all queries; requests are queued and simultaneous activities create mutual resource locks. Constant analytical monitoring can identify evolving resource shortages and access conflicts to head off performance problems.
Our methodology for selecting a database monitoring tool
We reviewed the database monitoring tools market and analyzed tools based on the following criteria:
- The ability to attach to database instances from different DBMSs
- SQL query troubleshooting and optimization
- Database resource and server resource monitoring
- Alerts for resource shortages and performance deterioration
- An easy-to-use interface
- Secure access procedures that include authentication and multiple user accounts
- A free trial, demo, or money-back period for no-risk assessment
- A reasonable price that reflects the quality of the product and offers value for money
1. Paessler PRTG Network Monitor (FREE TRIAL)
Next, we have Paessler PRTG Network Monitor, a network monitoring tool that boasts a sizeable SQL monitoring ability. This program can monitor common databases such as Microsoft SQL, MySQL, Oracle SQL, and PostgreSQL. In other words, it covers everything needed to provide a solid foundation of visibility on most enterprise networks.
Key Features:
- Monitoring for multiple DBMSs: MySQL, SQL Server, Oracle, and PostgreSQL
- Alerts for long execution times: Forward as notifications by SMS or email
- Resource utilization monitoring: Full-stack observability
Why do we recommend it?
Paessler PRTG Network Monitor doesn’t just monitor networks. It is a large collection of monitors that are called “sensors” and these are available to monitor servers and applications as well. The software package includes sensors to track the important metrics for SQL Server, MySQL, MariaDB, Oracle, and PostgreSQL.
For a network monitoring tool, PRTG Network Monitor is also straightforward to set up. PRTG Network Monitor comes equipped with sensors that have been configured out of the box. These pre-configured settings cover most large database providers like Microsoft SQL, MySQL, and Oracle SQL. This has the advantage of eliminating the need for you to configure your configurations from nothing.
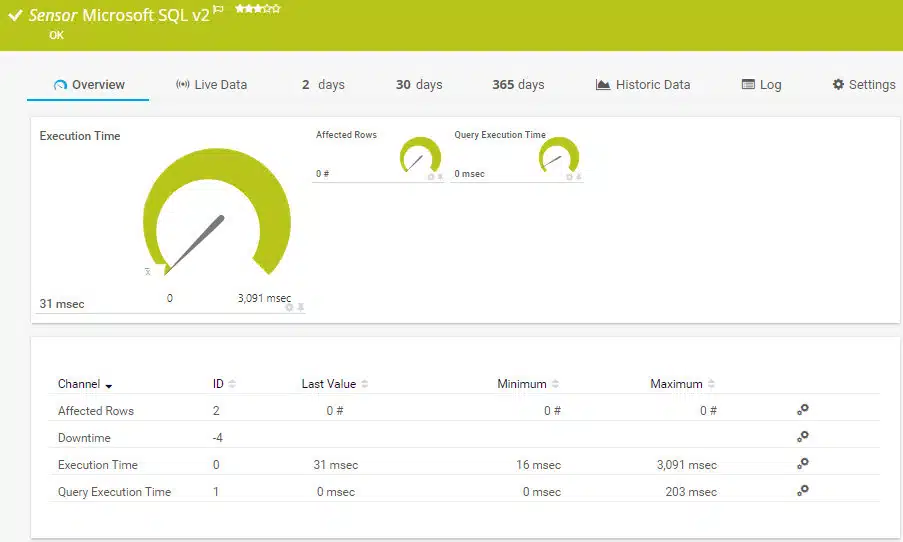
PRTG Network Monitor can be used to monitor the execution time for an SQL query. The tool will measure the time from the moment the connection was established right through the transfer to the end of the connection. This allows you to clearly see the performance of your database under pressure.
Overall, PRTG Network Monitor is a product that combines general network monitoring ability while simultaneously providing a compelling experience for database monitoring. There are several pricing options available for PRTG Network Monitor. This starts with a freeware version of PRTG Network Monitor, which allows the monitoring of up to 100 sensors for free.
Who is it recommended for?
The advantage of tracking database performance with PRTG is that you also get network, server, and application monitors in the same package. This system is available for installation on Windows Server and also as a SaaS platform. However, you won’t get application dependency mapping with this option.
Pros:
- Free option: A package of up to 100 sensors
- Deployment options: On premises for Windows Server or a SaaS platform
- Sensors can be customized: Allows you to only pull the metrics you want to monitor
Cons:
- Monitoring only: Not possible to set up database management automation
The first paid version of PRTG Network Monitor costs $1600 (£1253) for 500 sensors. The next three products for larger organizations cost $2850 (£2,232) for 1000 sensors, $5950 (£4,662) for 2500 sensors and $10500 (£8,227) for 5000 sensors. Organizations that need to monitor even more can download the XL1 Unlimited version, which supports unlimited sensors for $14500 (£11,361). There is also a 30-day free trial available for downloaded.
2. ManageEngine Applications Manager (FREE TRIAL)

ManageEngine offers database monitoring as part of its Applications Manager system. This software package also covers server performance, so you can drill down and examine the physical support for your databases as well as checking on the operating metrics of your databases.
Key Features:
- Monitors demand: Watches database capacity
- Tracks resource availability: Relates database resource allocations to physical server services
- Analyzes database performance: Provides tips on database optimization
Why do we recommend it?
While monitoring all software and services, ManageEngine Applications Manager is able to implement database monitoring. A discovery service identifies all of your applications and services and then draws up an application dependency map to show how they fit together. This lets you see which applications rely on databases and which server resources those databases need.
The monitoring services of the Applications Manager have specialized procedures to monitor relational databases, including Oracle, MS SQL, MySQL, IBM Informix, IBM DB2, Sybase, and PostgreSQL. NoSQL databases are also included in the monitoring capabilities of Applications Manager. This includes Oracle NoSQL, MongoDB, Cassandra, Couchbase, and Apache HBase. Big data stores, such as Hadoop and in-memory databases, including Oracle Coherence, SAP HANA, and Redis and also covered.
The monitor will watch database-specific metrics and also examine the dependencies of other applications that rely on databases, such as web servers, and how the interactions between the server and the database management systems perform.
The main database performance monitoring screen in the Applications Manager is tabbed. This removes the need to constantly leave the environment and go back to the main Applications Manager menu in order to observe other categories of database statuses.

The monitoring tool will show live response times as an overall statistic for all databases, allowing a drill down on metrics per DBMS and then per instance. Monitoring categories include database-wide factors, such as memory and disk usage, I/O speeds, and buffer statuses. It also has transaction information on all SQL performance, which can also be analyzed. These different tabs offer a range of monitoring services that cover hour-by-hour service requirements and analytical tools for database optimization and query refinements.
Who is it recommended for?
This package is able to monitor all of the major relational, No SQL, big data and in-memory database management systems. The tool is able to automatically identify which resources are needed in what capacities and when by watching the activation of each database query system. This provides predictive alerts.
Pros:
- Deployment options: Offers on-premise and cloud deployment options
- Discovery routine: Automatically detects databases, server hardware, and devices in real-time
- Application dependency mapping: Maps out how different services impact on each other
- Database log monitoring: Tracks memory usage, disk IO, and cache status
Cons:
- A large package: Monitors many applications, not just databases
ManageEngine Applications Manager installs on Windows Server and Linux. All of the server and application monitoring capabilities of the tool are available to all buyers – there aren’t any partial versions or incremental purchase plans. The tool is available for a 30-day free trial.
3. Site24x7 Server Monitoring (FREE TRIAL)
Site24x7 Server Monitoring offers network, server, and application monitoring. This combination is ideal for keeping the performance of your databases in a good state. The system is a cloud-based service, so you don’t have to install any database monitoring software to use it. This configuration makes it a great tool for monitoring remote sites and it also works well for MSPs.
Key Features:
- Application monitor: Tracks all application activity
- System discovery: Dependency mapping around the database
- Query analysis: Performance optimizer
Why do we recommend it?
The Site24x7 Server Monitoring module combined with the platform’s APM provides a layered view of application demands on databases and the demands that those databases place on the servers and cloud platforms that host them. This cloud-based SaaS system implements application dependency mapping and predictive performance alerts.
The application monitors in this bundle include a database performance optimizer. It will automatically discover all of your databases and install agents to keep tabs on them. These agents report back to the central Site24x7 system, where you can access results through a browser.
Performance metrics are shown live on the screen, and you can set alert parameters that enable you to head off overloading. As the tool can monitor any number of instances, it is a good assistant for coordinating between distributed databases and between production and development environments. The reporting utility in the tool will help you analyze the performance of your databases over time.
Given that you get dedicated server monitoring with this support tool, it is easy to identify the cause of performance impairment. You can explore through supporting resources to find exactly which element of the stack is dragging down the performance of your databases.
Who is it recommended for?
You can use Site24x7 to monitor SQL Server, MySQL, MariaDB, Postgres, and DB2 relational databases and No SQL systems, such as MongoDB, Hadoop, CouchDB, Couchbase, and Riak. The Site24x7 system offers modules but they are not offered separately. Instead, you get a plan that bundled all modules together.
Pros:
- Flexible cloud-based monitoring: Part of a package of full-stack observability tools
- Integrates with 12 DBMSs: Connects and implements searches in the databases
- Root cause analysis: AI-based resource demand forecasting
Cons:
- Database monitoring not a standalone service: You have to take a package that includes many other modules as well as database monitoring
Site24x7 is charged for on a subscription model and the different plans and add-on options make it possible to create a custom package that is tailored to your business’s needs. There is even a free edition, but that doesn’t provide database monitoring capabilities. You can try out the system on a 30-day free trial. If you decide not to buy at the end of that period, your account gets switched over to the free edition.
4. Idera SQL Diagnostic Manager (FREE TRIAL)
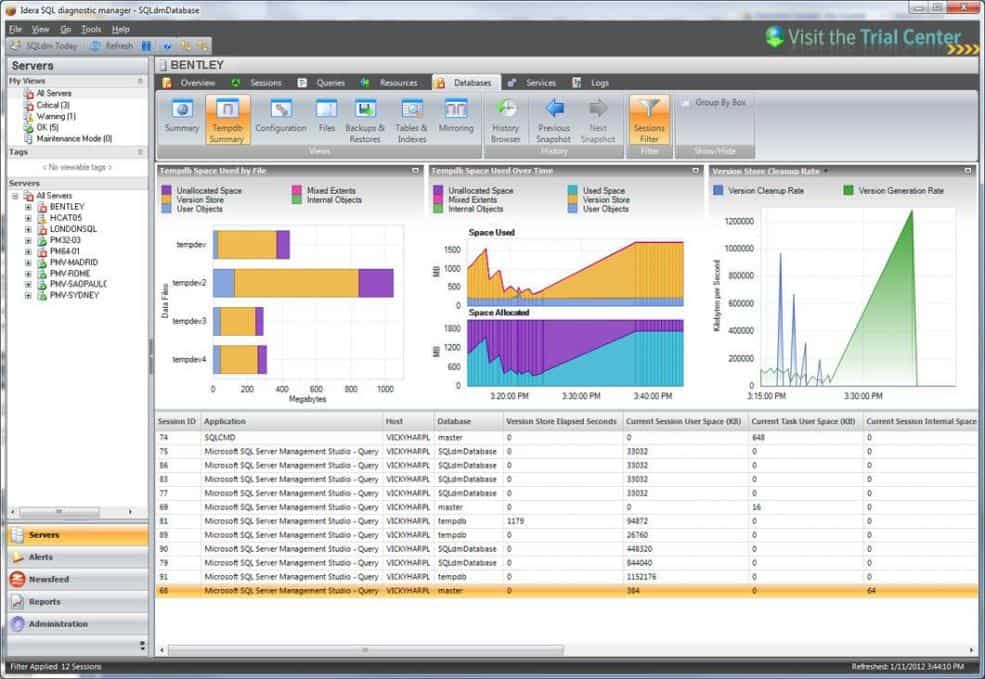
When it comes to diverse database monitoring solutions, Idera SQL Diagnostic Manager is hard to beat. This SQL monitoring tool can monitor databases in both physical and virtual environments. This program has been specifically designed to help the user view key performance metrics. Metrics you’ll encounter on Idera SQL Diagnostic Manager include CPU, Hard Disk Usage, Space, Network Usage, and Memory. This data gives you the basics you need to assess how well a database is performing.
Key Features:
- Server resource tracking: Correlation with database activity
- Transaction analysis: Provides database tuning recommendations
- SQL workload analysis: Examines resource allocations
Why do we recommend it?
Idera SQL Diagnostics Manager is offered in flavors for specific DBMSs. There is a package for monitoring SQL Server and another for MySQL. Oracle, DB2, and Sybase databases can be monitored with an Idera package called Precise. The Diagnostics Manager provides transaction analysis and server resource availability monitoring.
You can also view what is happening through the lens of transaction analysis. This allows you to view application problems in isolation. For example, SQL Workload Analysis combines granular state monitoring and query plan tuning together with recommendations. This allows you to make targeted changes to address poor performance issues.
What makes Idera SQL Diagnostic Manager a stand-out product is its alerts. Alerts notify you when certain data occurs. You can set your alert thresholds so that you are notified when specific events happen. There is also a predictive alert facility that shows a percentage detailing the likelihood that a particular event will happen.
Who is it recommended for?
These Idera tools are each specific to a DBMS, so, for example, if you run SQL Server and MySQL database, you would have to buy two packages because they don’t combine. The database monitoring systems are on-premises software packages that run on Windows and Windows Server.
Pros:
- Pre-configured views: Make monitoring key SQL metrics easy
- Query optimization: Based on execution plans
- Flexible alerts: Users can create their own alert triggers
Cons:
- Only available for SQL Server and MySQL: Doesn’t support other DBMSs
Idera SQL Diagnostic Manager is one of the most accessible products on the market. It mixes a compelling user interface available online and as a mobile app to help you monitor effectively. You can purchase the Pro version of Idera SQL Diagnostic Manager for $999 (£782). You can also download this tool as a 14-day free trial.
5. Atera

Atera is a cloud-based service that supports managed service providers (MSPs). The platform includes both remote monitoring and management (RMM) and professional services automation (PSA). So, it includes all of the software that an MSP needs to conduct its business.
Key Features:
- Designed for MSPs: Can also be used by IT departments
- Remote monitoring: Tracks network and endpoint performance
- Full-stack observability: Network, server, and application performance monitoring
Why do we recommend it?
Atera provides monitoring for SQL Server, MySQL, and Oracle instances. This capability is built into a general remote monitoring and management package for full system support. The Atera package offers a high degree of task automation to squeeze the maximum value out of the support technician wage bill.
The monitoring features of Atera include the tracking of live statuses and also database log file monitoring. Any database problems that arise will be caught by one of those two methods and converted into alerts in the system dashboard.
One of the remote management services included with the Atera RMM is the ability to manage database backup and recovery procedures through the tool. This feature doesn’t implement the backup and restore process directly – it is better to use the native procedures built into the DBMS. However, the Atera interface can interact with the DBMS of multiple vendors, which means that a systems administrator working as part of an MSP team can perform all backup and recovery tasks through one dashboard.
The Atera system can interact with the database management systems for MS SQL Database Server, MySQL, and Oracle.
As an online service, Atera is billed on a subscription basis. Prices are levied per technician per month, which makes the service ideal for a small MSP or independent technician. The prices are lower for those who opt to pay annually. However, the service has to be paid for in advance whichever billing period you choose.
Who is it recommended for?
The Atera system is delivered as a cloud package. There are two versions of the systems that cater to IT departments and managed service providers. In both cashews, there are four plans available offering different bundles of services. All plans include database monitoring. Subscriptions are priced per technician with no minimum unit requirements.
Pros:
- Monitors multiple DBMSs: SQL Server, MySQL, MariaDB, and Oracle
- Cloud-based system: The console can be accessed from anywhere through any Web browser
- Scaleable pricing: Priced per technician
Cons:
- Only performs basic performance monitoring: No SQL optimization features
Atera is available in three editions: Pro, Growth, and Power. All editions include the regular database status monitoring feature and all include database backup and recovery procedures. However, the top plan, Power, also includes the ability to store database snapshots. Atera is available for a 30-day free trial.
6. Datadog Database Monitoring

Datadog Database Monitoring is a SaaS application monitor that includes extensive database monitoring capabilities. The Datadog system includes AI machine learning techniques that establish normal performance profiles for applications and infrastructure over time. This enables the system to automatically set alert thresholds and cut down the number of notifications that administrators receive.
Key Features:
- Hosted SaaS package: Can access on-premises databases as well as those on the cloud
- DBMS integrations: Compatible with 400 database brands
- AI-based query assessments: Identifies inefficiencies
- Performance analysis: Database optimization
Why do we recommend it?
The Datadog Database Monitoring package is a SaaS package delivered from the cloud and presents a good alternative to the SolarWinds software package that you run on your own server. Both systems cover on-premises and cloud-based database instances. The only difference is that they do it from different platforms.
It includes over 400 turn-key integrations including Cassandra, Redis, PostgreSQL MongoDB, SQL Server, MySQL, and more.
Although alert thresholds are set automatically, they can be adjusted and it is also possible to create custom conditions that would trigger alerts. These can be created by combining existing performance checks by using a straightforward SQL query tool.
The performance monitor has a lot of database performance visualizations and, when combined with infrastructure or website monitoring modules, can show exactly where any performance issue in your IT system originates. The APM will cover server performance metrics as well as application delivery checks.
The screens of Datadog enable fast problem recognition through charts, maps, and color coding and they include a number of troubleshooting investigative tools. The user can reorganize graphs to create a simultaneous performance stack to make analysis easier.
As a cloud-based service, Datadog can monitor databases wherever they are. So, you can centralize the monitoring of services located on several different sites and it is also possible to watch cloud databases with this system.
There is a certain amount of service performance logging with the Datadog APN package. However, to get standard database logs and other system logs analyzed properly, you would probably need to get the company’s log management module as well – it is called Ingest.
Datadog visualizations and performance analysis reports are great for communicating the current state of your databases and their future needs to stakeholders. Information can be distributed through an integration with Slack, or through other team collaboration tools.
Who is it recommended for?
Datadog Database Monitoring has a long list of DBMS integrations. While just about every monitoring tool will interface with SQL Server and many offer MySQL, MariaDB, Oracle, and PostgreSQL, you might have to rely on Datadog if you use a very obscure DBMS. The price is based on per-host charging, which is accessible for businesses of all sizes.
Pros:
- Performance graphs: Excellent graphics options for monitoring multiple metrics
- Highly customizable dashboards: Great for NOC teams
- Cloud-based monitoring: Can be accessed from anywhere through a Web browser
- Monitors multiple DBMSs simultaneously: Can support nearly any database deployment
Cons:
- No on-premises version: Only available on the cloud
Datadog Database Monitoring and all other Datadog modules can be experienced on 14-day free trials.
7. SolarWinds Database Performance Analyzer
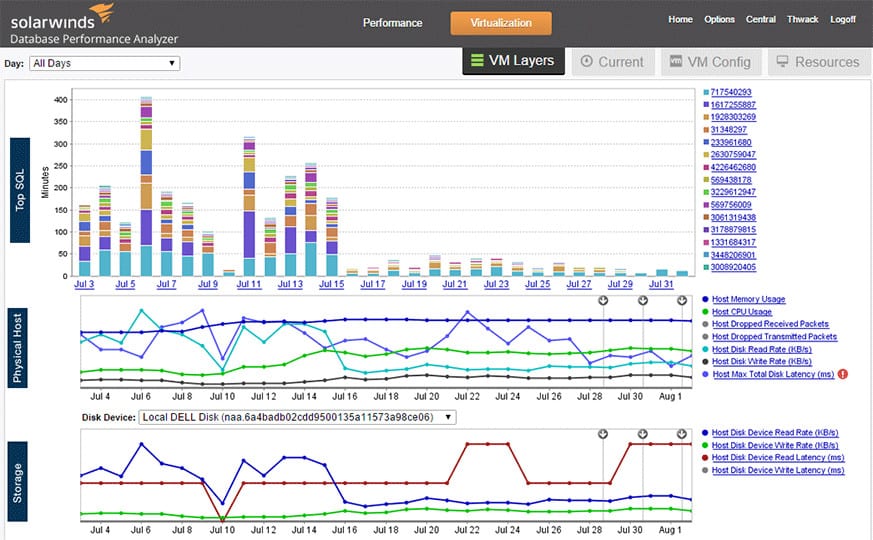
SolarWinds Database Performance Analyzer for SQL has become a core tool for network administrators looking to address database problems in real-time. You can monitor your server performance through the dashboard and verify the status of a server’s database queries, CPU, memory, disk, and sessions. Problematic devices are denoted as yellow for Warning and red for Critical. You also have the ability to view graphs of your server health to see all emerging trends.
Key Features:
- Live database monitoring: For Oracle, SQL Server, Azure SQL, MySQL, MariaDB, PostgreSQL, SAP ASE, Amazon Aurora, and Db2
- Track resource usage: Compare database activity to physical server resource usage
- Spot resource shortages: Predictive resource requirements
- Alerts for performance problems: Provides root cause analysis
- Hybrid system capabilities: Monitor on-premises and cloud databases
Why do we recommend it?
SolarWinds Database Performance Analyzer tracks activity on database instances and identifies inefficient queries and inappropriate database structures. Spot resource locks, long-running queries, missing indexes, and opportunities for denormalization with the analytical tool. It follows databases on-premises and in the cloud and can simultaneously assess different DBMSs.
What makes this platform special is its root cause analysis ability. The foundation of this is the opportunity to view how the code works. This gives you the ability to look beyond the basics through the use of multi-level permissions and group-based policies. This is a refreshing approach because it takes you away from the database metrics to look at the code beneath the surface.
It is fair to say that SolarWinds Database Performance Analyzer doesn’t fall victim to being a one trick pony either. With this tool, users can monitor a variety of databases. SQL Server, MySQL, DB2, Aurora, virtualized, and cloud databases can all be monitored through this program. The variety of options means that this program functions well in most enterprise environments.
Who is it recommended for?
If you are running many different DBMSs in different locations, you will particularly benefit from the breach of this tool. The live monitoring facility is useful but its main benefit is live analysis that spots poorly planned structures when their effects hit rather than trying to retrace events after the fact.
Pros:
- Highly intuitive DB management system: Tailored for medium to large database implementations
- Monitors in real-time: Offers alert and notification options that can integrate into popular Help Desk solutions
- Customizable dashboards: Create consoles by role
Cons:
- No SaaS option: Only available for Windows Server
If you’re looking for a database monitor that helps you to identify problems and pinpoint the cause in real-time, then this is a program you should definitely consider. SolarWinds Database Performance Analyzer is available from a price of $1,995 (£1,562). It is also available to download on a free trial.
8. dbWatch Database Control
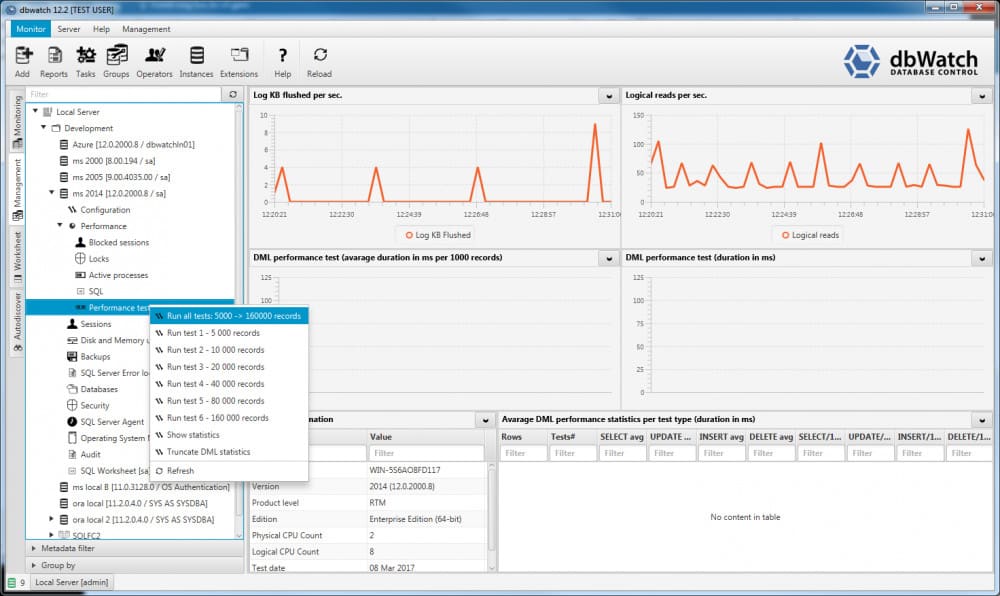
Norway-based dbWatch Database Control is a specialized database monitoring tool – it doesn’t form part of a generalized infrastructure monitor. So, this tool is a good choice if you already have all of your server and application monitoring tools in place but lack insight into the performance of your databases.
Key Features:
- Any platform: Physical, virtual, or cloud
- Maintenance Automation: Scheduled task automation scripts
- Performance alerts: For automated monitoring
Why do we recommend it?
dbWatch Database Control is able to monitor and manage SQLServer, Oracle, PostgreSQL, MySQL, Sybase, and MariaDB database instances. The system is able to manage databases running on any of your sites or on the cloud. With this tool, you can simultaneously track the performance of many databases, running in different locations and operating under different DBMSs.
The tool is implemented as an on-premises database monitoring software. You pay for a license based on the number of databases that you want to monitor. The pricing structure begins with a minimum database coverage of ten.
The tool can monitor a range of databases in real-time and it also gathers historical data for analysis and reporting. Views and reports can be accessed on each individual database, or as an overall view of the performance of all of your databases.
It doesn’t matter if you have RDMSs from several providers on your site because the tool can monitor different types of databases all at once. It can monitor SQL Server, Oracle, Sybase, MariaDB, MySQL, and Postgres databases. It doesn’t matter where those databases are because dbWatch can oversee remote and cloud-based databases as easily as it can monitor on-premises instances. It is also able to oversee SQL Server and Oracle clusters, and it can interface with Azure SQL on the cloud.
The dbWatch package is available in three service plans. These are dbWatch Essentials, dbWatch Professional, and dbWatch Enterprise. The Essentials package gets you all of the database monitoring tools. The Professional plan adds on automation for maintenance tasks and it also includes license management for SQL Server and Oracle databases. The Enterprise package includes database autodiscovery and cluster management.
Who is it recommended for?
This package is intended for use by companies that run large data centers with farms of databases. One console can manage many sites, each running many databases. In fact, it can monitor thousands of instances concurrently. Alerts draw the attention of the DBA to a problematic instance.
Pros:
- Monitors multiple DBMSs: SQLServer, Oracle, PostgreSQL, MySQL, Sybase, and MariaDB
- Supports hybrid systems: Monitores the cloud-based versions of its core DBMSs, such as Azure SQL
- Available cross-platform: Windows, Linux, and macOS
Cons:
- Minimum license requirement of 10 databases: Not for small businesses
The dbWatch software installs on hosts running the Windows, Mac OS, and Linux operating systems. You can get a 30-day free trial of the dbWatch Essentials plan to put it through its paces before buying.
9. AimBetter
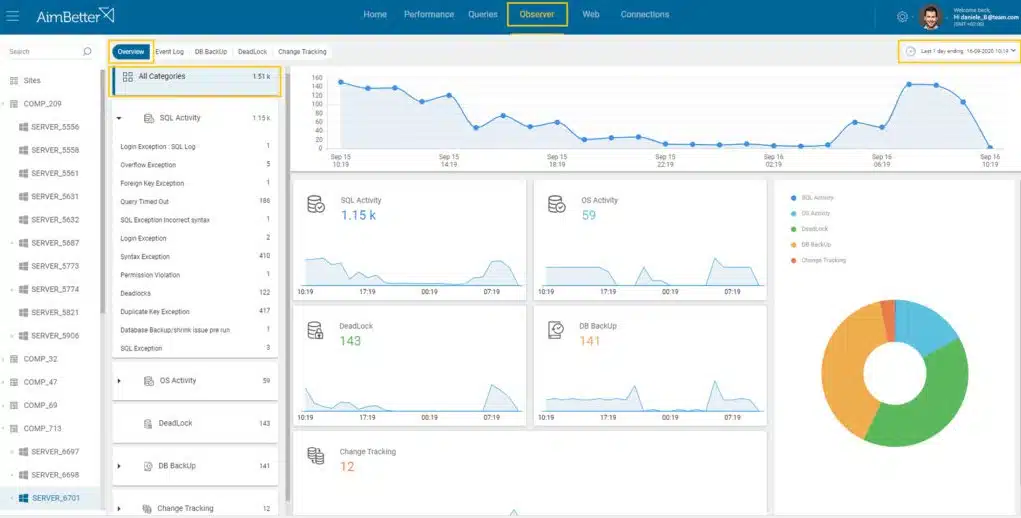
AimBetter is a cloud service that assesses databases and provides tuning solutions. The package also provides continuous monitoring and will raise an alert if a resource runs short or table records get locked. This isn’t just an automated tool because the AimBetter data center is staffed by database experts who manually examine the performance of databases run by the service’s clients. You can also choose to get those experts managing your databases full time.
Key Features:
- Monitors multiple DBMSs: SQL Server, Oracle, and SAP
- Query assessments: Provides optimization guidance
- Database tuning: Suggests indexing
Why do we recommend it?
AimBetter is a remote monitoring package for databases. This system is based in the cloud and it can supervise database instances running on other cloud platforms (Amazon and Azure) and also the SQL Server and Oracle database instances running on your own servers. The package also provides server monitoring and URL monitoring.
The AimBetter package examines the source of access to your database and the types of activity that it serves. This information can alter the design of the database and you will get advice about that. Monitoring services include the tracking of host resources beneath the database and also activity, such as index operations and record locking. The system is able to monitor SQL Server, Oracle, and SAP databases plus IIS and Windows Server.
The performance monitor watches over 400 metrics and they are stored for historical analysis. The exact data retention period depends on the services that you specify when you negotiate your quote. The maximum period available is one year.
The dashboard for the AimBetter service includes a live alert board plus a data analysis tool. This console can be accessed through any standard Web browser and AimBetter also provides a mobile app.
Who is it recommended for?
This service provides performance and security monitoring with a focus on databases but that remit also runs to server availability and resource capacity. Operating system security and Web server availability. This is actually a remote management service from a team of DBAs who will look after your databases for you.
Pros:
- An automated monitoring tool: Tracks database and server resources
- Historical analysis: Operates on stored metrics
- Managed service option: Pay for AimBetter technicians to run the monitoring package for you
Cons:
- Not available for self-hosting: No on-premises version
AimBetter is a cloud service and it is hosted, so you don’t need to download the system as a software package. The system does require agents to be installed on each server that hosts your databases. You can assess AimBetter with a free trial.
10. SQL Power Tools
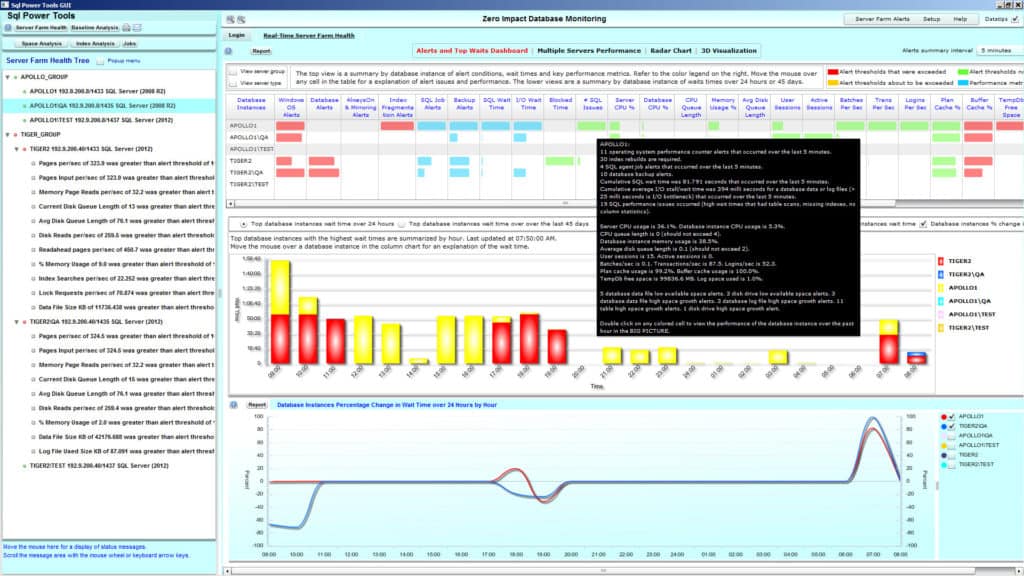
Back in 2000, SQL Power Tools began to develop a name for itself as a staple tool for all things SQL monitoring. This product remains popular as one of the most lightweight products on account of its deployment. SQL Power Tools logs database metrics including response time, destination IP, source IP application, login id, bytes sent, and packets sent etc. In short, this tool provides you with the basics to view how your database is performing.
Key Features:
- Performance logging: Monitors multiple instances simultaneously
- Server farm monitoring: Track the activity of multiple databases and servers simultaneously
- Identifies long-running queries: Offers permanence enhancement suggestions
Why do we recommend it?
SQL Power Tools is a menu of database performance and security monitoring systems. You can pick and choose from the menu of available services, taking performance monitoring, security monitoring, or both. The system will operate on databases running SQL Server, My SQL, MariaDB, PostgreSQL, DB2, Sybase, or Informix.
SQL Power Tools also delivers a high-quality experience in terms of cybersecurity. Advanced Behavioral Analysis and user Entity Behavioral Analytics help the user to identify threats and respond accordingly. If a hacker accesses your system, the breach will be identified promptly and the activity stopped ASAP.
The general monitoring experience offered by SQL Power Tools is extensive. You can look at everything from SQL wait times to stall times, blocking, and deadlocks. You can even view these in 3D graphs which makes it much easier to understand what’s going on.
Who is it recommended for?
This tool is an on-premises package and it can run on Windows, Linux, Unix, or cloud platforms. It is also available to run as a virtual appliance. Only large organizations would be interested in the package because it doesn’t monitor anything other than databases. SMBs will more likely want to get a full system monitoring package.
Pros:
- Monitors many DBMSs: DB2, Informix, MariaDB, MongoDB, MySQL, Oracle, PostgreSQL, SQL Server, and Sybase
- Security monitoring option: Activity and behavior monitoring
- Low impact: Reads network traffic rather than database activity
Cons:
- No price list: Must contact sales for pricing
SQL Power Tools is a tool that still provides a contemporary monitoring experience despite its age. However, you will need to contact the sales team to view a quote for purchasing this product. That being said, you can also download a free trial.
11. Red-Gate SQL Monitor
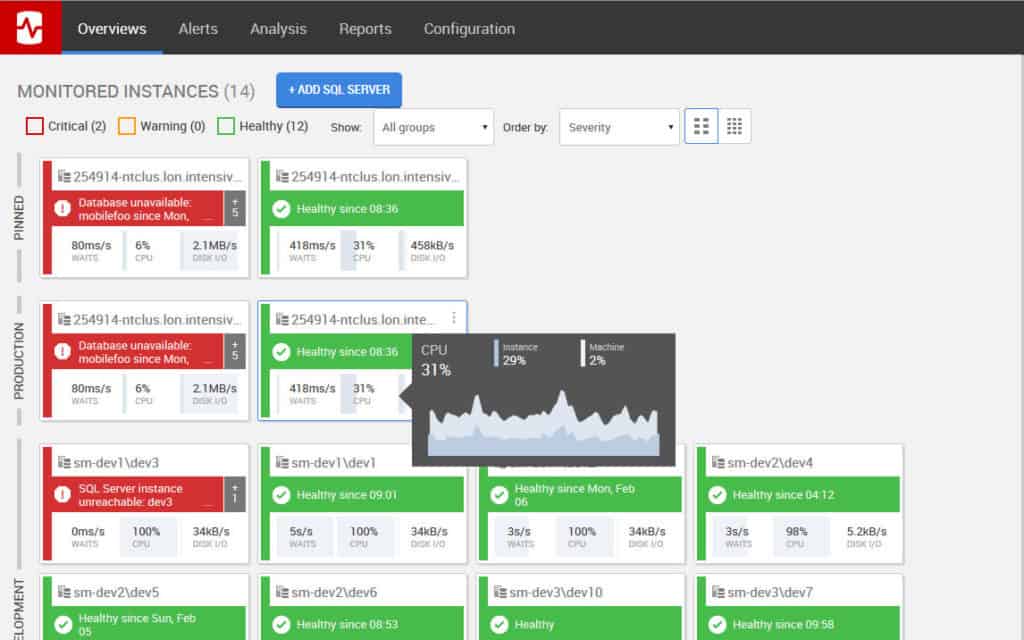
Next,we have Red-Gate SQL Monitor. Red-Gate SQL Monitor is a program that’s SQL monitoring abilities are as striking as its visual design. With this tool, you can monitor all of your SQL databases through one dashboard on the web-based GUI. Your servers will be color-coded and you can identify what their status is in seconds. There is a traffic light system with a green light for Healthy, amber for Warning, and red for Critical.
Key Features:
- Simultaneously tracks multiple database instances: Focused on PostgreSQL, SQL Server, and Azure SQL
- Simplified status displays: Traffic light status indicators
- Server resource tracking: Correlates with database activity
Why do we recommend it?
Red-Gate SQL Monitor is focused on supervising SQL Server instances. The tool is a SaaS platform and it is therefore also able to monitor cloud-based SQL Server instances, such as Azure SQL. You can also use this tool to monitor databases on multiple sites simultaneously through one console.
One of the great things about Red-Gate SQL Monitor is that the web-GUI updates every 15 seconds. This means that you can track live activity without falling behind. This is particularly advantageous for dealing with problems as they emerge in more extensive networks.
There are also a variety of alerts that you can take advantage of. You can use alerts for high CPU, memory, low disk space, SQL errors, and performance issues. In total, 40 customizable alerts come with Red-Gate SQL Monitor out of the box. This provides you with everything you need to stay on top of what is happening on your network.
Who is it recommended for?
The pricing structure of Red-Gate SQL Monitor offers a rate per database server, so it is accessible to businesses of all sizes. As it is a cloud platform, you don’t have to worry about maintaining the software. You do still need to have DBA skills on staff because it isn’t a fully managed service.
Pros:
- Multiple platforms: On-premises, on VMs, and on cloud platforms
- Customizable alerts: Prioritize different database metrics
- Discounts for multiple servers: The price per database instance reduces with more licenses
Cons:
- Doesn’t support other applications: Only SQL Server monitoring
There are a variety of pricing options available for Red-Gate SQL Monitor based on how many servers you want to monitor. If you want to monitor one to four servers then you can do so for a price of $1,495 (£1,171) per server. If this isn’t enough then you can purchase for five to nine servers for $1,271 (£995). However, you’ll need to contact the company directly if you want to see the price for 10+ servers. There is also a 14-day free trial available.
12. Lepide SQL Server Auditing

Lepide SQL Server Auditing is a product that has been used by many big names over the years. Brands from Cisco and Intel to Coca-Cola have called on LepideAuditor to protect their data over the years. This is no surprise given that this product offers one of the most complete platforms for live and historic SQL monitoring.
Key Features:
- Overview of multiple databases: Drill down for details of each instance
- Security auditing: Looks for irregular activity
- Permissions tracking: Records any changes to access rights
Why do we recommend it?
As the name explains, Lepide SQL Server Auditing focuses on monitoring SQL Server. This service enables the monitoring of multiple database instances running on many different sites in one central console. The system provides performance and activity overviews, but its main purpose is to enforce security in databases.
The user experience on Lepide SQL Server is driven through the dashboard where you can view all your SQL Servers. The dashboard has been designed so that you can see changes to configurations and permissions instantly. It also allows you to view your databases in a hierarchical format. For example, you can view your top 10 active databases and failed logins.
Lepide SQL Server Auditing is used widely for many reasons, but many administrators use it because of its cybersecurity credentials. This program allows you to monitor any changes made to user permissions. If a suspicious change has been made you will be sent an alert. These alerts operate in real-time and can even run custom scripts to allow the user to configure the automated threat response.
Who is it recommended for?
This tool is popular with very large organizations. Its greatest value is in its centralized management of many databases that are located on many sites. Small and single-site businesses won’t get as much value out of this tool. Businesses that need to prove compliance with data security standards need this tool.
Pros:
- DevOps change management: Record changes to database objects during release
- Alerts for irregular activity: Sent as push notifications and webhook integration
- Logs SQL config changes: Keeps historical records
Cons:
- No price list: Must contact sales for pricing
As far as SQL Monitoring goes, Lepide SQL Server Auditing is a program that is highly recommended for administrators looking to stay protected against external threats. To view pricing options for Lepide SQL Server Auditing you need to contact the sales team. However, there is also a demo version that you can download.
13. ManageEngine Free SQL Health Monitor
ManageEngine Free SQL Health Monitor is a tool that provides a premium yet affordable SQL Monitoring experience. With ManageEngine Free SQL Health Monitor you can monitor all versions of MS SQL including MS 2012 and MS SQL 2014. In other words, if you’re using SQL servers then this is a tool you should definitely consider deploying.
Key Features:
- Free to use: Look at the Applications Manager for a paid counterpart
- SQL Server monitoring: Monitor up to two instances
- Server resource usage tracking: CPU, memory, disk, and I/O
Why do we recommend it?
ManageEngine Free SQL Health Monitor is a great offer. However, there are a few details in the small print that make this tool-less attractive to most businesses. It only monitors versions of SQL Server up to SQL Server 2014. So, if you have the latest version, which is SQL Server 2022, you can’t use this free tool.
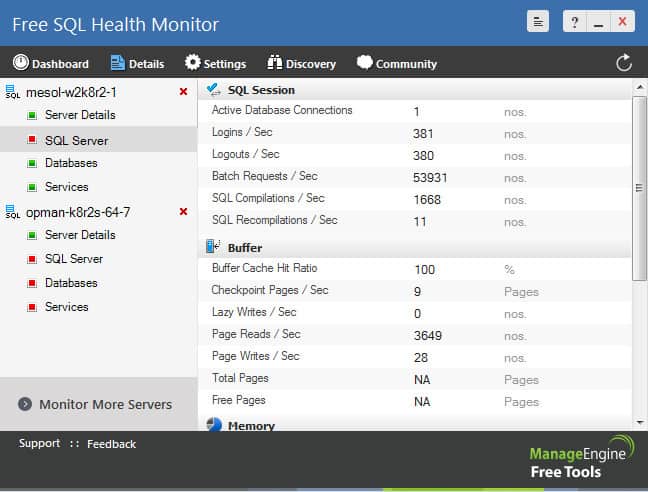
The user interface delivers the high-level production value that one would expect from a ManageEngine product. There is a clear performance monitoring dashboard where you can monitor the key metrics of your MS SQL servers with information such as CPU, memory, and disk space utilization being displayed. This provides you with a centralized location where you can take a magnifying glass to your MS SQL servers.
On the other hand, the SQL server monitoring abilities of this product allow you to view data on the log files used, active transaction data, transactions per second, and log cache hit radio. This is a healthy mix that allows you to look below the surface to solve problems. This is added by being able to set warning thresholds based on metrics like disk space, memory, and CPU.
Who is it recommended for?
This tool downloads onto Windows Server, which is the natural host of SQL Server. If you operate other DBMSs, you won’t be able to use this tool and, as explained above, you can only monitor versions up to SQL Server 2014. The tool is limited to monitoring two database instances, so it is intended for use by small businesses.
Pros:
- Live database performance tracking: Shows dials and lists of data
- Simple and easy to use: Runs on Windows Server
- Activity snapshots: Can be sent as PDFs periodically by email
Cons:
- Limited to two instances: OK for small businesses
In terms of setup, ManageEngine Free SQL Health Monitor is straightforward to set up. You can even autodiscover SQL servers throughout your network. This is massive because it means you don’t have to waste time adding servers manually. This means less time configuring and more time monitoring. You can download ManageEngine Free SQL Health Monitor for free.
Database Monitoring Tools: Our Top Picks
All of the products listed above are valuable database monitoring tools in their own right. However, if you were limited to two, we would recommend ManageEngine Applications Manager and Paessler PRTG Network Monitor.
The ability to see the root cause of performance issues is something that will help you immeasurably when going through the troubleshooting process. Rather than spending time fumbling around for solutions, you will be able to point to specifics and take the appropriate action.

