

If you think selecting a network analyzer is as simple as downloading a tool and plugging it into your system, it is better you think again. No doubt, there might be hundreds of monitoring options available in the market for network admins, IT managers, and security teams to choose from, each promising similar features and functionalities. Real-time traffic monitoring, packet analysis, performance optimization, security insights, etc. are some common features in a network analyzer. The only problem is how to decide which one is best for your business.
The moment you start comparing each tool, you will realize that the difference lies in how well they adapt to your business and its specific needs. That is the exact moment you will know which tool to invest in.
Today, most network teams and cybersecurity professionals find it difficult to monitor complex networks and identify blind spots. They know something’s wrong, but they can’t pinpoint where or why. And that’s where the need for a proper network analyzer really hits home. A network analyzer, also known as a packet sniffer, has become one of the demanding tools among businesses, IT teams, and cybersecurity professionals. The reason is it allows professionals to capture, analyze, and interpret network traffic. These insights further help troubleshoot network issues in real-time.
A network analyzer also allows admins to capture network packets (see our guide to PCAP) by passively monitoring network traffic or by actively injecting test packets into the network.
Some of the key pain points that have resulted in this urgent need for network analyzers by businesses and cybersecurity professionals are:
- You’re dealing with recurring latency, but have no clue what is causing it.
- Your apps are working fine in the dev environment, but suddenly crash when deployed live.
- Your team spends hours sifting through basic metrics but tracing packet behavior seems challenging.
- There’s unknown traffic moving across your network, but its source is unknown.
- Your current tools alert you but don’t explain what’s actually happening.
Investing in the right network analyzer tool will help answer all doubts and queries. The tool will resolve these issues faster and in real-time. But the question still remains the same – how to find one?
To make it easier for your B2B business, our team of experts has performed thorough research and shortlisted the best network analyzers. With these tools in hand, your business can overcome network challenges and ensure smooth, secure operations.
Our goal is to help you find a network analyzer that guarantees a safe and secure network.
Here is our list of the best network analyzers:
- ManageEngine Network Topology Tool with OpManager EDITOR’S CHOICE Visualizes network architecture, enabling real-time monitoring, performance analysis, and troubleshooting. It enhances network visibility, simplifies fault detection, and ensures efficient network management. Available for Windows Server, Linux, AWS, and Azure. Get a 30-day free trial.
- Site24x7 Network Traffic Monitoring (FREE TRIAL) This cloud-based service scans a network for all devices, records their total capacity, and then tracks traffic volumes per interface. Start a 30-day free trial.
- Paessler PRTG (FREE TRIAL) This monitoring package is a bundle of monitors, which are called sensors. One sensor, called a packet sniffer, notes packet header contents but does not capture them. It installs on Windows Server. Download a 30-day free trial.
- Wireshark The number one packet analyzer for technicians, hackers, penetration testers, and developers. This free tool runs on Windows, macOS, and Linux.
- SolarWinds Network Performance Monitor While the main technique used by this network monitor is based on SNMP, the system also includes a deep packet inspection function. It runs on Windows Server.
- Splunk App for Stream An add-on for a well-known network data processor. Splunk Stream can perform a full packet capture or generate metadata by reading passing packet headers. It runs on Windows, Linux, macOS, FreeBSD, Solaris 11, and AIX.
- Omnipeek A neat network monitor with some great data visualizations that sources data with a network analyzer. It runs on Windows.
- NetSpot An impressive wireless network analyzer with a signal footprint mapper.
If you need to know more, explore our vendor highlight section just below, or skip to our detailed vendor reviews.
Βest network analyzers highlights
Top Feature
Layer 2 discovery, flexible visual topology views
Price
Starts at $145 for 10 devices, annual subscription
Target Market
Businesses and large enterprises with complex networks
Free Trial Length
30-day free trial
Additional Benefits:
- Keeps network diagrams current for real-time visibility
- Provides a complete business view with multi-site oversight
- Accelerates troubleshooting, supports proactive optimization
- Minimizes downtime, maintains optimal performance
- Helps plan capacity with reporting and historical trend analysis
Features:
- Layer 2 discovery and topology visualization in radial tree, node link, balloon tree
- Autodiscovery identifies all devices, registers changes in inventory and maps
- Uses Ping and SNMP to poll devices for availability, response times, status
- Monitors servers, virtualizations, and applications such as VoIP, email, Web
- Threshold-based alerts and device error reports, notifications by email or SMS
Top Feature
Identifies top traffic generators and bandwidth hogs for optimization
Price
Starts €9/month paid annually - entry bundle, tailored price quote for Network Monitoring module via Request price quote forms
Target Market
SMBs and large enterprises seeking cloud-based monitoring
Free Trial Length
30-day free trial
Read more ▼
Top Feature
Preconfigured packet sniffers, real-time traffic visibility
Price
Starts $179 for 50 devices, pricing depends on sensors activated
Target Market
All business sizes needing versatile monitoring with packet sniffing
Free Trial Length
30-day free trial
Read more ▼
Top Feature
Performs deep packet inspection to diagnose latency and packet loss
Price
Free software, no license fee
Target Market
Businesses, security teams, network professionals prioritizing deep packet inspection
Free Trial Length
Free tool
Read more ▼
Top Feature
Generates dynamic intelligent maps of hybrid network topologies
Price
Negotiated price
Target Market
Large organizations needing scalable robust network monitoring
Free Trial Length
30-day free trial
Read more ▼
Top Feature
Analyzes live traffic, exposes bandwidth use, IP pairs, latency
Price
No pricing listed on app page
Target Market
Security analysts, IT operations, DevOps, network engineers needing real-time visibility
Free Trial Length
Ffree trials of Splunk Enterprise for 60 days or Splunk Cloud for 15 days
Read more ▼
Top Feature
Delivers granular multi-protocol analysis, real-time performance metrics
Price
Negotiated price
Target Market
Network engineers needing deep packet analysis and intuitive visualizations
Free Trial Length
15-day free trial
Read more ▼
Top Feature
Heatmap visualizations expose coverage gaps, interference, overlapping channels
Price
Free edition, Home $59, Pro $199, Enterprise $699
Target Market
Individuals and businesses needing Wi-Fi site surveys, wireless analysis
Free Trial Length
Free edition available
Read more ▼
Key points to consider before purchasing a Network Analyzer
With so many options available in the market, it can be difficult for a buyer to find the right tool that aligns with their business needs. Hence, we have pinpointed some of the key factors that one must look for when finalizing a network analyzer tool:
- Ease of Use and Deployment: Not every team member has extensive knowledge or skill about each product available in the market. Hence, keeping the employees in mind, buyers must invest in a tool that is easy to deploy and has a user-friendly interface. Thus, making it easier for team members and technicians to learn, use, and manage tool features and settings without extensive training. A good network analyzer would offer buyers better controls and a smooth workflow for efficient operations.
- Features and Integration capabilities: Some vendors offer similar features but what sets them apart is a key feature that manages buyer’s interests and needs. It is important for you as a buyer to go through its advanced functionalities like time-domain analysis, etc. to find your product different from the rest. Evaluate whether your selected tool offers more than common features. Also, check if it supports integration with automation software or other existing tools.
- Scalability: Another key factor that most buyers consider is scalability. If your tool is not capable enough to manage current test requirements, there is no point. Hence, opt for a tool that also scales in case of expansion or increased workload. Higher frequencies and multi-port devices are making the test environments more complex. It is important to keep the future requirements in mind when choosing a model for your business. Make sure it allows upgrades in frequency range or analyzes the network better as your measurement needs evolve.
- Community support: A network analyzer supported by a strong user community, extensive documentation, and full-time technical support can help resolve your major challenges. Some vendors even provide forums and online training to assist with troubleshooting issues. So, make sure to check these additional features in your tool.
- Frequency range and Dynamic range: Check if the frequency range and Dynamic range of the analyzer meet your requirements. Consider devices that offer a high dynamic range trace noise.
- Speed and Efficiency: In fast-moving environments, speed matters. A tool that delivers quick, accurate results reduces downtime and boosts throughput. Make sure to check its test cycle times and batch-processing capabilities to ensure your analyzer can handle the pace and deliver results without delays.
- Cost and Licensing option: It is recommended to compare different network analyzers based on their pricing structure, i.e., their model cost, software license fee, etc. Some vendors provide a complete pricing structure on their website, making it easier to calculate upfront investment and other costs.
To dive deeper into how we incorporate these into our research and review methodology, skip to our detailed methodology section.
The best network analyzers
Check our reviewed and recommended network analyzers. Get more detailed insights about each vendor which will offer you more clarity into different aspects, including their pricing model, features, and support services.
1. ManageEngine Network Topology Tool with OpManager (FREE TRIAL)
Best for: Businesses or large enterprises with complex network systems might find it a suitable option as it allows admins to perform comprehensive network monitoring with topology mapping.
Price: Available in Standard, Professional, and Enterprise editions under both annual subscription and perpetual license models. On annual subscription, the Standard edition costs $245 for 25 devices, the Professional edition costs $345 for 25 devices (with pricing starting at $145 for 10 devices), and the Enterprise edition costs $4,595 for 250 devices. OpManager also offers a 30-day free trial, a Free Edition that monitors up to 3 devices, and both a fully functional online demo and a free customized demo, while perpetual licenses with separate AMS fees and personalized quotes are available for larger environments.

ManageEngine OpManager uses an autodiscovery feature and network topology mapping to analyze a network in real-time and make all of its elements available for status checks. The system constantly revises its network exploration so any changes to the network get immediately registered in the network inventory and appear as automated alterations to the network topology map.
When we tested ManageEngine OpManager we found the following key features.
ManageEngine OpManager’s Key features:
- Real-Time Network Mapping: Automatically updates network diagrams.
- Performance Threshold Alerts: Notifies about potential performance issues.
- Autodiscovery Functionality: Identifies all network devices effortlessly.
- Server Monitoring Capability: Extends monitoring to server performance.
- Virtualization Support: Includes monitoring for virtualized environments.
Unique buying proposition
The buyers can get a complete business view of their devices from a single dashboard and perform multi-site or distributed network monitoring. A few more features that make it a valuable product for businesses are virtual environment discovery and agent-based monitoring, accessible in higher editions.
Feature-in-focus: Provides Layer 2 discovery with flexible visual topology views
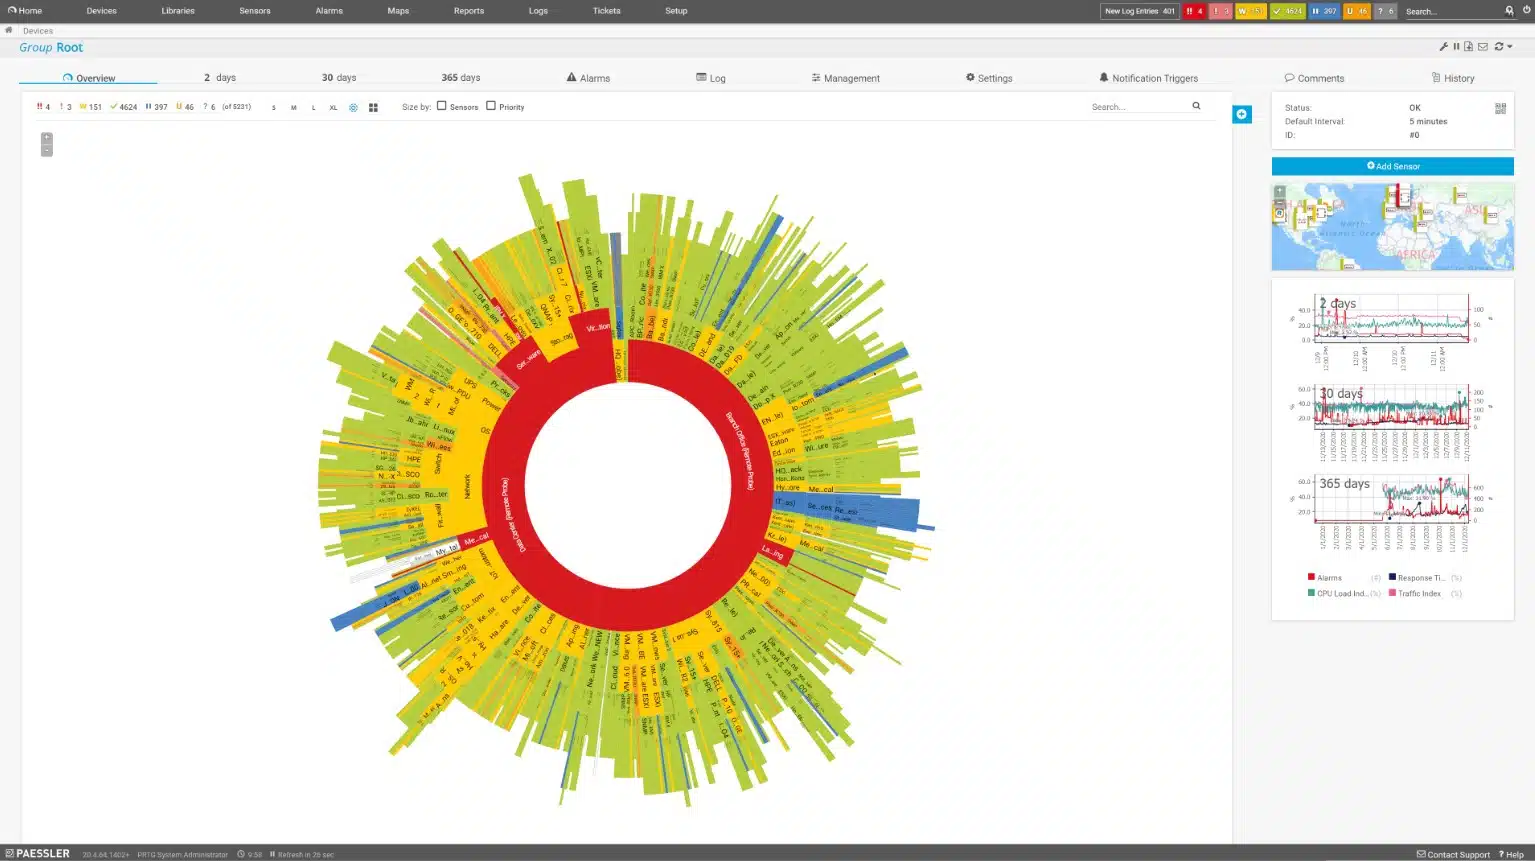
Layer 2 network discovery and topology mapping are the two key features that can make you opt for this product. These features help you get visual insights into network structure and device interconnections. You can visualize the network architecture in different models, such as a radial tree, node link, and balloon tree to understand the intra-device connectivity.
Why do we recommend it?
The ManageEngine Network Topology Tool is part of the OpManager package. This system scans the network and identifies all the devices that are connected to it. This creates a network inventory – the topology maps of OpManager are drawn up automatically from that inventory data. The package provides a choice of layout views.
The OpManager system uses Ping and SNMP to poll all network devices for availability, response times, and status reports. The service is able to detect when traffic surges are overloading network devices and includes reports on CPU, memory, and storage space availability that show the device’s ability to cope with extra load.

All monitored metrics have performance thresholds placed on them and these will trigger alerts if systems face problems. Each device can also report to the OpManager module if it faces status errors. These alerts appear in the dashboard for the service and they can also be sent out as notifications by email or SMS to IT technicians.
Who is it recommended for?
The packages for OpManager are priced for monitoring 10 devices, which is suitable for SMBs. Larger businesses pay for more capacity. The system is able to monitor servers and well as networks, which provides any business with all of the hardware monitoring that they need. There is also an edition for MSPs.
During our testing, we identified the following pros and cons related to OpManager.
Pros:
- Dynamic Network Mapping: Keeps an updated view of network topology.
- Efficient Performance Alerts: Quickly alerts on performance impairments.
- Comprehensive Device Monitoring: Offers extensive monitoring of network components.
- Flexible Scaling Options: Suitable for both SMBs and larger enterprises.
- Intuitive User Interface: Simplifies network management with a user-friendly dashboard.
Cons:
- No Native Cloud Support: Lacks a direct cloud-based deployment option.
- Platform-Specific Software: Requires a specific environment (Windows/Linux) for installation.
OpManager is implemented as on-premises software that runs on Windows Server or Linux. The package also includes monitoring for virtualizations, servers, and applications, such as VoIP, email, and Web services. You can try out this monitoring system on a 30-day free trial.
EDITOR'S CHOICE
ManageEngine OpManager, with its Network Topology tool, is our top pick for a network analyzer because the utility provides real-time insights into your network infrastructure, allowing IT teams to effectively monitor, analyze, and manage network performance. One of its most important features is its ability to automatically map and visualize network topology, giving users a clear view of devices, their relationships, and network paths. The entire system discovers and documents all devices connected to the network. It also keeps constant vigilance, looking for network device component errors. OpManager’s Network Topology tool simplifies complex network management tasks by identifying issues such as bottlenecks, latency, and connectivity failures. It provides actionable insights that enable quick troubleshooting and proactive network optimization. The intuitive interface allows users to customize network maps, drill down into specific devices or links, and view device health, status, and performance metrics at a glance. OpManager integrates seamlessly with other ManageEngine products, allowing for centralized management and enhanced functionality. It supports multi-vendor environments, making it versatile for various network setups, whether on-premises or hybrid. The tool also offers detailed reporting, alerting, and automation, quickly identifying bottlenecks, misconfigurations, and potential points of failure. This ensures that IT teams can stay ahead of potential issues before they impact operations. The tool supports over 2,000 device types, making it suitable for diverse network environments, from small businesses to large enterprises. The alerting system of OpManager sends instant notifications via email, SMS, or other channels when anomalies are detected. This minimizes downtime and helps maintain optimal network performance. OpManager’s reporting and historical data analysis capabilities enable IT teams to track trends and plan for future capacity.
Download: Get a 30-day FREE Trial
Official Site: https://www.manageengine.com/network-monitoring/download.html
OS: Windows Server, Linux, AWS, and Azure
2. Site24x7 Network Traffic Monitoring (FREE TRIAL)
Best for: SMB or large enterprises who are looking for cloud-based monitoring might find it a perfect fit. The tool allows IT admins or security teams to perform real-time network traffic analysis with extensive free tools.
Price: Site24x7 Network Traffic Monitoring is delivered as part of the wider Site24x7 platform, with plans starting from €9/month, paid annually for the entry bundle. All plans include a 30-day free trial and buyers can also request a personalized web demo and a tailored price quote for the Network Monitoring module via the official Site24x7 demo and “Request price quote” forms.

Site24x7 Network Traffic Monitoring discovers all devices on a network, records their details in a network inventory, and then keeps track of traffic volumes through them. The inventory records the full capacity of each device, and so it can compare current throughput to full potential. When we tested Site24x7 we found the following key features.
Site24x7 network traffic monitoring key features:
- Capacity Utilization Monitoring: Tracks how close traffic is to network capacity.
- Automated Traffic Alerts: Notifies when traffic nears capacity limits.
- Comprehensive Traffic Analysis: Breaks down traffic by protocol, source, and destination.
Unique buying proposition
It is a popular cloud-based network monitoring tool among businesses known for real-time statistics. The tool allows admins to grab more and more insights about the network traffic and bandwidth consumption by each device, interface, or application. Also, it supports multiple flow technologies like NetFlow, sFlow, and J-Flow.
Feature-in-focus: Identifies top traffic generators and bandwidth hogs for optimization
The ability to identify top traffic generators and bandwidth hogs through customizable dashboards and reports is one of its unique features. These insights allow administrators to identify areas for improvement in real-time.
Why do we recommend it?
Site24x7 Network Traffic Monitoring is easy to set up because the tool populates its own network inventory automatically. This makes the service very accessible, even for business owners who can’t afford a network manager. The tool keeps an eye on traffic throughput volumes and raises an alert if the load approaches full capacity.
The Site24x7 cloud console installs a data collection agent on the network at enrollment. This queries switches and routers for traffic data by deploying flow protocols. These systems enable switches to accumulate activity information that is just sitting there for the taking. The platform uses the NetFlow, IPFIX, sFlow, J-Flow, cFlow, AppFlow, and NetStream protocols.
The on-site agent uploads traffic data to the Site24x7 server where it is organized into tables and graphs for the live monitoring service in the package. Data is also stored and can be recalled for capacity planning and other analysis projects. The traffic data can be segmented by protocol, source, and data to identify the biggest source of traffic.
Who is it recommended for?
This package automates network monitoring. Traffic volumes are compared to total system capacity and the tool will raise an alert if traffic is reaching full capacity. Alerts can be forwarded to technicians by email, voice call, SMS, or Slack message, so the support team doesn’t have to watch the monitoring console all the time and can get on with other system management tasks.
During our testing, we identified the following pros and cons related to Site24x7.
Pros:
- Easy Setup: Automatic device discovery simplifies initial configuration.
- Multi-Vendor Compatibility: Functions across various network device brands.
- Full-stack Observability: Part of a broader suite of monitoring tools.
- Advanced Traffic Insights: Provides detailed traffic analysis for informed decisions.
Cons:
- Lack of On-Premises Option: No option for local, on-site deployment.
The Site24x7 platform offers plans that combine multiple modules along with the network traffic monitoring unit. You can assess the service by accessing a 30-day free trial.
3. Paessler PRTG (FREE TRIAL)
Best for: If you want to invest in a versatile monitoring tool that comes with packet sniffing capabilities, Paessler PRTG can be a perfect solution. The tool offers plans for all business sizes, making it a great option.
Price: Paessler offers 5 different plans for different organizations. For example, small organizations can invest in the starting packaging at $179 which allows businesses to monitor up to 50 devices. For small and mid-size businesses, a $325 package allowing up to monitoring 100 devices can be a good match. For 250 devices, medium-size environments must proceed with a $675 package. For 500 devices, a $1,183 package can be a good option allowing large businesses to monitor their complex networks. If you need a more advanced version that allows monitoring 1000 devices, we recommend trying the $1492 package.

Paessler PRTG is a three-in-one system monitor that monitors networks, servers, and applications. The package is a bundle of monitors, each called a sensor. The price of the service depends on how many sensors the user wants to turn on.
When we tested Paessler PRTG we found the following key features.
Paessler PRTG’s key features:
- Traffic Categorization: Segregates traffic data for clearer analysis.
- Visual Representations: Uses dials for intuitive traffic monitoring.
- Detailed Traffic Insights: Offers granular data on network traffic.
Unique buying proposition
From a buyer’s standpoint, Paessler PRTG’s unique buying proposition is the ability to combine various monitoring technologies (SNMP, WMI, NetFlow, sFlow, jFlow, IPFIX) with customizable alerts and dashboards. Thus, providing real-time statistics of networks and devices.
Feature-in-focus: Provides preconfigured packet sniffers for real-time traffic visibility
PRTG Network Monitor offers preconfigured packet sniffer sensors that allow administrators to gain deep visibility into network traffic without the need for complex manual configurations. These sensors capture packets directly from the network interface on the target device and analyze them in real-time. Also, they monitor high-level metrics rather than deep payload inspection.
Why do we recommend it?
Paessler PRTG is a package of monitoring tools, which are called sensors. You customize the package by deciding which sensors to activate. The package includes sensors for device management and others for traffic analysis with protocols such as NetFlow and IPFIX. The tool provides network discovery and automatic topology mapping.
One of the sensors in PRTG is the Packet Sniffer. A packet sniffer saves packets while a network analyzer just records packet header data. Paessler states that its packet sniffer does not record packets. Therefore, it is actually a network analyzer.
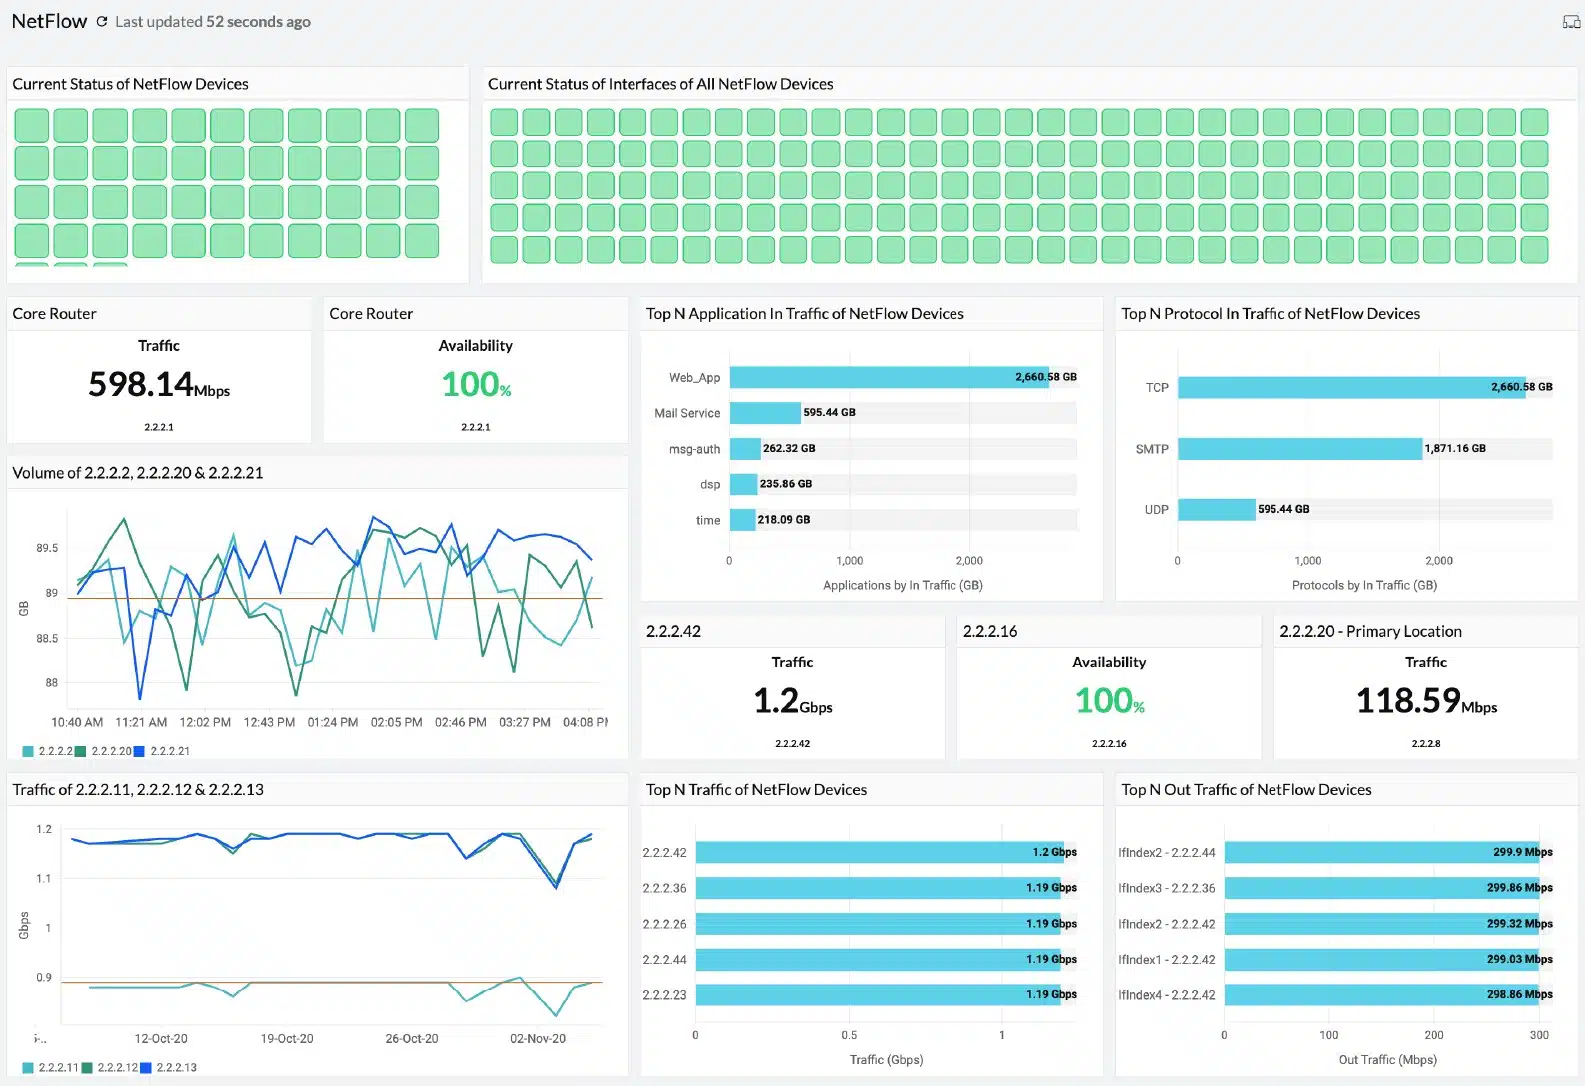
The packet sniffer sensor has its own screens in the PRTG dashboard. This shows statistics about live traffic as dials, with the speed of each category of traffic indicated. Traffic categories include mail, infrastructure, and file transfer activities.
The screens of PRTG are very attractive with colorful graphs and charts and drill-down details accessible by clicking on a feature in an overview screen. The screens for the packet sniffer can be customized and it is even possible to create entirely new screens that contain data panels from different standard screens.
Who is it recommended for?
This system is suitable for businesses of all sizes because you only have to pay for the sensors that you turn on. The package is also available for free as long as you only activate 100 sensors. The package runs on Windows Server and it is also offered as a SaaS platform.
During our testing, we identified the following pros and cons related to Paessler PRTG.
Pros:
- Versatile Monitoring Options: Provides a range of sensors for comprehensive monitoring.
- Attractive Interface: Features a user-friendly dashboard with customizable screens.
- Scalable Solution: Suitable for businesses of various sizes, with a flexible pricing model.
Cons:
- Limited Packet Analysis: Does not include a packet viewer for deeper packet inspection.
The PRTG system installs on Windows Server and can be experienced on a 30-day free trial which includes unlimited sensors.
4. Wireshark
Best for: If performing deep packet inspection is a priority for your business or security teams, investing in this network analyzer is a great option. Network professionals might find it a suitable option to monitor and analyze packets.
Price: Wireshark is free software and can be downloaded and used without paying any license fee.
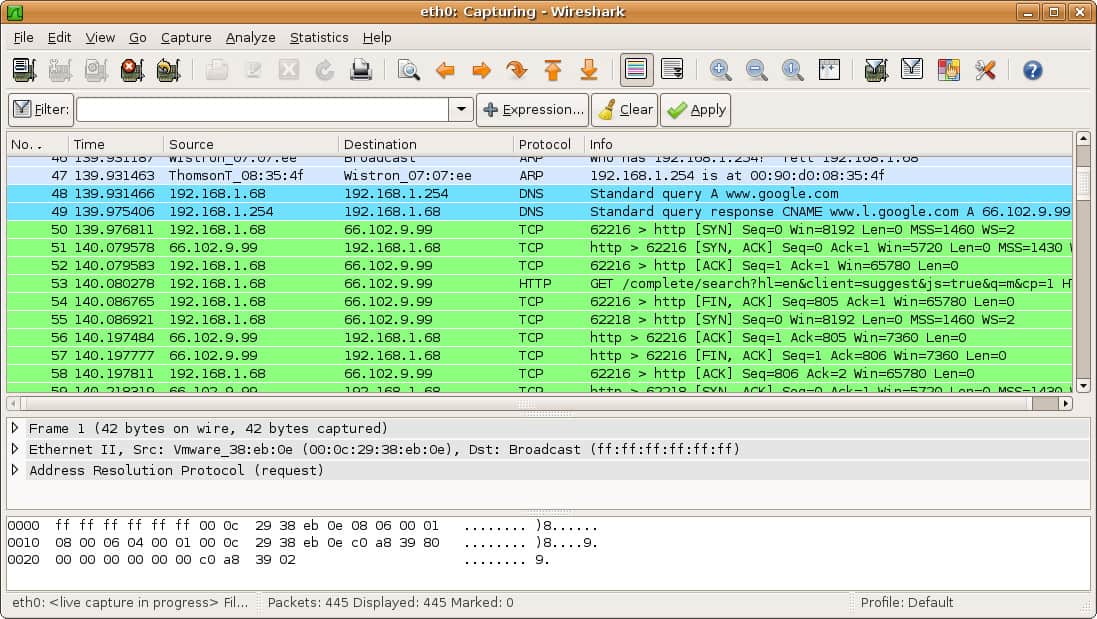
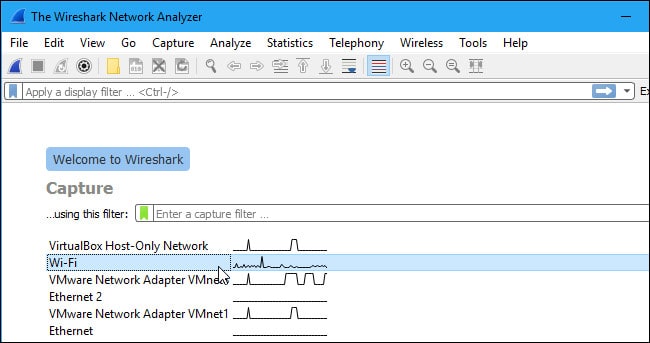
Wireshark is the leading packet analyzer. The tool is free to use and it relies on libpcap or WinPcap for packet capture but the installation package for Wireshark also installs the relevant capture program for the operating system. Using Wireshark requires training because the strength of the package is its proprietary search and filtering language, which takes time to master.
When we tested Wireshark we found the following key features.
Wireshark’s key features:
- Advanced Packet Analysis: Offers detailed inspection of individual network packets.
- Protocol-Based Color Coding: Facilitates easier identification of different protocols.
- Conversation Tracking: Allows following specific network conversations for analysis.
Unique buying proposition
Most network and cybersecurity professionals prefer this tool over others for it is a comprehensive network protocol analysis tool with support for hundreds of protocols and live capture capabilities. These features make it easier for professionals to intercept or examine data packets as they traverse the network, allowing users to inspect detailed information about communication between devices.
Feature-in-focus: Performs deep packet inspection to diagnose latency and packet loss
Deep inspection of network traffic enables admins to inspect individual data packets as they move through a network. This feature offers more than basic traffic pattern monitoring. By analyzing this data, administrators can identify the reason behind dropped packets, latency problems, etc.
Why do we recommend it?
Wireshark is the tool of choice for security analysts that want to perform manually the type of searches that SIEM tools and firewalls regularly implement. Sometimes, leaving the analysis to automated processes misses something – new tricks and even some well-known techniques, such as splitting attacks over several packets, can confound sophisticated security analysis tools.
Although Wireshark has become the application of choice for network security analysis, it also has uses for network capacity planning. In that use case, implementing a level of automation is necessary because traffic analysis works best through the accumulation of data over time.
It is possible to calculate summaries of traffic data, such as packet volume per protocol, top talkers, and external correspondents. This type of data then needs to be stored and then analyzed manually in another package, which could be a spreadsheet.
Who is it recommended for?
If you want to use Wireshark, you need to get some training, which is available online. Once you have the skills to use the tool, you will probably use it a lot. The system is often used by hackers for reconnaissance once they break into a network and penetration testers use it, too.
During our testing, we identified the following pros and cons related to Wireshark.
Pros:
- No Cost: Available for free, making it accessible for all users.
- Granular Data Analysis: Ideal for in-depth network troubleshooting and analysis.
- Customizable Filtering: Enables users to focus on specific network traffic segments.
Cons:
- Steep Learning Curve: Requires significant time and expertise to master effectively.
You can download Wireshark for free.
5. SolarWinds Network Performance Monitor
Best for: Large organizations that demand scalable and robust network performance monitoring must invest in this tool.
Price: Not publicly listed; contact Sales for a custom quote. A fully functional 30-day free trial is available.

SolarWinds includes a network analyzer tool in its Network Performance Monitor even though the main monitoring mechanism of this service is through SNMP. While SNMP provides constant live network checks, a network analyzer, called Deep Packet Inspection, is provided as Quality of Experience statistics.
When we tested Network Performance Monitor we found the following key features.
SolarWinds network performance monitor key features:
- Deep Packet Inspection: Analyzes network traffic at a granular level.
- Application-Focused Monitoring: Tracks performance based on specific applications.
- Customizable Alerts: Enables setting targets and alerts for application response times.
Unique buying proposition
Allows buyers to experience unparalleled, real-time visibility across your entire IT landscape—on-premises and hybrid. With NetPath™, visualize and pinpoint critical network paths and performance bottlenecks before they impact users. Further, effortlessly auto-map your hybrid infrastructure using intelligent mapping, and go deeper into diagnostics with PerfStack™, enabling detailed performance analysis across time and metrics.
Feature-in-focus: Generates dynamic, intelligent maps of hybrid network topologies
Automatically generates dynamic, intelligent maps of your on-premises and hybrid network environments. This powerful feature simplifies network management by offering clear, real-time visualizations of your infrastructure, enabling you to monitor performance, identify issues faster, and maintain full control over complex, distributed networks.
Why do we recommend it?
SolarWinds Network Performance Monitor keeps track of the statuses of network devices by implementing the Simple Network Management Protocol. The tool also uses Ping and packet header protocol analysis to draw up a network topology map and create a network inventory. This system identifies equipment issues that can damage network performance.
The DPI service is what is often called “protocol analysis”. It examines traffic per application, which is information that can be derived by looking at the destination port number written into each packet header. The network analyzer demonstrates response times per application and the user can set delivery time targets and create custom alerts for these goals.

As well as showing the traffic for each individual application, the screens aggregate data by application category. It creates grouped statistics that indicate business or social use. However, it is difficult to work out how accurate that information can be – “social” doesn’t necessarily mean personal use. For example, menu businesses use social media for platforms and many business applications can also be used for personal use.
Who is it recommended for?
This package is very comprehensive and it is suitable for large organizations that have networks that are too big to monitor manually. Automated alerts draw the administrator’s attention to devices that are experiencing problems. A small business with few devices would not need this system. The software runs on Windows Server.
During our testing, we identified the following pros and cons related to Network Performance Monitor.
Pros:
- Comprehensive Network Analysis: Provides in-depth analysis through SNMP and DPI.
- Real-Time Monitoring: Constantly updates on network status and device performance.
- Application Response Tracking: Monitors and reports on individual application performance.
Cons:
- No Cloud Version: Lacks a Software as a Service (SaaS) option, limiting accessibility.
- Windows Server Dependency: Requires Windows Server for installation, restricting platform choice.
The software for the Network Performance Monitor installs on Windows Server. The tool is available on a 30-day free trial.
6. Splunk App for Stream
Best for: Security analysts, IT operations, DevOps teams, and network engineers who need real-time visibility into network traffic for threat detection, performance monitoring, and deep troubleshooting. Even organizations already using Splunk can invest in the tool for detailed insights.
Price: The official Splunk App for Stream listing shows a “Log in to Download” button but does not state any pricing or plan structure for the app on the page.
Splunk is a very widely-used network monitor. The Splunk methodology involves deriving network performance statistics and then saving them to a file. Those records are then interpreted for view by the user in the system dashboard.
When we tested Splunk App for Stream we found the following key features.
Splunk App for Stream key features:
- Header Data Recording: Focuses on capturing packet header information.
- Splunk Integration: Seamlessly integrates with Splunk for enhanced analysis.
- Broad Protocol Support: Compatible with multiple flow protocols like NetFlow and IPFIX.
Unique buying proposition
The Splunk App for Stream enables organizations to capture and analyze network data in real-time, supporting over 30 protocols and 300 commercial applications. It eliminates the need for expensive hardware or packets, offering a cost-effective and scalable solution for both cloud and on-premises environments.
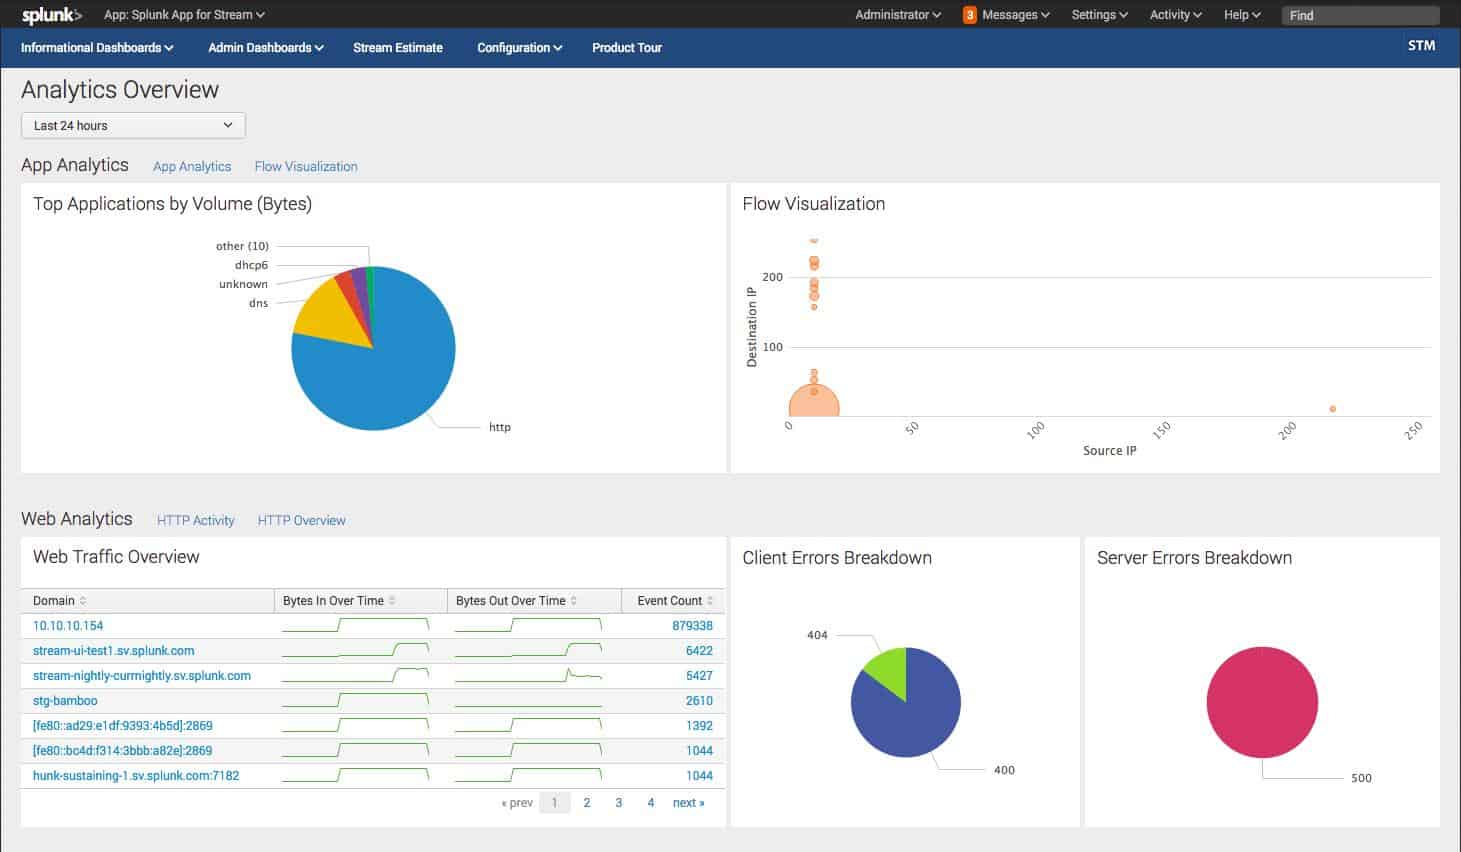
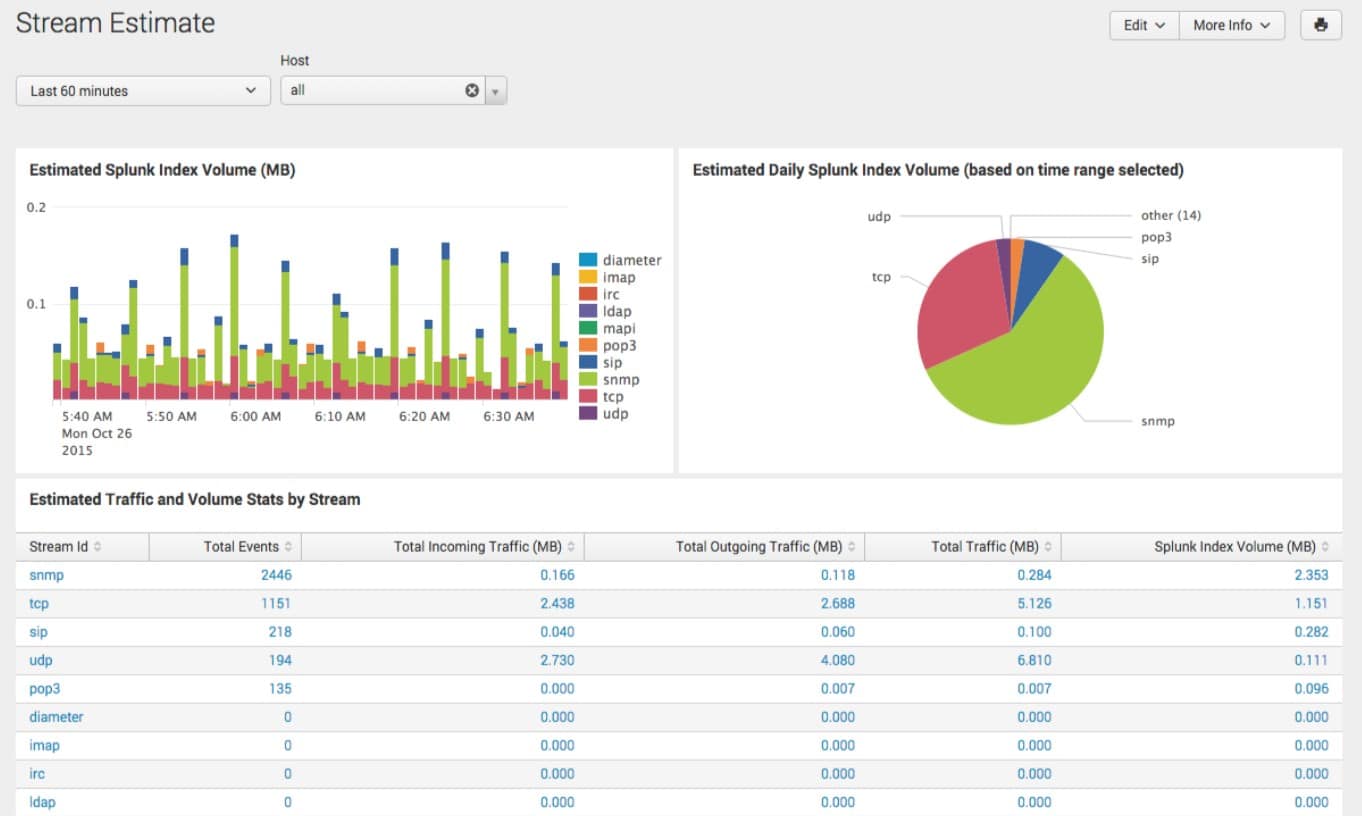
Feature-in-focus: Analyzes live traffic to expose bandwidth, peers, performance
Allows buyers to collect and analyze data directly from network traffic as it flows. Once the data is captured, the tool decodes, categorizes, and analyzes it to extract meaningful metrics, i.e., which applications and services are using bandwidth, who is communicating with whom (IP pairs), latency issues, packet loss, etc.
Why do we recommend it?
This add-on provides a method to move live network traffic data into a Splunk analysis project. Splunk can perform data analysis on any source but you have to get that data into a file before Splunk can act on it. This is the purpose of the Splunk App for Stream.
The Splunk system is very flexible and can be expanded by add-ons, which are called apps. One of the apps available for Splunk is called Splunk App for Stream, which is free. Splunk App for Stream is a network analyzer that gathers detailed stats about network traffic.
Who is it recommended for?
Splunk App for Stream provides a way to feed live network data into Splunk, which is a data analysis tool that normally operates on files. This system is only available as an add-on to Splunk Enterprise Security, which is a SIEM package. While Splunk App for Stream is free, Splunk Enterprise Security isn’t.
During our testing, we identified the following pros and cons related to Splunk App for Stream.
Pros:
- Libpcap/WinPcap Integration: Interfaces efficiently with packet capture libraries.
- Complementary Tool: Enhances Splunk’s capabilities at no extra cost.
- Extensive Protocol Support: Facilitates comprehensive network traffic analysis.
Cons:
- Limited Free Usage: The free version of Splunk is restricted to a trial period only.
Splunk is available in both free and paid versions. The paid version of the service is called Splunk Enterprise. The software for Splunk can be installed on Windows, Linux, macOS, FreeBSD, Solaris 11, and AIX and there is also a cloud-based SaaS version, called Splunk Cloud. Splunk offers free trials of Splunk Enterprise for 60 days or Splunk Cloud for 15 days.
7. Omnipeek
Best for: Network engineers who are in need of conducting deep packet analysis and troubleshooting issues related to network or security must try out this tool. Also, if they need intuitive visualizations for each analysis.
Price: Pricing is not publicly listed; you need to request a quote from LiveAction, and the official site offers a free 15 day Omnipeek trial and the option to request a demo.
While the previous three tools on this list offer a network analyzer as an extra feature to their network monitoring system, Omnipeek is a pure network analyzer. The full description of this system is a network protocol analyzer. This is because the main advantage that network analyzers have over SNMP network performance monitors is that they can see the port information in the packet header and port numbers can easily be interpreted into protocols and, therefore, applications.
When we tested Omnipeek we found the following key features.
Omnipeek’s key features:
- Real-Time Traffic Analysis: Offers instant insights into network traffic.
- Advanced Analytical Tools: Equipped with sophisticated features for deeper analysis.
- Comprehensive Protocol Support: Analyzes a wide range of network protocols.
Unique Buying Proposition
In my professional opinion, what sets Omnipeek apart is its use of advanced visualizations—such as traffic heatmaps, flow charts, and protocol breakdowns—that help users quickly identify patterns, anomalies, and potential issues. Additionally, the platform includes built-in expert analysis tools that automatically flag unusual behavior, suggest root causes, and guide users through troubleshooting processes.
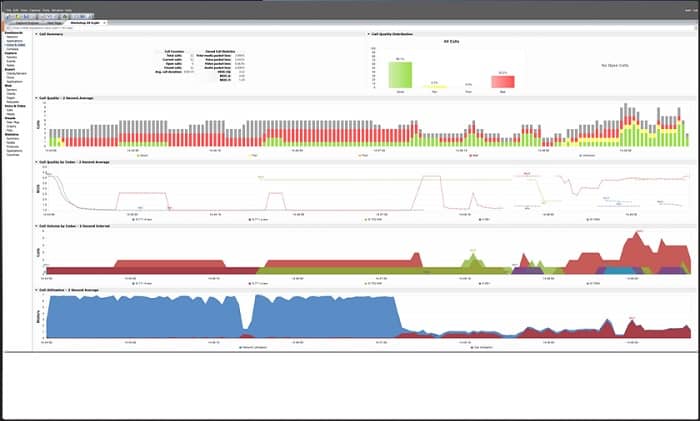
Feature in Focus: Delivers granular multi-protocol analysis with real-time performance metrics
What really stands out to users is Omnipeek’s comprehensive protocol analysis, which allows network administrators to examine traffic at a granular level across hundreds of protocols. As data flows through the network, Omnipeek provides real-time statistics—such as packet loss, latency, jitter, and throughput, enabling immediate visibility into performance metrics.
Why do we recommend it?
Omnipeek is a product of LiveAction, which calls the tool “the world’s most powerful network protocol analyzer.” It captures packets and categorizes them according to the contents of their headers. This is a Transport Layer analysis that goes beyond just noting the port numbers of each packet.
Omnipeek is a very impressive network traffic monitor with excellent visualizations of live data and additional analytics screens. Traffic data is presented as an overview with statistics available per application. A live data flow graph also shows traffic response times as they adjust with each packet sample. Each application element in the overview is an active link through to a details screen that shows more statistics for the chosen protocol. The main concern of Omnipeek is response times per protocol and traffic volumes.
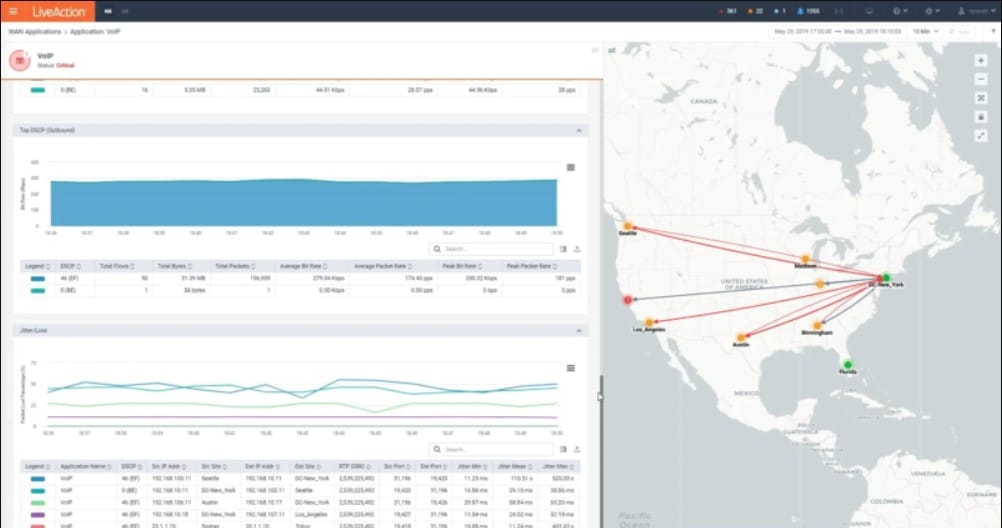
The system can be extended by plugins that include topology maps and actual world map views of WANs. The service is available as software or as an appliance. There is also a USB device available for Omnipeek that will scan wireless networks for protocol data.
Remote networks can be monitored centrally with the installation of an agent program. This facility also makes Omnipeek a suitable tool for Managed Service Providers (MSPs). The system also includes a remote control mechanism that gives support center technicians direct access to remote endpoints for troubleshooting – another facility that makes Omnipeek attractive to MSPs.
Who is it recommended for?
This tool provides live feedback on traffic over a network. It shows line graphs of traffic volumes per protocol. This can be useful information if your network frequently gets overloaded because you need to know exactly which traffic is hogging all of your bandwidth. This software runs on Windows.
During our testing, we identified the following pros and cons related to Omnipeek.
Pros:
- Protocol-Specific Analysis: Excels in detailed protocol and application-level monitoring.
- Dynamic Traffic Visualization: Provides live, graphical representations of network activity.
- Hardware Option Availability: Offers both software and appliance-based solutions.
Cons:
- No Packet Storage: Does not include capabilities for packet data storage.
Omnipeek installs on Windows and Windows Server and it is offered on a 30-day free trial.
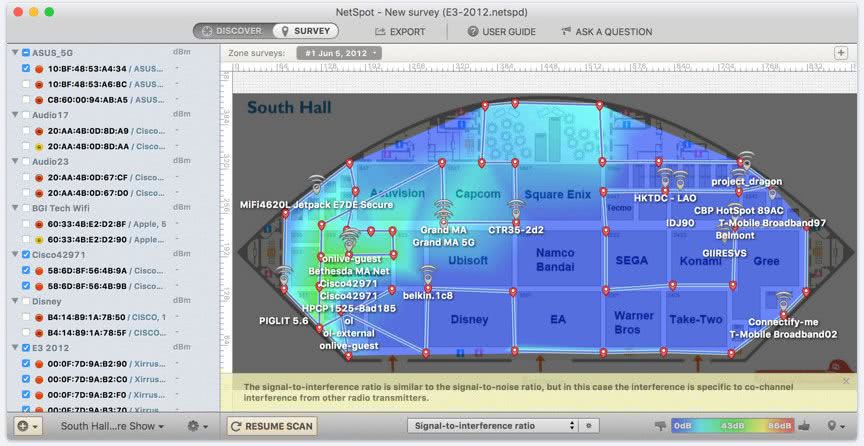
8. NetSpot
Best for: Individuals and businesses needing Wi-Fi site surveys and wireless network analysis might find it a suitable option.
Price: Buyers can either download the free NetSpot edition or purchase Home, Pro, and Enterprise licenses priced at $59, $199, and $699 respectively on the official site.
NetSpot is one of many wireless network analyzers available on the market but it is arguably the most appealing because it is available in free and paid versions and it is suitable for both home and business use.
When we tested NetSpot we found the following key features.
NetSpot’s key features:
- Wireless Network Monitoring: Specializes in analyzing Wi-Fi networks.
- Signal Strength Mapping: Visualizes wireless signal coverage across locations.
- Freemium Model: Offers both free and paid versions for different needs.
Unique Buying Proposition
NetSpot offers a user-friendly interface that simplifies the process of conducting Wi-Fi site surveys, making it accessible even for users without deep technical expertise. With just a few clicks, users can collect real-time data on wireless signal strength throughout a physical space. The platform then generates intuitive heatmaps that visually represent signal distribution, making it easy to identify strong and weak coverage areas.
Feature in Focus: Visualizes Wi-Fi coverage to expose gaps, interference, overlapping channels
NetSpot’s heatmap visualizations provide a powerful way to assess Wi-Fi signal strength across any physical environment. By collecting data from multiple points in a space, NetSpot generates color-coded maps that clearly display signal intensity. When comparing this to other products, users will notice that heatmap generation feature can help users instantly identify coverage gaps, areas of interference, and overlapping channels.
Why do we recommend it?
NetSpot is a free wireless network analyzer and there is a paid version, called NetSpot Enterprise. The tool runs on Windows and macOS. You will get more from this tool if you install it on a laptop because if you can move around with the NetSpot software running, it will map wireless signal strength.
The console of the service has two main views. One is a table showing all of the nearby wireless devices and the second is a plan view of the property. The plan view is a very attractive feature. However, it needs to be set up. The user needs to get a floorplan of the property into the system that is difficult to match up with the way that NetSpot sees its surroundings. Without a custom floor plan, NetSpot shows a default location layout, which, of course, will have no relation to the actual floor plan of the premises.
NetSpot installs on Windows and macOS. As well as the free version, there are three paid editions, with progressively more expensive versions including more features. There is no free trial offer of the paid versions because potential customers can just download the free edition for that purpose.
Who is it recommended for?
Anyone who runs a wireless network will benefit from using NetSpot. Its ability to report on capacity and interference is very useful. However, the option of moving around and getting a report on signal strength in different locations is a bigger benefit. The NetSpot app for Android is actually a different product.
During our testing, we identified the following pros and cons related to NetSpot.
Pros:
- Wireless-Focused Analysis: Excellently suited for Wi-Fi network diagnostics.
- Interactive Signal Maps: Provides detailed visualizations of wireless coverage.
- Accessible for All Users: Free version makes it easily available for personal or small business use.
Cons:
- Complex Setup for Floor Plans: Requires effort to accurately align floorplans with signal data.
Choosing a Network Analyzer
If the statistics are gathered in a well-indexed way with lots of detail added to each metric, then time segments can be reassembled to create very insightful graphs of traffic. This can occur without having to search through the actual traffic all over again.
Why aren’t all network monitors categorized as network analyzers?
There are four types of network monitors:
- Performance monitors that use SNMP queries to get statistics from network devices
- Network testing tools, such as Ping and Traceroute
- Packet sniffers that capture packets
- Network analyzers that examine passing packets
Some network monitoring tools include a blend of these tools and some offer a bundle of network monitoring methodologies from which the user can choose.
The advantage of network analyzers is that they derive statistics from passing traffic without needing to store that traffic. Letting packets pass by doesn’t necessarily mean that all chances for historical analysis are lost.
Right-sizing network analyzers
The choice of network analyzers is very broad. That’s because there are so many different types of companies and budget and size are two other influencing factors when meeting requirements with the right tool.
The great thing about the large range of network analysis systems that are available is that there are tools that everyone will use when managing a network and then tools for technicians and others for busy system managers.
Tools that provide packet capture are only of interest to developers and technicians working on specific investigations, such as penetration testers. Automated traffic pattern tracking tools are not much good for those who want to see packet-level details, but they are real timesavers for busy systems managers. Systems that record and store traffic statistics over time can help identify bottlenecks and underutilized links. Big businesses that can afford top-level systems have packages available to them that offer all of the above functions.
Why use a network analyzer?
The most common method of network monitoring used today is through the Simple Network Management Protocol (SNMP). This system queries network devices, such as switches and routers, for network traffic information.
Centralizing the data
The reason that SNMP is so popular is that all network device manufacturers include an SNMP agent in the firmware of their equipment. All the system lacks is a central SNMP manager to demand reports from device agents and interpret them. So, the producers of network monitoring tools just need to write that central manager in order to access a rich source of network information. This includes the make and model of each device and how they link together, which immediately creates a network inventory and a network topology map.
Many network monitoring tools include SNMP, testing tools, such as Ping and Traceroute, and a network analyzer. SNMP is a great source of information on device statuses and throughput statistics. However, it doesn’t provide actual information about the packets that pass through the devices.
Reducing packet sniffing waste
Packet sniffers are useful for examining passing traffic because the user can actually read each packet in a viewer and examine it. The problem with packet capture systems is that they can get out of hand very quickly. If the capture function is left on for more than a couple of minutes, the storage file for those packets gets enormous. It isn’t feasible to get a day’s worth of packets to look at traffic patterns around the clock.
Most data payloads nowadays are encrypted for security, so packet sniffers that copy all of every packet just manage to store a large number of undecipherable characters. A more efficient option is to copy the header of each packet and that cuts down a lot of the volume of data that needs to be stored.
Reducing storage and DPI
Even that more efficient strategy of reaping only packet headers is a little wasteful. Very little in a header is of any interest. Rather than storing a header, the packet analyzer just notes down the values of those useful fields, reducing storage to a fraction of that needed for a packet sniffer.
You might end up using a network analyzer without realizing it. Security software, including firewalls, use network analyzer techniques. With security systems, the examination of packet headers is called “Deep Packet Inspection” (DPI). While network analyzers note down data from passing packets, firewalls will search for specific identifiers and block packets that match or, in some cases, block packets that don’t match.
Our methodology for choosing Network Analyzers
Today, demand for network analyzers is rising with the increasing network complexity. Several network analyzer tools are available from which you can choose. But, determining the right one for your business that aligns with your business requirements can be challenging. Hence, we have prepared a list of factors that can make the comparison and evaluation process simpler.
1. Traffic Communication Protocols
One of the key features that most businesses demand in a network analyzer is its ability to work with a variety of flow protocols. Whether it’s NetFlow, sFlow, J-Flow, IPFIX, NetStream, or AppFlow, the tool must be capable enough to communicate with switches using these standards. Thus, offers a complete view of networks.
2. Packet Capture Flexibility
The tool must have the ability to capture packet streams, just headers, or sample periodic packets. Some tools allow you to capture the entire packet stream, meaning you can see every bit of data transferring through your network, while others give you the option to capture only the headers of packets, which include source, protocol, etc. Having these options ensures flexibility, allowing network teams to adjust the level of monitoring based on their needs.
3. Traffic Surge Alerts
Unusual traffic spikes can be a concern. It could be a security threat or network performance bottleneck. With a good network analyzer that provides real-time alerts, network administrators can act fast and prevent downtime.
4. Path Analysis for Bottlenecks
Identifying issues in complex networks has always been a challenge. However, investing in a tool that provides advanced path analysis can be a good strategy. Hence, buyers should prioritize tools that can trace the flow of data across nodes and perform root cause analysis.
5. Protocol Inspection
Receiving traffic is not only what businesses should focus on but also understanding what that traffic is doing. Make sure to invest in a tool that allows network administrators to perform comprehensive protocol analysis and detect unauthorized applications in real-time and troubleshoot issues.
6. Traffic shaping support
The best network analyzers not only help you identify network problems but also offer features to implement traffic shaping or Quality of Service (QoS) measures. These further help team members to optimize the performance of their network during peak loads.
7. Trial Availability
Tools that offer free trial or demo sessions allow users to test the features available on the tool. Thus, making it easier to evaluate and decide if it is a perfect fit for their business.
8. Support and documentation
Managing certain tools can be challenging for team members with less expertise and so they require support even after purchase. Tools that offer extensive documentation and full-time support services can be a great choice. Hence, cross-check if a tool offers good support services or not when finalizing software for your business needs.
9. Cost and Value
Software pricing is a key consideration when purchasing software. It is recommended to analyze and compare the pricing model of each network analyzer. A tool doesn’t need to be an expensive one, but it must deliver what it states.
Broader B2B software selection methodology
The decision behind selecting a B2B software must not be only limited to product features, but other factors must also be taken into account. We believe analyzing the company behind the product is highly crucial. That’s why our reviews are not only focused on features and pricing but consider vendors and development teams also.
Here are a few pointers that our Comparitech experts keep in mind when reviewing or evaluating a tool or product:
- Evaluate whether the software’s cost is justified by the value it provides in addressing business problems or challenges.
- Assess the software’s performance and check if it will be able to scale if your business grows.
- We also consider user feedback and reviews to understand the overall satisfaction associated with the product.
- Check if the vendor offers responsive customer support and regularly updates the software on receiving suggestions.
- We review the vendor’s transparency about the software’s features, functionality, and limitations.
Not each factor is covered in the product review. We talk about these aspects only when they stand out positively or when they can be important information for the buyer.
Check the detailed B2B software methodology page to learn more.
Why Trust Us?
Comparitech is known for its accuracy and integrity in each review or guide our team of experts publishes. Our team of cybersecurity and software testing professionals have years of experience in their fields and bring you thoroughly researched and tested information. We evaluate each tool and platform under strict criteria, helping readers or buyers make informed decisions.
We understand that reviewing only the product features is not enough, the type of customer support services post-purchase also plays an essential role. Hence, we focus on rating the product or brand based on their support services as well, making Comparitech a trusted resource for both individuals and organizations looking for expert guidance.
