
Network throughput refers to the volume of data that successfully travels through a network medium within a specific time period. It is a key metric used to evaluate the efficiency and performance of a network, providing insight into how quickly data can be transmitted between devices.
Here is our list of the best network throughput monitoring and testing tools:
- ManageEngine NetFlow Analyzer (FREE TRIAL) This traffic analysis system gives you live traffic monitoring plus analysis and traffic shaping tools. Available for Windows Server and Linux or as a service on AWS. Start a 30-day free trial.
- Site24x7 Network Traffic Monitoring (FREE TRIAL) A cloud-based service that records link capacity and traffic throughput and also provides analytical services. Start a 30-day free trial.
- Obkio This cloud-based network monitoring SaaS package implements network device status monitoring and traffic analysis, which calculates throughput for live activity an allows historical analysis.
- ExtraHop Enterprise solution with the ability to automatically detect and correlate network issues
- Comparitech Speed Test (FREE ONLINE TEST) Free and simple test that’s perfect if you just need to check one or a handful of devices.
- SolarWinds Network Bandwidth Analyzer Pack Easily monitor network traffic, identify the top talkers on your network, and prioritize bandwidth utilization.
- Iperf Open-source tool used for taking active measurements of throughput on a network.
- NetCPS – freeware bandwidth monitor. NetCPS is a Windows Command Line utility.
- Netperf – free to use and a fairly popular tool for measuring throughput and benchmarking network speeds.
For instance, if an Ethernet connection has a throughput of 30 Mbps (Megabits per second), it indicates that the network is capable of transferring 30 Megabits of data every second. This measurement is crucial for understanding the bandwidth available and the network’s ability to handle high data traffic. Those advertised hardware capacities are useful for planning networks but the volume of actual traffic also needs to be measured to check whether those systems are limiting performance.
By measuring throughput, we gain valuable insights into network performance—a critical factor that directly impacts productivity. A network with high throughput can transfer data quickly and efficiently, ensuring smooth communication and faster access to resources. Conversely, a network with low throughput can lead to delays, slower file transfers, and decreased efficiency, which can hinder productivity and disrupt workflows.
Monitoring throughput helps IT teams identify potential bottlenecks and optimize network performance. Whether for routine performance assessments or troubleshooting issues, regularly tracking throughput is essential for maintaining a healthy and reliable network, ensuring that operations run smoothly and efficiently throughout the workday.
Let’s dive into the basics of network throughput and then provide an overview of some of the more popular network throughput monitoring solutions available on the market today. You can also check out our post on bandwidth monitoring tools and learn about the difference between throughput and bandwidth.
What’s the difference between throughput and bandwidth?
The differences between network throughput and bandwidth can be confusing to many. This is understandable given how the terms are generally used and that they deal with the same subject (amount of data transmitted over a given medium).
In short, bandwidth is the maximum amount of data that can go through a given medium and throughput is the amount of data that actually goes through that medium.
If you’re shopping for internet service, keep in mind you pay your Internet Service Provider (ISP) for bandwidth and get throughput.
In practice, throughput will always be less than your bandwidth. Additionally, your throughput at a given point in time will usually not be your maximum throughput. For example, if everyone in the office is streaming high-definition video a lot more data is being transmitted than if everyone was just sending plain text emails.
One of the most helpful ways to conceptualize bandwidth and throughput is the highway analogy. Bandwidth is the number of lanes on a highway while throughput is the cars traveling on that highway. Adding lanes (bandwidth) could improve traffic speeds, but it wouldn’t solve all your speed problems. On a highway, collisions and slow-moving vehicles can slow things down. Similarly, on a network, collisions, latency, and overhead can cause delays that aren’t necessarily solved by adding bandwidth.
Measurements of Network Throughput (MB vs Mb, Gigabit speeds, etc)
There are multiple abbreviations thrown around when discussing throughput. All the different measurements somehow refer to an amount of data (usually bits or bytes) over a period of time (usually seconds). Understanding what the most popular measurements actually mean can help you better understand throughput. Below is a quick breakdown of some of the common measurements and terminology related to throughput.
- Bit – The smallest size of binary information used by computer devices. That is, the individual ones and zeros in binary math.
- Byte – 8 bits
- Megabit – 1 million bits
- Megabyte – 1 million bytes
- Gigabit – 1 billion bits
- Gigabyte – 1 billion bytes
- Mbps – Megabits per second
- MBps – Megabytes per second
- Gbps – Gigabits per second
- GBps – Gigabytes per second
One of the key takeaways here is: 1 MB is eight times more than 1 Mb. The same goes for GB vs Gb. Keep that in mind when comparing throughput statistics and ISP service plans.
Impact of latency on throughput
Latency can have a big impact on throughput. Latency is the amount of time it takes data to traverse a given path. If we think back to our highway analogy, the amount of time it takes to travel across the highway is latency. That wouldn’t matter too much if all traffic was one way, but when you start to think about it, you begin to understand how it can impact throughput. TCP relies heavily on acknowledgments, which means a receiver must acknowledge a sender for the transmissions to proceed. If it takes a long time for the packets to get back to the sender, there will be a lot of wasted time and lower throughput.
High latency can occur for a variety of reasons, from bottlenecks to the number of hops between destinations to physical distance between sites.
Impact of packet loss on throughput
If a TCP packet is dropped, it will need to be resent. This redundancy negatively impacts throughput. A sender will know that a packet needs to be resent based on timeouts or lack of acknowledgment for a given packet(s). Packet loss can occur for a number of reasons including high latency, jitter (inconsistent speeds on a connection), hardware and connection issues, or software bugs.
What throughput should I expect for a given bandwidth?
There’s no one-size-fits-all answer to this question. A number of moving parts affect throughput, so every situation is unique. With current technology, latency, and packet overhead being what they are, you won’t get speeds that match the bandwidth you purchase from your ISP.
As a “best-case scenario” reference, this CableFree article took a deep dive into maximum network throughput and determined that a 1 Gbps Ethernet connection has a potential for 94% efficiency (i.e. 940 Mbps). Enabling Jumbo Frames bumps the potential up to 99% (990 Mbps).
What can measuring network throughput help you do?
In a word: measuring throughput helps you resolve complaints about the network being “slow”. This is because throughput measurements help you better understand a network connection and its real-world performance. Throughput monitoring can help with:
- Identifying bottlenecks
- Comparing real-world performance to SLAs
- Network design and planning
- Creating baselines
- Troubleshooting
Can you forecast network throughput?
Getting a baseline of your existing throughput will help you to spot peaks and troughs in volume. If you don’t intend to add on any new services to the network, your next task will be to ensure that there are is sufficient available capacity for trend growth in traffic volumes. If you are launching an expansion project, then you should expect increased demand on your network infrastructure.
In both cases, it helps to use a tool that can replay real traffic data and also generate extra traffic volumes to check that the bandwidth that you have available will be able to cope with that new demand.
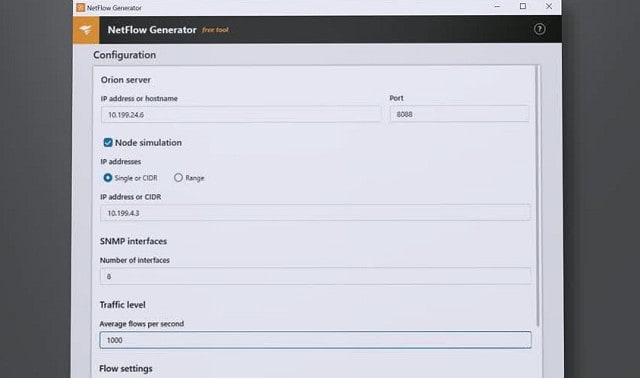
Capacity planning tools such as the SolarWinds Flow Tool Bundle come in handy in these testing scenarios. The Bundle includes three tools that work with the Cisco-invented NetFlow v5 system. When you turn on NetFlow capabilities on your Cisco router, it will forward all packet headers to a collector. You can also use NetFlow to query the router and get aggregated data out of it.
The Bundle includes an interface to turn the NetFlow capabilities on your routers on and off. A second utility will replay captured traffic around your network and a third tool in the bundle will generate fake traffic to send around the network, testing the bandwidth capacity of all of your equipment and network software as well.
How can you improve network throughput?
With an idea of what throughput is and what affects it, we’ll now talk about things that can be done to improve throughput. Again, there’s no one-size-fits-all answer; it’s important to understand the cause of your throughput problems to effectively address them. Below are some common methods employed to improve throughput.
- Increase bandwidth – Sometimes simply adding lanes to the highway is what you need. This is one of the most obvious solutions, but remember bandwidth can be expensive and might not be the root cause of your problems. Also, be sure to have the network infrastructure in place to support your bandwidth updates if you go that route. After all, a 10 Gbps connection doesn’t mean much on a network full of 100 Mbps switches.
- Eliminate bottlenecks – Network bottlenecks are points on a network that causes traffic to slow down. For example, if you update your entire network to 1 Gpbs speed, an old server with a 10 Mbps network interface may create a bottleneck.
- Update to fiber – Data on fiber connections move near or at the speed of light. Data on copper connections move significantly slower (for those of you into the science, it’s photon speed vs electron speed). Copper maxes out around 10 Gbps while fiber can reach terabit speeds or higher (check out this Engadget article for an example). While 10 Gbps is fine for most networks, fiber is much less susceptible to noise and can cover more ground than a comparable copper run, adding additional advantages that can help boost throughput.
- Adjust MTU – Adjusting MTU (Maximum Transmission Unit) sizes on a router can lead to improved throughput. For example, larger MTUs can minimize overhead and increase throughput. For more, check out this NetGear article designed to help you optimize the MTU size on a router.
- Use QoS – Configuring QoS (Quality of Service) on your routers and switches is another way to improve throughput. QoS can be used to dedicate bandwidth, manage congestion, shape network traffic, and set priorities on network traffic. For a deeper dive on the topic, check out this Cisco document. QoS doesn’t necessarily improve your throughput, it can help you make sure latency-sensitive applications (VOIP, video streaming, etc.) are less affected when things slow down.
- Use a CDN – A CDN (Content Delivery Network) can help get your content closer to users if you a dealing with a situation where many of your users are far from your servers (e.g. a website). Therefore, a CDN might be a great way to improve throughput. At the Human Health Project, we use CloudFlare as a CDN.
The best network throughput monitoring and testing tools
Our methodology for selecting a throughput monitoring and testing tool
We reviewed the market for throughput monitoring and testing tools and analyzed the options based on the following criteria:
- A service that can detect total capacity as well as current load
- The ability to communicate with switches and routers through NetFlow and other packet sampling protocols
- A system that shows live throughput statistics per link
- A utility that tests an entire path end to end
- Capacity planning utilities
- A free trial for no-risk assessment or a free tool
- A tool that is worth the time to install if it is free or worth the money if it is charged for
1. ManageEngine NetFlow Analyzer (FREE TRIAL)

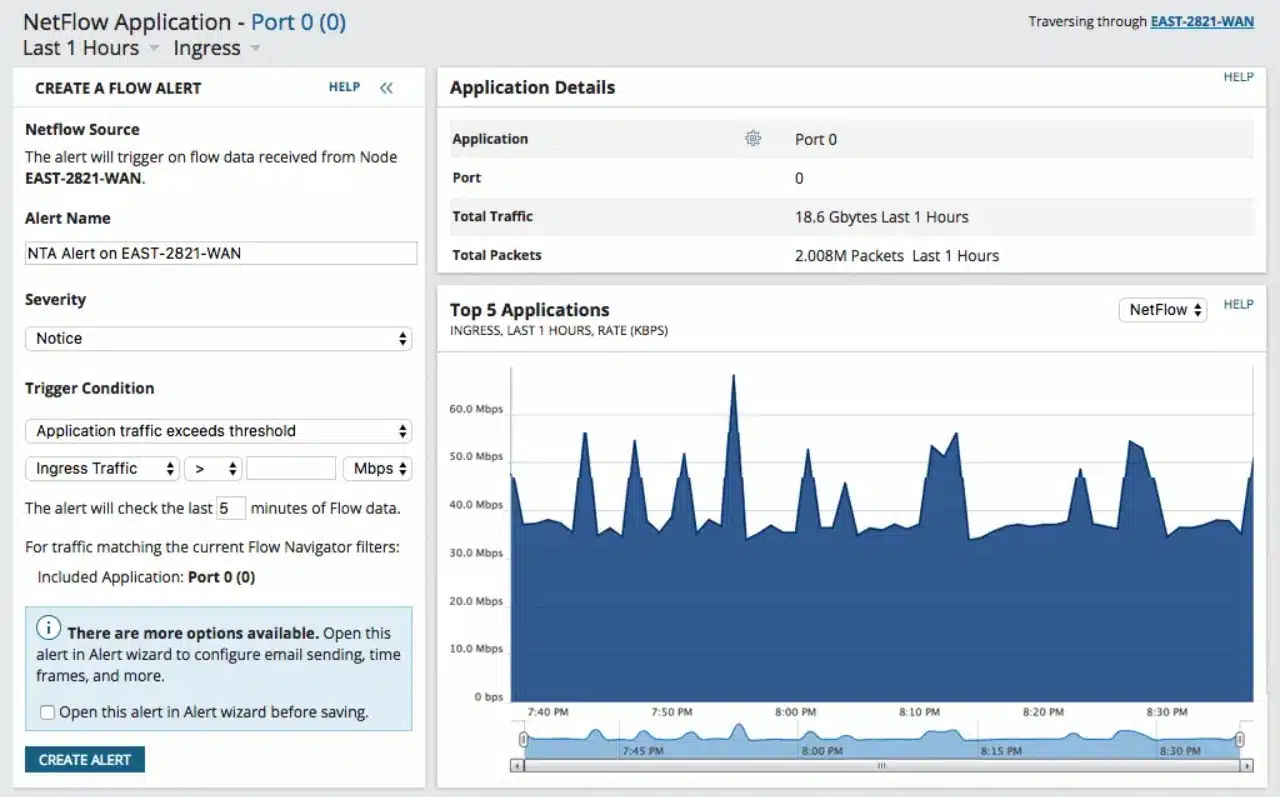
ManageEngine NetFlow Analyzer offers constant network traffic monitoring plus analysis tools. You can use this system to ensure that all of your network devices are contactable and get the package to send you an alert if a device does not respond.
Key Features:
- Continuous Monitoring: Provides constant network traffic monitoring.
- Application Traffic Identification: Detects and identifies traffic from specific applications.
- Traffic Shaping: Implements measures to manage and optimize network traffic.
- Multi-Vendor Support: Suitable for environments with devices from various vendors.
- Time Series Analysis: Offers graphs for analyzing traffic over time.
Why do we recommend it?
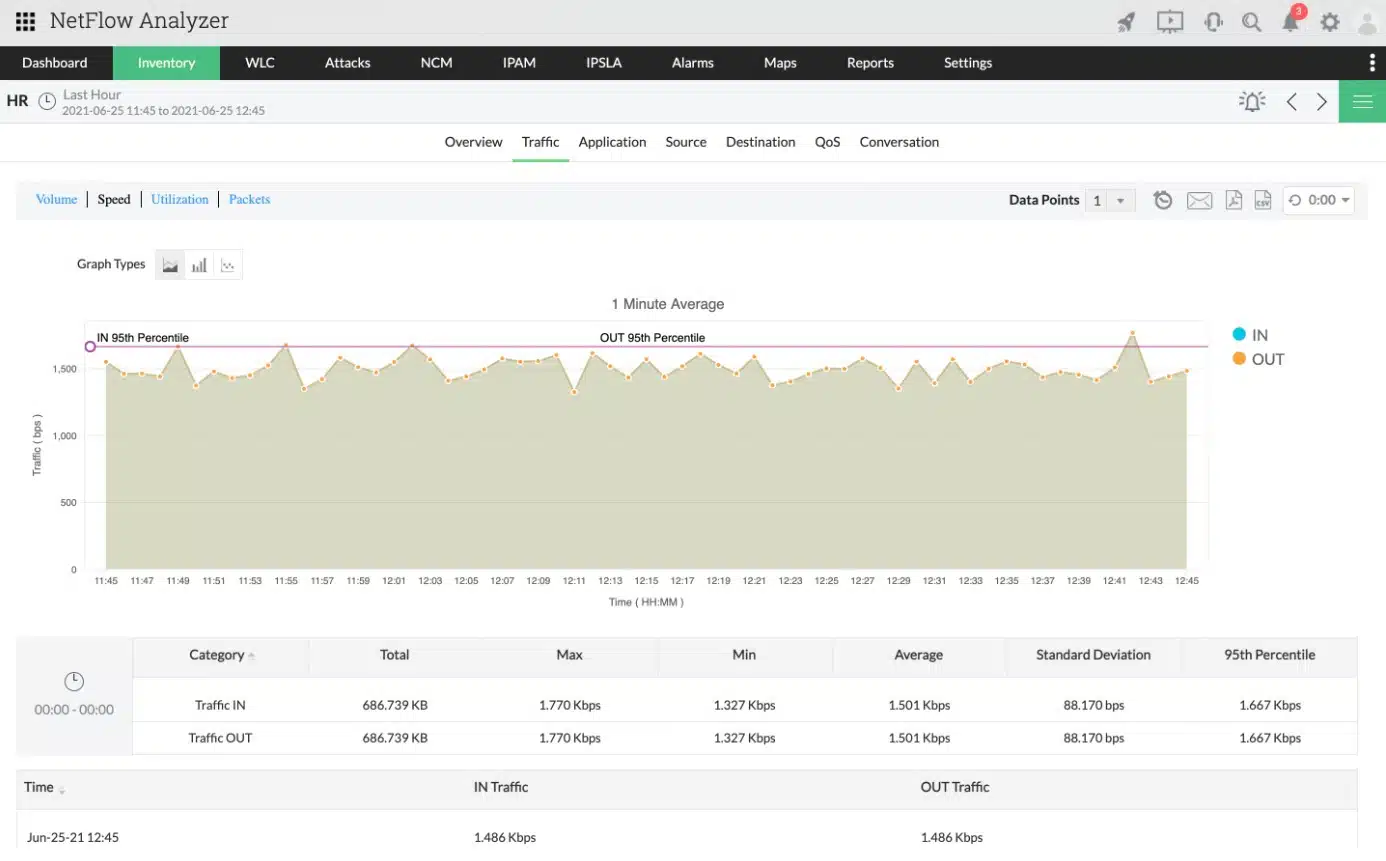
ManageEngine NetFlow Analyzer is the major rival to the SolarWinds NetFlow Traffic Analyzer. This package includes systems to communicate with network devices and extract the operations statistics that they store. The system also includes a protocol analyzer that enables specific application traffic to be identified. That function is important if you hope to implement traffic shaping measures to improve the delivery of interactive, time-sensitive traffic. The tool also helps to implement those measures through mechanisms such as queuing.
You can see the traffic throughput on each link and get that automatically compared to the capacity of the hardware so that you can see when capacity is running short. The system has the capabilities to operate in a multi-vendor environment ensuring that it can communicate with the switches and routers of all the major providers through the use of Netflow, sFlow, jFlow, IPFIX, NetStream, and AppFlow.
The package lets you run tests and look at past performance on time series graphs. With these insights, you can implement traffic shaping measures to work out which applications are the bandwidth hogs and which switches would benefit from queuing so that interactive traffic doesn’t get held up. The system provides Cisco NBAR and CBQoS for these purposes.
Who is it recommended for?
ManageEngine produces three editions of the Network Analyzer, which should make it appealing to businesses of all sizes. However, the Free edition, which could attract small businesses is limited to monitoring three interfaces, which barely reaches the definition of what a network is. The Professional edition covers a single network and the Enterprise edition can monitor a WAN, so mid-sized and large businesses would be interested in the NetFlow Analyzer.
Pros:
- Vendor-Agnostic: Extracts data from devices regardless of the manufacturer.
- Live Traffic Monitoring: Provides real-time monitoring of network traffic.
- Traffic Shaping Facilities: Includes tools to manage and optimize network performance.
Cons:
- Limited Cloud Option: The cloud version is not a full SaaS package.
You can host the software for ManageEngine NetFlow Analyzer on Windows Server or Linux. The system is also available in the AWS Marketplace to run on your account on that platform. Try a 30-day free trial of the on-premises version.
2. Site24x7 Network Traffic Monitoring (FREE TRIAL)

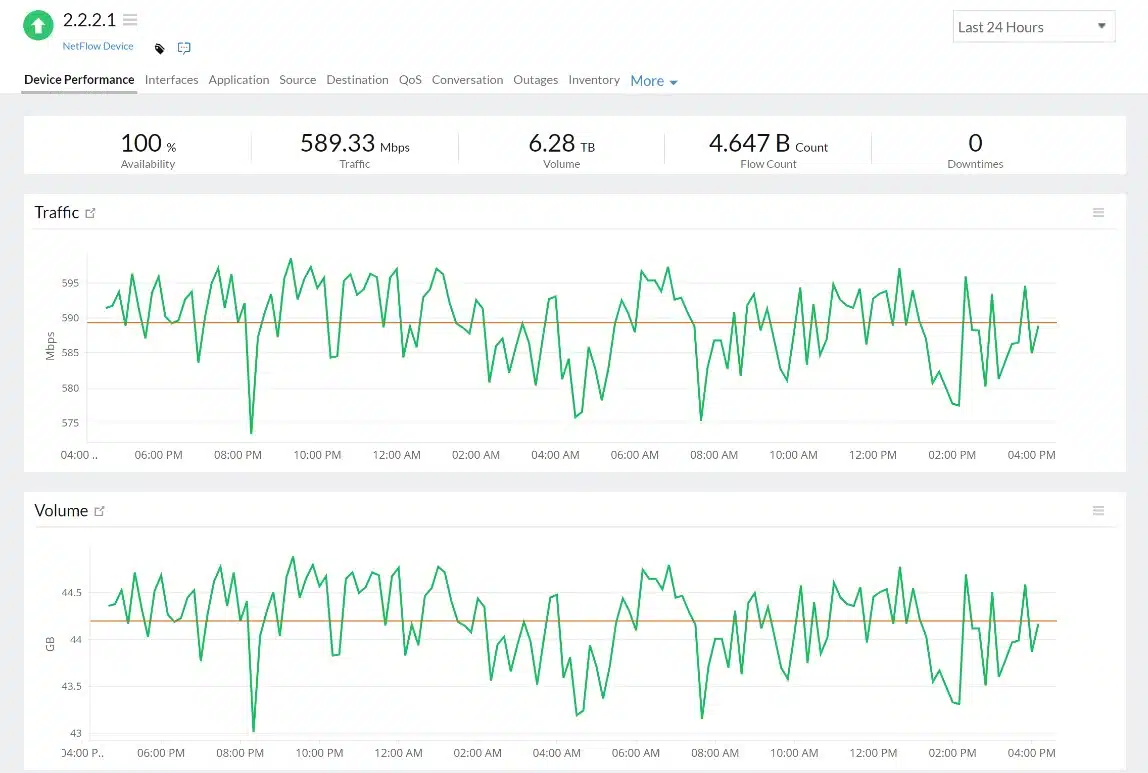
Site24x7 Network Traffic Monitoring uses flow protocols to track the capacity utilization on every link on a network. This system is part of a cloud platform of system monitoring and management tools that provide full-stack observability.
Key Features:
- Flow Protocols: Utilizes multiple flow protocols to monitor network traffic.
- Protocol Analysis: Analyzes various network protocols to understand traffic patterns.
- Top Talkers: Identifies the most active sources of traffic.
- Traffic Problem Alerts: Sends alerts for sudden changes in traffic patterns.
Why do we recommend it?
Site24x7 Network Traffic Monitoring is delivered from the cloud. It is easy to set up and run because the tool installs an agent on the network that it being monitored. This installation process is part of the onboarding process and results in automatic detection of all devices on the network, creating a network inventory and a topology map.
The on-site agent for the Site24x7 communicates with switches and routers to extract activity data. This process is implemented with flow protocols. These are the NetFlow, IPFIX, sFlow, J-Flow, cFlow, AppFlow, and NetStream protocols. Data is uploaded to the Site24x7 server where it is organized into tables and graphs.
The package includes an alerting system that raises a notification if traffic patterns change suddenly. Such changes can indicate an overloaded or faulty network device. Network device status tracking services in the Site24x7 package will illuminate any system problems further.
Who is it recommended for?
This system assesses the capacity of each device interface and tracks traffic throughput per link. The tool will raise an alert if a switch or router gets overloaded and will show which protocols, workstations, and external sources are channeling the most traffic onto the network. So, the monitoring system is suitable for use by any business that has a network.
Pros:
- Traffic Anomaly Alerts: Notifies users of unexpected changes in traffic.
- Device Activity Tracking: Monitors the activity of network devices for better management.
- Capacity Planning: Helps in planning network capacity and preventing overloads.
Cons:
- No On-Premises Version: Available only as a cloud-based solution.
The Site24x7 platform bundles many system monitoring and management tools into its plans. There are plans available for many specializations, such as infrastructure tracking and website monitoring. There is also a plan available for managed service providers. Try out Site24x7 by accessing a 30-day free trial.
3. Obkio

Obkio is a cloud-hosted network monitoring tool that extracts traffic data from networks and also gathers information on network device statuses. The tool can use either of these routes to derive traffic throughput statistics.
Key Features:
- Traffic Measurements Between Two Points: Gather throughput data through agents.
- Network Device Monitoring: Collects device activity data with SNMP.
- Alerts for Performance Issues: Receivies warnings from SNMP device agents.
Why do we recommend it?
Obkio is notable for its ease of use because an administrator just has to choose where to install data collection agents and the console of Obkio will download them and get them running. These agents collect a range of network traffic statistics and also gather SNMP reports from device agents. Users can run troubleshooting tests through these data collectors as well.
SNMP reports include a slot for interface capacity and data pass-through for each direction. So, this is a good source of throughput data. The package can also read passing packets with its own agent. So, it provides two ways to measure traffic volumes.
While it gathers throughput data, the tool can assess other factors about traffic, such as its regularity (jitter), latency, and packet loss. You can set up alerts on these statistics and these, along with the SNMP warnings from device agents, will appear in the Obkio console. The system can be configured to forward alerts to technicians by email, Slack, Pagerduty, or Teams.

Who is it recommended for?
Obkio is recommended for businesses of all types but it is particularly useful for companies that run interactive applications, such as VoIP or video conferencing. This tool is also a good choice for multi-site businesses and those enterprises that rely on cloud-based services. The package is able to measure traffic across internet connections, so it can support SD-WAN and SASE virtual networks.
Pros:
- Customizable Traffic Alerts: Create your own conditions for traffic alerts.
- Historical Analysis: Stores statistics for analysis and capacity planning.
- Flexible Deployment: Monitor internet connections as well as paths across the network.
Cons:
- No Network Management Tools: Provides monitoring systems but no mechanisms to fix problems.
Obkio is available in four plan levels and the next-to-highest of these, the Premium Edition, is offered for a 14-day free trial.
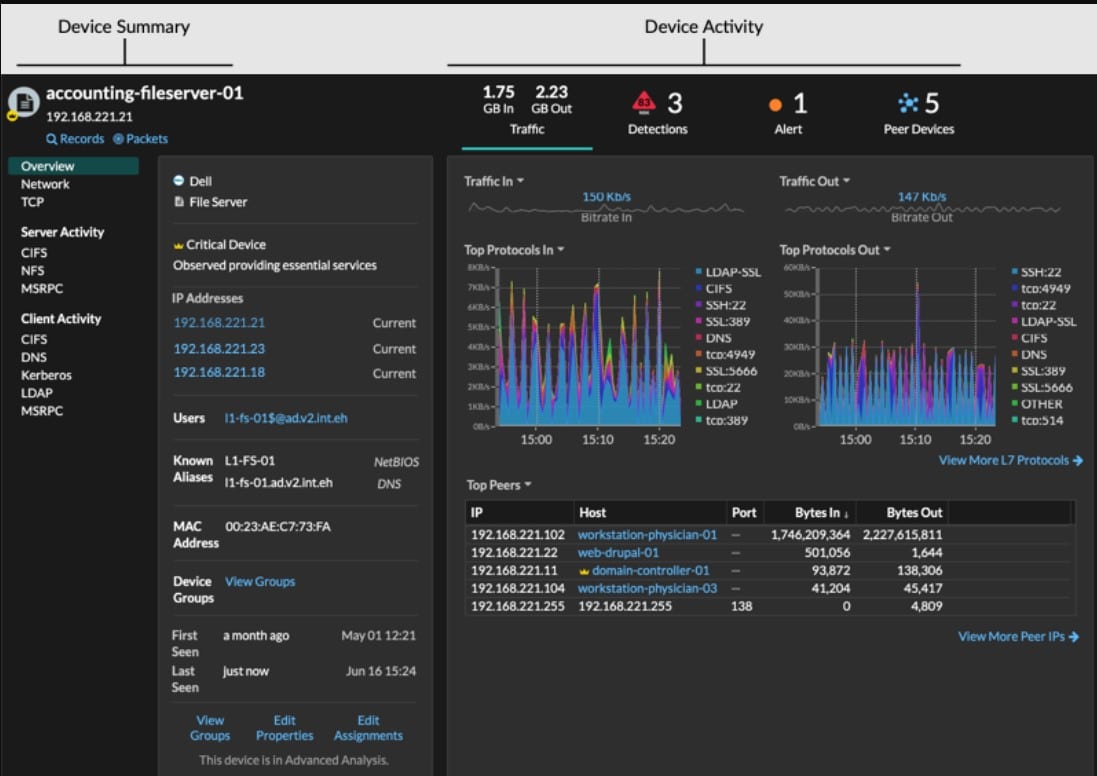
4. ExtraHop
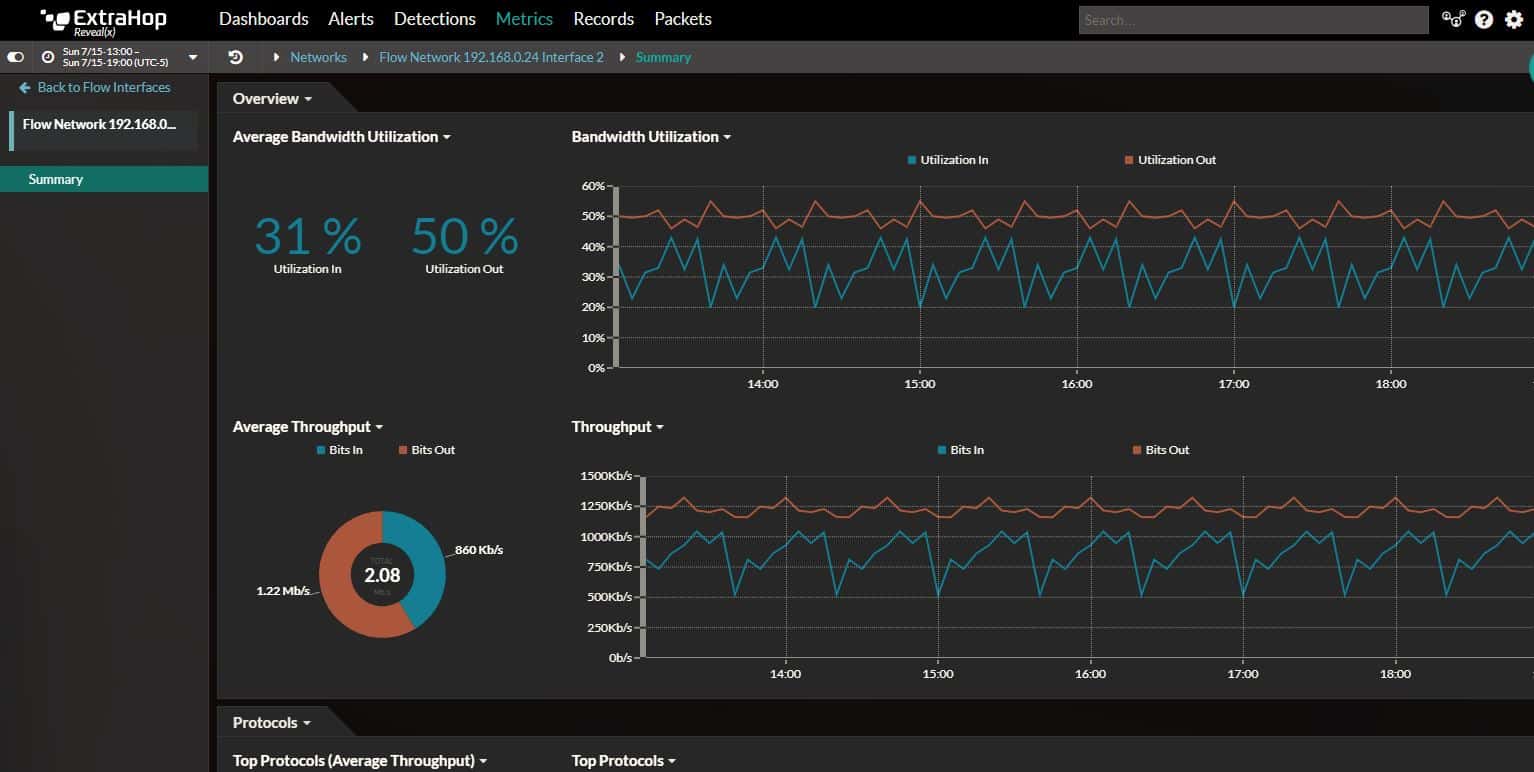
ExtraHop is an enterprise-level monitoring solution with support for advanced features like contextual intelligence, forensic investigation, real-time analytics, and more.
Key Features:
- Enterprise-Level Monitoring: Provides comprehensive monitoring for large-scale networks.
- Contextual Intelligence: Supports advanced features for deeper network insights.
- Real-Time Analytics: Offers real-time data analysis for immediate insights.
- Cross-Site Traffic Tracking: Monitors traffic across multiple sites and between on-premises and cloud environments.
Why do we recommend it?
The ExtraHop Reveal(x) system is a classic network monitoring service that includes the discovery and documentation of all network devices. This package combines network device status monitoring and traffic tracking. This system can track traffic across sites and also between sites and cloud platforms. The tool is also able to perform security monitoring simultaneously with its traffic monitoring.
ExtraHop offers monitoring solutions for security, network performance, and the cloud. The section of this enterprise software we’re focused on here is its network performance monitoring capabilities.
One of the major selling points of ExtraHop’s network performance solution is the ability to automatically detect and correlate network issues, which should help reduce mean time to resolution. Part its solution includes detailed metrics and charts covering average bandwidth utilization, average throughput, throughput by protocol, “top talkers” (endpoints with the highest average throughput), and more. If you’re looking for an enterprise-level solution to your throughput monitoring problems, you may want to take a look at ExtraHop.
Who is it recommended for?
ExtraHop doesn’t publish its price list and its cloud-based system is very sophisticated, which implies that it is probably out of the budget of small businesses. This traffic monitor is combined with security monitoring, it can track activity on multiple sites and it can track traffic between sites and cloud systems. So, this is a good choice for complicated large business systems that include resources from many different SaaS providers and include users working remotely and at multiple branch offices.
Pros:
- Enterprise-Focused: Tailored for use by large organizations to assist system administrators.
- User Interface: Features an intuitive interface with a dark mode for ease of use.
- Automatic Issue Detection: Identifies and correlates network issues automatically to reduce resolution time.
Cons:
- Contact for Pricing: Pricing information is not publicly available and requires contact with the vendor.
- Complex Management Console: The web-based management console could be more intuitive.
- Steep Learning Curve: Filtering traffic can be challenging and requires significant learning.
You can demo ExtraHop directly from your browser (Contact info is requested, but demo access is given immediately after).
5. Comparitech Speed Test
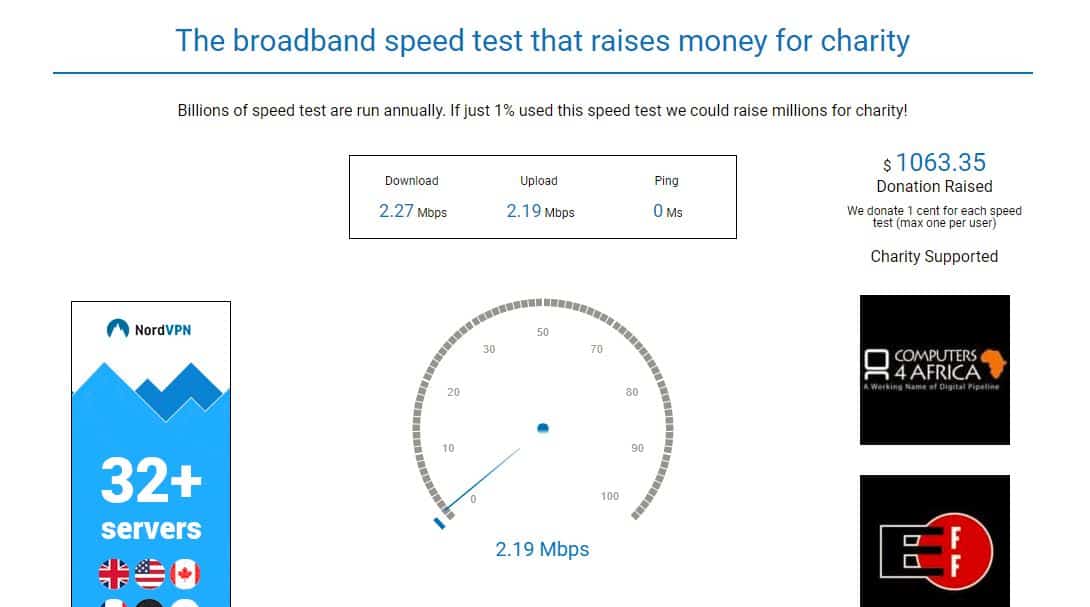
If you need to check the throughput from a given computer or mobile device with a web browser, our very own speed test is a great way to do so and help raise money for charity.
Key Features:
- Download and Upload Speed Measurement: Checks the current download and upload speeds of your internet connection.
- Ping Response Testing: Measures the response time of your connection.
- Web-Based Interface: Simple, easy-to-use interface accessible from any web browser.
- Charity Donations: Donates to charity with each test performed.
- Quick Network Checks: Ideal for fast and straightforward network performance assessments.
Why do we recommend it?
Comparitech Speed Test is one of the services on our own website, so our urge to recommend it is easy to understand. This is a free tool that is very easy to use. Furthermore, the website donates to charity every time that the Speed Test service is used. So, you can do good while testing your internet connection speed.
Our speed test will check your current download speed, upload speed, and ping response times. I’ve found that online speed tests too are a good way to determine if issues you are having with a given app are related to your network speeds or not (e.g. to check if you meet Netflix’s Internet Connection Speed Recommendations). Additionally, for each test (max one per user), Comparitech will donate one cent to charity.
Who is it recommended for?
This tool is an on-demand system. That means it isn’t meant for use by corporations for constant internet service testing. This is useful for a quick check from a third-party service to check on the accuracy of a regular connection performance testing system or for remote workers to perform their own troubleshooting tests when connecting in to the company network. The system is also good for private individuals to investigate why they aren’t getting downloads and Web page loading at a suitable speed.
Pros:
- Charitable Contribution: Each test performed donates money to charity, making it a feel-good choice.
- Easy to Use: Provides a quick and simple way to view download, upload, and ping metrics.
- Unbiased Bandwidth Check: Offers an unbiased assessment of your available bandwidth.
- No Download Needed: Accessible directly from a web browser without any downloads.
Cons:
- Limited Features: Designed for quick tests and lacks in-depth monitoring capabilities.
6. SolarWinds Network Bandwidth Analyzer Pack
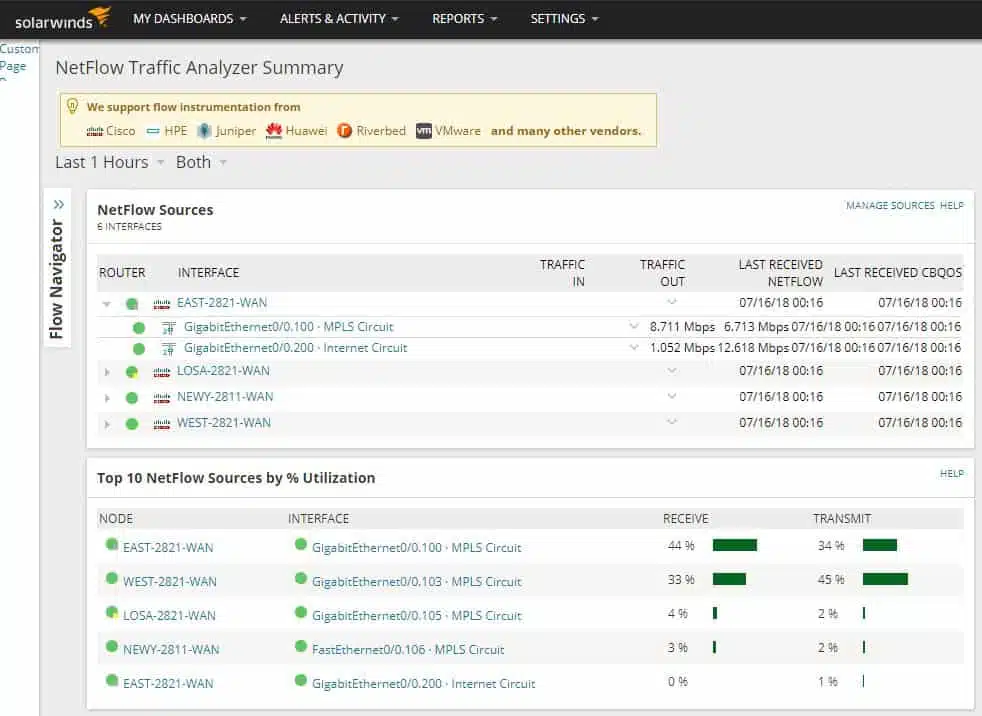
The SolarWinds Network Bandwidth Analyzer Pack is actually two SolarWinds products bundled together: Network Performance Monitor (NPM) and NetFlow Traffic Analyzer (NTA). You can learn more about each of these modules in our NPM and NTA reviews.
Key Features:
- Bundled Solutions: Combines Network Performance Monitor (NPM) and NetFlow Traffic Analyzer (NTA).
- SNMP and Up/Down Monitoring: Provides comprehensive monitoring of device status and network health.
- Multi-Protocol Support: Supports NetFlow, sFlow, and jFlow for diverse network environments.
- Holistic Network Monitoring: Designed for thorough monitoring of network throughput.
- Traffic Outlier Detection: Automatically identifies unusual network traffic patterns.
- Enterprise Scalability: Suitable for large, complex networks.
Why do we recommend it?
The SolarWinds Network Bandwidth Analyzer Pack gives you two network monitoring systems that provide both network device status checks and traffic pattern tracking. Although it is possible to use the Network Performance Monitor by itself, the NetFlow Traffic Analyzer will only run if the NPM is also present. Therefore, if you want to perform traffic analysis with SolarWinds products, you have to buy both of these products, which is what this pack offers.
In short, NPM is one of the most popular pieces of enterprise monitoring software offered by SolarWinds and does a lot of the Simple Network Management Protocol (SNMP) and up/down monitoring you would expect from a Network Management System (NMS). Adding NTA to the mix enables support for monitoring the various flow protocols like NetFlow, sFlow, jFlow, etc. Combined, these two tools become a holistic, feature-rich, throughput monitoring solution.
You can demo NTA directly from your browser here. You can also download a 30-day free trial of the Network Bandwidth Analyzer Pack which includes both tools.
Who is it recommended for?
The combination of two big SolarWinds systems provides a lot of monitoring services, which is probably only going to appeal to larger companies. The full package of screens presents a lot of information and you need a team of technicians in order to get the full value out of this package. Extensive monitoring automation, thanks to an alerting system means that your technicians don’t have to watch the screens all the time. The NetFlow Traffic Analyzer provides full support for the implementation of traffic shaping measures, which will help you to squeeze extra value out of your current network assets.
Pros:
- Supports Multiple Protocols: Excellent for monitoring equipment from Cisco and other vendors using NetFlow, sFlow, and jFlow.
- Integrated Monitoring Tools: Seamless integration of NPM and NTA for comprehensive traffic and device monitoring.
- User-Friendly Interface: Automatically highlights bandwidth issues and unusual traffic.
- Scalable Design: Ideal for large enterprises with extensive network monitoring needs.
- Granular Traffic Analysis: Allows per-hop traffic view for detailed analysis.
Cons:
- Enterprise-Focused: Not suitable for small home networks due to its complexity and scale.
7. Iperf
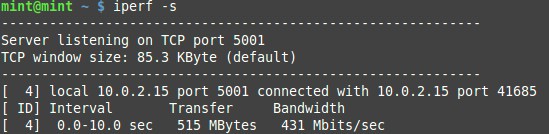
Iperf is a free, open-source tool used for taking active measurements of throughput on a network. It is officially supported on CentOS, FreeBSD, and macOS. According to its Github page, a number of other *nix based operating systems have been reported successfully using Iperf, and I was able to get it running on Linux Mint 17.1 without issue. Iperf can measure TCP (Transmission Control Protocol, UDP (User Datagram Protocol), and SCTP (Stream Control Transmission Protocol) throughput.
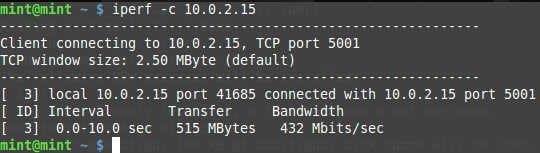
Iperf uses a client/server configuration, meaning the software needs to be installed on both endpoints for you to measure throughput. You can download and install Iperf here (Note: I was able to use apt-get install iperf on Mint 17.1).
Key Features:
- Free and Open-Source: Available at no cost and open for modifications.
- Supports Multiple Protocols: Measures throughput for TCP, UDP, and SCTP.
- Cross-Platform Compatibility: Works on CentOS, FreeBSD, macOS, and other Unix-like systems.
- Lightweight and Efficient: Minimal resource usage for effective performance.
Why do we recommend it?
Iperf is a great option for techie administrators who like command-line troubleshooting tools. This is a free system but it doesn’t offer any user-friendly graphics. The tool is only able to measure traffic between two endpoints that you control.
In the example below, I ran Iperf in server mode by executing the command iperf –s, then connected to the server to measure TCP throughput by executing the command iperf –c 10.0.2.15 (10.0.2.15 was the IP address of the Iperf server). For more on Iperf, check out its Github page.
Who is it recommended for?
Iperf is more of a connection testing tool than a traffic measurement system. You can use it to generate your own traffic and test a link on the network or a path that runs over multiple links. The tool is free and it is available for Linux.
Pros:
- No Cost: Completely free and open-source, making it accessible for all users.
- Multi-Platform Support: Compatible with various operating systems, enhancing usability.
- Efficient Performance: Lightweight design allows it to run on resource-limited machines.
Cons:
- Installation Requirement: Needs to be installed on both endpoints for accurate measurements.
- Technical User Focused: Lacks user-friendly graphics and is designed for command-line usage.
8. NetCPS
NetCPS is a Windows Command Line utility that also follows the client/server paradigm for measuring throughput. It has been around for a long time, but can still be useful on many modern Windows operating systems (it worked well on Windows 10 for me).
Key Features:
- Windows Command Line Utility: Designed to run from the command line in Windows environments.
- Network Throughput Testing: Measures the throughput between two endpoints.
- Modern OS Compatibility: Functions well on modern Windows operating systems.
- Lightweight and Versatile: Minimal resource usage and adaptable for various tests.
Why do we recommend it?
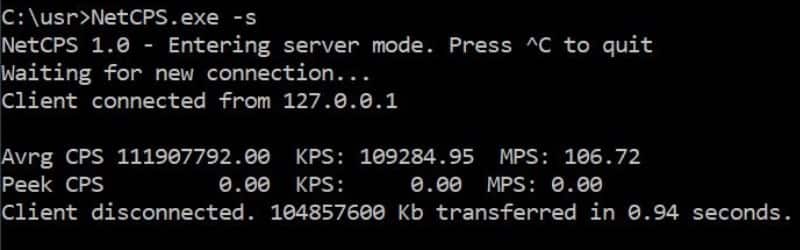
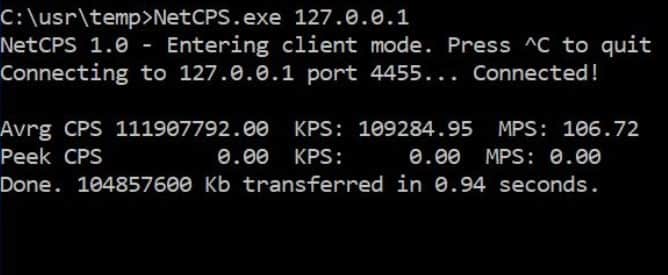
NetCPS is a Windows tool that performs more or less the same function as Iperf. This utility generates 100 MB of data, which you can send from one endpoint to another. If the route crosses a switch or a router, you will be able to test the availability of that device. The result will tell you the transfer speed of that traffic burst.
NetCPS is freeware, with the one exception that it is NOT permitted for governmental or military use. You can download, learn more about, and view the source code of NetCPS here.
In the example below, I used NetCPS to measure throughput on a local PC’s loopback address. First, from the directory where the NetCPS.exe file was loaded, I executed the command NetCPS.exe –s to place NetCPS in server mode, then in a separate cmd.exe Window I executed the command NetCPS.exe 127.0.0.1 to test the loopback IP address.
Who is it recommended for?
NetCPS is a command line tool and it is free to use. This is a handy tool to have for network troubleshooting. Government institutions and the military are banned from using this tool.
Pros:
- Resource-Efficient: Uses very little system resources during operation.
- Wide OS Compatibility: Can run on both legacy and modern Windows operating systems.
- Simple and Effective: Provides a straightforward solution for short and long-term network tests.
Cons:
- Technical User Focused: Not the most user-friendly tool for non-technical users.
- CLI Only: Operates solely via the command line without graphical representation.
- Limited Functionality: Lacks advanced features such as reporting or alert systems.
9. Netperf
NetPerf is a CLI tool used on *nix operating systems (it also compiles on Windows) similar to Iperf that was originally developed by Hewlett Packard. While it’s not technically open source, it is free to use and a fairly popular tool for measuring throughput and benchmarking network speeds.
For more information on Netperf, check out the manual and the Netperf Github.
Key Features:
- Network Benchmarking: Measures network speed and benchmarks throughput.
- Supports Multiple Protocols: Handles both UDP and TCP connections.
- Free for All Users: Available at no cost for everyone.
- Cross-Platform Compatibility: Runs on Unix-based systems and Windows.
Why do we recommend it?
Netperf is a network testing tool. This utility is free to use. The Netperf system lets you test links or a whole route between two points on a network. It reports on throughput speeds and it is meant to be a benchmarking system. That means you use Netperf to get a standard throughput speed and then measure applications against that. You can run UDP or TCP connections to specific ports.
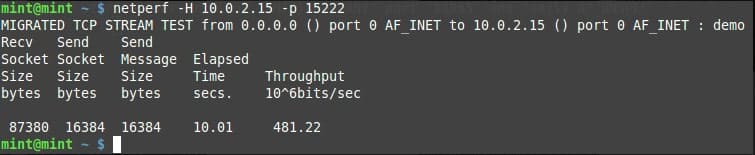
Like NetCPS and Iperf, Netperf uses a client/server model. You can start the server using the command netserver –p <port_number> and then connect from a client using the command netperf –H <server_IP_address_or_FQDN> -p <port_number>. In the example below, we started the server on port 15222 from a host with IP address 10.0.2.15.

Who is it recommended for?
Like Iperf and NetCPS, Netperf is a handy tool for network administrators who want to run ad hoc tests. The system was written for Unix and related operating systems, such as Linux and macOS. However, it will also run on Windows.
Pros:
- Multi-Platform Support: Designed for Linux and Unix but can also compile and run on Windows.
- Completely Free: No cost associated with its use.
- Effective Benchmarking: Provides thorough network performance benchmarking.
Cons:
- Technical User Focused: Not very user-friendly for non-technical users.
- CLI Only: Operates solely through the command line without graphical interfaces.
- Client/Server Model: Requires installation on both endpoints, necessitating extra setup work.
Let us know your feedback!
That was our crash course on throughput and list of throughput measurement tools. Did we leave anything out? Do you have any questions about the tools we mentioned here? Let us know in the comment section below.

Iperf3 is the most accurate.
Besides it has a lot of free public servers at https://iperf.cc