Over the last few years, our research team has set out to uncover the true cost of elder fraud in the US by analyzing and extrapolating data from government reports and registries. Our research found that thousands of seniors are subject to financial exploitation each year and suffer huge losses worth billions of dollars.
This year, with new 2022/2023 figures, our team has uncovered 555,194 cases of financial exploitation against people over age 60 with losses estimated at around $38.5 billion. These latest report figures are a 22.5 percent increase on our previous year’s figures of 453,290 with a staggering 206 percent increase on the monetary losses reported (rising from $12.6 billion).
Elder fraud, also called elder financial abuse or elder financial exploitation, is defined as the misappropriation or abuse of financial control in a relationship where there is an expectation of trust, resulting in harm to the elderly victim.
Unfortunately, elder fraud is notoriously underreported–both in the number of cases actually reported to the authorities and the number of reports published on elder fraud. Only 36 states provide some figures on the number of reports received by their Adult Protect Services (APS) and even then many don’t give a breakdown by the type of abuse or the age category. Therefore, we’ve used averages from other states to fill in the gaps for the number of cases reported and the dollar amounts lost. You can find more about how we conducted our research in the methodology section.
Although not definitive, this exploratory study examines the potential cost and prevalence of elder abuse based on estimations, statistics, and hypotheses. The study highlights the need for further research in this area.
Please note: previous versions of this study have used estimates based on the number of cases of financial exploitation in the elderly that go unreported (noted below). However, in this study, to provide more clarity on the known cases of elder fraud, we have focused on reported cases only while exploring potential estimates in a separate section.
Key findings
Our research combines financial elder abuse figures from the IC3, FTC, FinCEN, and APS reports across all 50 states in the US. Here are some key findings for 2022/23 below:
- More than 6 in 100 elderly people in the US are known to have been victims of elder fraud
- 555,194 reports of financial elder abuse–an increase of 22.5 percent on 2021/22’s figures of 453,290.
- $38.5 billion has been lost to financial elder abuse–an increase of 206 percent on 2021/22’s figures of $12.6 billion
- The average loss per case was $57,070, calculated by averaging the mean reported loss from these organizations:
- $173,728 – Financial Crimes Enforcement Network (FinCEN)
- $33,915 – Federal Bureau of Investigation, Internet Crime Complaint Center (IC3)
- $15,703 – State Adult Protective Services or Law Enforcement
- $4,934 – The Federal Trade Commission (FTC)
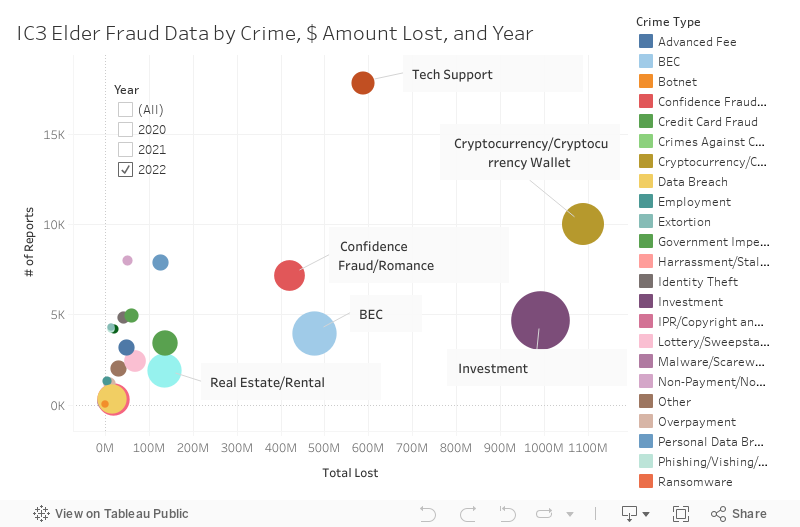
- Tech support scams were once again the most common type of fraud reported to the IC3, while investment scams exceeded $1 billion for the first time. Cryptocurrency scams against the elderly also hit $1.65 billion with the number of complaints almost doubling in a year
- According to FinCEN reports, most elder scam filings referenced “account takeover” by someone unknown to the victim, and adult children were the most common elder theft perpetrators
- The FTC provides a breakdown of cases and losses by specific age brackets. While the 60-69 age bracket reported the highest number of cases (199,636 cases), the over-80 age bracket had the highest average loss per case ($5,030.10)
According to the IC3, the number of reports from seniors increased by more than 14 percent from 2022 to 2023 (increasing from 88,262 reports to 101,068 reports). The total amount lost to seniors also increased by 11 percent (rising to $3.4 billion). The average amount lost per scam did dip slightly, however, dropping by three percent (from $35,101 in 2022 to $33,915 in 2023).
Investment scam losses exceeded $1 billion for the very first time (increasing from $990 million in 2022 to $1.24 billion in 2023). The number of cases also increased from 4,661 to 6,443. Cryptocurrency scams continued to rise significantly with cases nearly doubling from 9,991 to 16,968 from 2022 to 2023. The amount lost increased by 52 percent, which resulted in $1.65 billion in losses to the elderly (compared to $1.09 billion in 2022).
The FTC reported that of the total reports they received for all fraud types (880,000) in 2023, only around half of them specified which age group each case was related to. This suggests the figures included from the FTC in this report likely only scratch the surface of the problem. Unfortunately, as we will explore in more detail below, underreporting is a huge concern when it comes to financial exploitation of the elderly.
Top 5 US states with the highest rates of elder fraud
1. Alaska: 1,808 cases of exploitation per 100,000 seniors
The elderly population in Alaska lost $176.6 million across 2,640 cases in total.
This high number of elder fraud reports is mainly due to Alaska’s APS report, which noted a 10 percent increase in case numbers (all types of reports) for people over age 60. We estimate 1,723 of these relate to financial exploitation.
Alaska is home to 145,987 over 60s.
2. South Dakota: 1,658 cases of exploitation per 100,000 seniors
3,728 seniors from South Dakota were affected by elder fraud, losing an estimated $449 million.
This is primarily due to the number of SAR reports for financial exploitation increasing by 454 percent. In 2022, 627* SARs reports were filed for elder financial exploitation in this state. In 2023, this rose to 3,475*.
South Dakota is home to 224,811 over 60s.
3. Washington: 1,426 cases of exploitation per 100,000 seniors
With a population of just over 1.78 million seniors, Washington reported 25,399 cases of financial exploitation and $1.56 billion in losses.
The number of financial exploitation cases reported to the APS was 16,973–the second-highest figure across all states (just below California’s figure of 23,429 APS reports).
4. Delaware: 1,341 cases of exploitation per 100,000 seniors
Seniors in Delaware lost an estimated $454.6 million to elder fraud last year, across 3,838 cases of financial exploitation in total. SARs cases also accounted for a large chunk of Delaware’s figures (3,337* were reported in 2023 in total), but this figure was almost half the figure that was reported in 2022–7,377*.
Unfortunately, the state doesn’t have an annual APS report to provide more potential insight into this decline. That said, IC3 figures didn’t change much from 2022 (305) to 2023 (314), suggesting elder fraud cases in this state perhaps aren’t on as much of an incline as other states despite it having one of the highest rates of elder fraud.
Delaware is home to 286,103 over 60s.
5. Rhode Island: 1,004 cases of exploitation per 100,000 seniors
The state saw losses of $279.4 million to financial exploitation across 2,836 cases. Both SARs and IC3 cases rose quite significantly in this state. SARs rose from 1,114 to 1,886* (69 percent) and IC3 cases from 219 to 274 (25 percent).
Rhode Island is home to 282,507 over 60s.
*To account for a third of SARs being referred to state APS for further investigation, our calculations only use two-thirds of these figures, e.g. 2,317 for South Dakota for 2023.
Top 5 US states for elder fraud in total losses
1. California: $6.2 billion lost to elder financial exploitation
It’s perhaps no surprise that the most populous state, California, lost the most to elder fraud. California lost nearly $6.2 billion to elder financial exploitation, impacting 71,729 people over the age of 60 in total.
California is home to 8.46 million over 60s.
2. North Carolina: $2.8 billion lost to elder financial exploitation
With a much lower population than California, Texas, and New York, North Carolina’s position as the second hardest-hit state for elder financial exploitation costs comes as more of a surprise.
SARs reports more than doubled from 2022 to 2023, rising from 10,721* reports in 2022 to 21,808* reports for 2023. IC3 figures also rose exponentially, from 1,959 in 2022 to 2,423 in 2023 (24 percent). Interestingly, however, the state’s APS service dealt with less over 60s in 2023 than 2022 (dropping to 15,047 from 16,544). Unfortunately, the report doesn’t provide any further insight into the decline of these APS figures. This could be due to lower funding, less reports being submitted via the APS in favor of the likes of the IC3 and FinCEN, or just a general decline in the number of cases.
North Carolina is home to 2.54 million over 60s.
3. Texas: $2.5 billion lost to elder financial exploitation
Another big state, Texas, lost $2.5 billion to elder fraud. In total, 36,251 people aged 60 and over were impacted.
Texas is home to 5.64 million over 60s.
4. New York: $2.2 billion lost to elder financial exploitation
New York reported almost $2.2 billion in losses to elder financial fraud across 32,551 cases.
New York is home to 4.86 million over 60s.
5. Ohio: $1.9 billion lost to elder financial exploitation
Ohio seniors reported losing over $1.94 billion to elder financial exploitation fraud. 24,760 people over the age of 60 were impacted.
Ohio is home to 2.95 million over 60s.
A further 4 states reported losses that exceeded $1 billion, these were: Florida ($1.92 billion), Pennsylvania ($1.63 billion), Washington ($1.56 billion), and Georgia ($1.19 billion).
*Due to the lack of reports in some states, we’ve used averages for the number of cases reported and/or the dollar amounts lost. See the methodology section for more information.
States with the biggest increases in elder fraud reports from 2021/22 to 2022/23
According to our findings, South Dakota saw the highest increase in case figures during each reporting period. Cases rose from 145 percent from 1,521 to 3,728. As we have noted above, this is largely due to a vast increase in SARs reports.
Other states with significant increases were North Carolina and Arizona.
In North Carolina, cases rose by 63 percent from 14,845 to 24,161. Again, as mentioned above, this is primarily due to SARs increases as well as IC3 reports.
In Arizona, the number of cases increased from 11,717 to 18,161–55 percent. This increase appeared across all reporting platforms. SARs stats increased by 48 percent (from 2,078* to 3,071*), IC3 reports increased by 41 percent (from 3,543 to 5,003), and APS reports increased by 89 percent (from 4,396 to 8,291). FTC excluded due to all figures being estimated.
Please note: APS reports are often limited and can change from year to year. In most cases, figures are compared like for like but there may be a couple of instances where the reporting formats may have changed from 2021/22 to 2022/23.
Methodology
Notes and limitations
- Some APS reports give the overall figures for financial exploitation and don’t break it down by age group. They often give the distribution of age groups by percentage, so we multiply total figures by the proportion of seniors to get a figure for elder financial exploitation. In the cases where no percentages of age groups are given, we have taken the average of the APS sources where a percentage is given (78.79%) and have applied this to achieve a figure for over 60s. Equally, where no breakdown is given for financial exploitation cases, we have applied the average (20.87%) where APS sources provided the percent of cases that related to financial exploitation.
- While cases reported by the APS and Long-Term Care Ombudsman (LTCO) are separate in most cases, there may be the odd occasion where some overlap.
- Often there is quite a significant difference between the number of cases reported and the number substantiated. When you look at APS caseworker numbers and time, this could be an indication as to why only a small percentage are investigated. This article shows how caseworkers are overwhelmed by reports of elder abuse. For our calculations, we used the total number of reports rather than substantiated reports.
- Some states refer to “elders” as 60+ while others deem this category 65+. The number of elderly people per state has been calculated at 60+ due to the IC3, FTC, and FinCEN stats relating to those aged 60 or over.
- Some data was not available for Washington D.C. and Puerto Rico so these have been excluded.
- Even where crime statistics are available for a state, these haven’t been included in our overall scores due to large numbers of cases from FinCEN, the FTC, and IC3 potentially going to local law enforcement. However, $ amounts lost according to crime reports have been used to create case averages in several states.
Sourcing elder fraud data
Elder fraud data was pulled from multiple sources in each state, including:
- Adult Protective Services (APS)
- Long-term Care Ombudsman (LTCO)
- Social Services and Health Services
- Crime Reports
- Suspicious Activity Reports (SARs) from the US Treasury’s Financial Crimes Enforcement Network (FinCEN)
- Federal Bureau of Investigation, Internet Crime Complaint Center (IC3)
- The Federal Trade Commission (FTC)
36 out of 50 states have published the number of elder financial exploitation cases reported to authorities over the past year, most of which come from Adult Protective Services. The remaining 14 either do not publish this data or haven’t published anything over the last two years. For these states, we multiplied the average APS reporting rate from all other states (0.0030 reports per senior) to their total elderly populations to get an estimated number of reported cases.
Only a couple of states publish the average dollar amount lost per elder fraud case and there are no estimated case figures for APS or LTCO reports across the US. So, to obtain our average for these cases we used the average amount lost per FinCEN case ($173,728), the average amount lost per IC3 case ($33,915), the average amount lost per FTC case ($4,934), and the average amount lost in APS or law enforcement cases ($15,703) to create an overall average loss of $57,070 for LTCO and APS cases where the figures are unknown.
Figures based on SAR reports were calculated separately and added to the estimates from APS and other state agency reports. FinCEN’s SAR reports are limited to those filed by financial institutions and normally only include cases in which more than $5,000 was stolen. In FinCEN’s 2024 Analysis on Elder Financial Exploitation, it was reported that $27 billion was lost to elder financial exploitation in 2022. According to FinCEN’s reporting system, 155,415 cases of elder financial exploitation were reported during this same period, creating an average loss per case of $173,728.
A 2019 Consumer Financial Protection Bureau study states less than one-third of these cases are reported to Adult Protective Services. Based on that, two-thirds of the number of SAR reports for each state are added to the number of elder fraud reports that come from the APS and other state agencies.
Likewise, for each state, we multiplied the number of SAR reports by the average dollar amount lost ($173,728) to get a dollar amount lost per state. Two-thirds of this is then added to the loss figures calculated from APS reports.
The FTC provides the average rate of fraud per 100,000 people in specific age groups. For example, for 2023, this is 149.7 per 100,000 for those aged 60 to 69, 158.48 per 100,000 for those aged 70 to 79, and 86.75 per 100,000 for those aged 80 and over. We used these rates and the population of each age group within each state to create an estimated number of FTC cases per state. For example, Alabama has a population of 630,268 people aged 60 to 69. At a rate of 149.7 per 100,000, we get 944 cases in this state.
We then created an average loss per age group based on the FTC’s overall figures for 2023. For example, $983 million was lost to 199,636 people aged 60 to 69 in 2023, creating an average loss of $4,923.96 per case. This was then multiplied by the number of cases in that 60-69 category.
The IC3 provides exact case numbers and dollar amounts lost per state to elder fraud, so these have been added into our report without any further calculations/estimates.
Factoring in unreported elder fraud
While all of the above figures make for stark reading, it’s likely they are a fraction of the true number of cases and losses to elder financial exploitation. As we have already noted, the IC3 can only allocate around half of its cases to a specific age group.
Unfortunately, how many cases go unreported is difficult to ascertain. A number of studies have tried to look further into this:
- A National Center on Elder Abuse study (PDF) published in 1998 found only 16% of cases of elder abuse were reported to authorities
- A 2011 report, Under the Radar: New York State Elder Abuse Prevalence Study (PDF), estimates only one in 23.5 elder abuse cases is reported, while financial exploitation cases could be as high as 1 in 44
- Several government sources put the figure at 1 in 25 cases reported
These widely different estimates are why we’ve chosen to explore exact figures in more detail this year. Despite the fact they likely heavily underestimate the true extent of the problem, they do highlight the growing issues of elder fraud and the states in which cases are rising at a higher rate.
Elder fraud by US State: APS stats and sources
Alabama
- APS received 9,912 referrals. No breakdown for the type of abuse so the average % related to financial exploitation for states that provided such information (20.87 percent) was used = 2,068.
- $ figures achieved by taking the average dollar amount lost per case across FinCEN, IC3, FTC, and known APS/crime figures ($57,070) before multiplying by the report figures mentioned above.
Alaska
- Alaska’s Commission on Aging (ACoA) reported 8,255 APS reports of harm. No breakdown for the type of abuse so the average % related to financial exploitation (20.87 percent) was used = 1,723.
- $ figures achieved by taking the average dollar amount lost per case across FinCEN, IC3, FTC, and known APS/crime figures ($57,070) before multiplying by the report figures mentioned above.
Arizona
- APS Data suggests 11,463 reports of financial exploitation in 2023. 72.33 percent of all cases are related to the over 60s, which equates to 8,291.
- APS Abuse Registry shows $2,616,412.17 lost in 85 cases in 2023. This gives an average of $30,781.32 per case. (These cases are related to ALL vulnerable adults).
Arkansas
- DHS Reports show 12,260 complaints received in 2023. 77.7 percent of all cases related to over 60s and 13.91 percent of cases involve financial exploitation = 1,325
- $ figures achieved by taking the average dollar amount lost per case across FinCEN, IC3, FTC, and known APS/crime figures ($57,070) before multiplying by the report figures mentioned above.
California
- APS Workbook reports 47,824 cases of elder abuse in total, of these 48.99 percent related to financial exploitation = 23,429.
- $ figures achieved by taking the average dollar amount lost per case across FinCEN, IC3, FTC, and known APS/crime figures ($57,070) before multiplying by the report figures mentioned above.
Colorado
- No update for 2022/23
- An estimate of figures was achieved by finding the average percent increase/decrease from other states where exact figures were provided over the last two years. The average percentage increase across 15 states was 16.13.
- The 2020/21 APS Report saw 24,637 reports in total. 26 percent related to financial exploitation, and 73 percent of all cases related to adults aged 60+ (4,804).
- A 16.13 percent increase on 4,804 = 5,579 estimated APS cases in 2023.
- $ figures achieved by taking the average dollar amount lost per case across FinCEN, IC3, FTC, and known APS/crime figures ($57,070) before multiplying by the report figures mentioned above.
Connecticut
- Elder Protective Services Report – 8,904 reports received in FY 2023. No breakdown for type of abuse so the average % related to financial exploitation (20.87 percent) was applied = 1,858.
- $ figures achieved by taking the average dollar amount lost per case across FinCEN, IC3, FTC, and known APS/crime figures ($57,070) before multiplying by the report figures mentioned above.
Delaware
- No specific reports on elder fraud.
- Report figures achieved by multiplying the average reporting rate from all other states (0.0030 reports per senior) to the total elderly population in Delaware to get an estimated number of reported cases.
- $ figures achieved by taking the average dollar amount lost per case across FinCEN, IC3, FTC, and known APS/crime figures ($57,070) before multiplying by the report figures mentioned above.
Florida
- Monthly report figures for the first 10 months of 2023 show 31,359 cases in total for the APS in total. This equates to 37,631 for the year. No age breakdown so average of 78.79% of FE cases relating to over 60s used. And the average % related to financial exploitation (20.87 percent) for FE used = 6,187.
- $ figures achieved by taking the average dollar amount lost per case across FinCEN, IC3, FTC, and known APS/crime figures ($57,070) before multiplying by the report figures mentioned above.
Georgia
- DHS Report – 39,700 reports in total with 32.19 percent relating to financial exploitation. No age breakdown so average of 78.79% of FE cases related to over 60s used = 10,070.
- $ figures achieved by taking the average dollar amount lost per case across FinCEN, IC3, FTC, and known APS/crime figures ($57,070) before multiplying by the report figures mentioned above.
Hawaii
- HS Report – 90 reports of financial exploitation (84.49 percent of all cases relate to people over 60) = 76.
- $ figures achieved by taking the average dollar amount lost per case across FinCEN, IC3, FTC, and known APS/crime figures ($57,070) before multiplying by the report figures mentioned above.
Idaho
- Commission on Aging Report – 444 cases of exploitation. 79.63 percent of cases related to over 60s = 354.
- Crime Statistics – Average losses per case = $6,073 (figures used to determine average lost to APS and LTCO cases).
Illinois
- APS Report – 20,759 total reports with 24.73 percent of cases relating to financial exploitation. 82.82 percent of those were over 60 = 4,252
- 36 percent of abusers in all cases were the victims’ children, 24 percent were relatives.
- $ figures achieved by taking the average dollar amount lost per case across FinCEN, IC3, FTC, and known APS/crime figures ($57,070) before multiplying by the report figures mentioned above.
Indiana
- APS Report – 3,304 cases of exploitation investigated. No age breakdown so average of 78.79% of FE cases relating to over 60s used = 2,603.
- $ figures achieved by taking the average dollar amount lost per case across FinCEN, IC3, FTC, and known APS/crime figures ($57,070) before multiplying by the report figures mentioned above.
Iowa
- Dependent Adult Abuse Statistical Report – 3,596 reports of financial exploitation (1,762 in H1 and 1,834 in H2 of 2022). No age breakdown so average of 78.79% of FE cases relating to over 60s used = 2,833.
- $ figures achieved by taking the average dollar amount lost per case across FinCEN, IC3, FTC, and known APS/crime figures ($57,070) before multiplying by the report figures mentioned above.
Kansas
- APS Report – 1,901 reports of exploitation in the over 60s.
- $ figures achieved by taking the average dollar amount lost per case across FinCEN, IC3, FTC, and known APS/crime figures ($57,070) before multiplying by the report figures mentioned above.
Kentucky
- APS Data – 1,000 referrals for exploitation. 66.72 percent related to the over 60s = 667
- $ figures achieved by taking the average dollar amount lost per case across FinCEN, IC3, FTC, and known APS/crime figures ($57,070) before multiplying by the report figures mentioned above.
Louisiana
- Governor’s Office of Elderly Affairs Report – 1,157 cases of financial exploitation and 293 of extortion in the over 60s = 1,450
- $ figures achieved by taking the average dollar amount lost per case across FinCEN, IC3, FTC, and known APS/crime figures ($57,070) before multiplying by the report figures mentioned above.
Maine
- Office of Aging & Disability Services received 2,425 APS allegations of financial exploitation in total. 1,734 of those related to those over 60.
- $ figures achieved by taking the average dollar amount lost per case across FinCEN, IC3, FTC, and known APS/crime figures ($57,070) before multiplying by the report figures mentioned above.
Maryland
- No update for fiscal year 2023
- An estimate of figures was achieved by finding the average percent increase/decrease from other states where exact figures were provided over the last two years. The average percentage increase across 15 states was 16.13.
- In 2021, the Department of Aging received 7,116 reports of abuse, neglect, self-neglect, and exploitation in the elderly. No breakdown for type of abuse so NAMRS figure of 14 percent of cases relating to financial exploitation was applied = 996.
- A 16.13 percent increase on 996 = 1,157 estimated APS cases for 2023.
- $ figures achieved by taking the average dollar amount lost per case across FinCEN, IC3, FTC, and known APS/crime figures ($57,070) before multiplying by the report figures mentioned above.
Massachusetts
- Executive Office of Elder Affairs noted 52,990 APS allegations in total. 5,901 related to financial exploitation in the over 60s.
- $ figures achieved by taking the average dollar amount lost per case across FinCEN, IC3, FTC, and known APS/crime figures ($57,070) before multiplying by the report figures mentioned above.
Michigan
- APS received 27,834 total referrals for the year. No age breakdown so average of 78.79% of FE cases relating to over 60s used. And the average % related to financial exploitation (20.87 percent) used = 4,576.
- $ figures achieved by taking the average dollar amount lost per case across FinCEN, IC3, FTC, and known APS/crime figures ($57,070) before multiplying by the report figures mentioned above.
Minnesota
- APS Report -1,958 financial abuse (fiduciary) allegations received and 5,933 non-fiduciary allegations in the over 65s, totaling 7,891.
- $ figures achieved by taking the average dollar amount lost per case across FinCEN, IC3, FTC, and known APS/crime figures ($57,070) before multiplying by the report figures mentioned above.
Mississippi
- Department of Human Services reports 7,249 referrals to the APS. No age breakdown so average of 78.79% of FE cases relating to over 60s used. And the average % related to financial exploitation (20.87 percent) used = 1,192.
- $ figures achieved by taking the average dollar amount lost per case across FinCEN, IC3, FTC, and known APS/crime figures ($57,070) before multiplying by the report figures mentioned above.
Missouri
- No specific reports on elder fraud.
- Report figures achieved by multiplying the average reporting rate from all other states (0.0030 reports per senior) to the total elderly population in Missouri to get an estimated number of reported cases.
- $ figures achieved by taking the average dollar amount lost per case across FinCEN, IC3, FTC, and known APS/crime figures ($57,070) before multiplying by the report figures mentioned above.
Montana
- No update for fiscal year 2023
- An estimate of figures was achieved by finding the average percent increase/decrease from other states where exact figures were provided over the last two years. The average percentage increase across 15 states was 16.13.
- In 2021, the Department of Public Health and Human Services said 4,900 people were victims of elder abuse. No breakdown for type of abuse so NAMRS figure of 14 percent of cases relating to financial exploitation applied = 686.
- A 16.13 percent increase on 686 = 797 estimated APS cases for 2023.
- $ figures achieved by taking the average dollar amount lost per case across FinCEN, IC3, FTC, and known APS/crime figures ($57,070) before multiplying by the report figures mentioned above.
Nebraska
- No specific reports on elder fraud.
- Report figures achieved by multiplying the average reporting rate from all other states (0.0030 reports per senior) to the total elderly population in Nebraska to get an estimated number of reported cases.
- $ figures achieved by taking the average dollar amount lost per case across FinCEN, IC3, FTC, and known APS/crime figures ($57,070) before multiplying by the report figures mentioned above.
Nevada
- Adult Protective Services – 2,360 cases of exploitation with 87 percent of cases relating to those over 60 = 2,053
- $ figures achieved by taking the average dollar amount lost per case across FinCEN, IC3, FTC, and known APS/crime figures ($57,070) before multiplying by the report figures mentioned above.
New Hampshire
- No specific reports on elder fraud.
- Report figures achieved by multiplying the average reporting rate from all other states (0.0030 reports per senior) to the total elderly population in New Hampshire to get an estimated number of reported cases.
- $ figures achieved by taking the average dollar amount lost per case across FinCEN, IC3, FTC, and known APS/crime figures ($57,070) before multiplying by the report figures mentioned above.
New Jersey
- No specific reports on elder fraud.
- Report figures achieved by multiplying the average reporting rate from all other states (0.0030 reports per senior) to the total elderly population in New Jersey to get an estimated number of reported cases.
- $ figures achieved by taking the average dollar amount lost per case across FinCEN, IC3, FTC, and known APS/crime figures ($57,070) before multiplying by the report figures mentioned above.
New Mexico
- APS Report – 12,560 reports in total. 2,343 of 10,425 allegations related to financial exploitation (22.47%). 74.64 percent of all cases are related to over 60s which equates to 2,107.
- $ figures achieved by taking the average dollar amount lost per case across FinCEN, IC3, FTC, and known APS/crime figures ($57,070) before multiplying by the report figures mentioned above.
*New Mexico provided the total number of complaints received, and the total number of allegations made, suggesting complaints might have had more than one allegation type.
New York
- No specific reports on elder fraud.
- Report figures achieved by multiplying the average reporting rate from all other states (0.0030 reports per senior) to the total elderly population in New York to get an estimated number of reported cases.
- $ figures achieved by taking the average dollar amount lost per case across FinCEN, IC3, FTC, and known APS/crime figures ($57,070) before multiplying by the report figures mentioned above.
North Carolina
- 15,047 APS clients over 60 in FY 2022/23. No breakdown for type of abuse so the average % related to financial exploitation (20.87 percent) was used = 3,140.
- $ figures achieved by taking the average dollar amount lost per case across FinCEN, IC3, FTC, and known APS/crime figures ($57,070) before multiplying by the report figures mentioned above.
North Dakota
- No specific reports on elder fraud.
- Report figures achieved by multiplying the average reporting rate from all other states (0.0030 reports per senior) to the total elderly population in North Dakota to get an estimated number of reported cases.
- $ figures achieved by taking the average dollar amount lost per case across FinCEN, IC3, FTC, and known APS/crime figures ($57,070) before multiplying by the report figures mentioned above.
Ohio
- APS Report – 9,545 reports of financial exploitation for all ages, 95.5 percent of cases related to adults aged 60+ = 9,068.
- $ figures achieved by taking the average dollar amount lost per case across FinCEN, IC3, FTC, and known APS/crime figures ($57,070) before multiplying by the report figures mentioned above.
Oklahoma
- DHS Report – 28,488 reports received for alleged abuse, neglect or exploitation. No age breakdown so average of 78.79% of FE cases relating to over 60s used. And the average % related to financial exploitation (20.87 percent) used = 4,684.
- $ figures achieved by taking the average dollar amount lost per case across FinCEN, IC3, FTC, and known APS/crime figures ($57,070) before multiplying by the report figures mentioned above.
Oregon
- No specific reports on elder fraud.
- Report figures achieved by multiplying the average reporting rate from all other states (0.0030 reports per senior) to the total elderly population in Oregon to get an estimated number of reported cases.
- $ figures achieved by taking the average dollar amount lost per case across FinCEN, IC3, FTC, and known APS/crime figures ($57,070) before multiplying by the report figures mentioned above.
Pennsylvania
- APS Report – 53,873 reports in total. 31 percent related to financial exploitation in the over 60s = 16,701.
- $ figures achieved by taking the average dollar amount lost per case across FinCEN, IC3, FTC, and known APS/crime figures ($57,070) before multiplying by the report figures mentioned above.
Rhode Island
- No specific reports on elder fraud.
- Report figures achieved by multiplying the average reporting rate from all other states (0.0030 reports per senior) to the total elderly population in Rhode Island to get an estimated number of reported cases.
- $ figures achieved by taking the average dollar amount lost per case across FinCEN, IC3, FTC, and known APS/crime figures ($57,070) before multiplying by the report figures mentioned above.
South Carolina
- APS Report – 409 reports of exploitation. No age breakdown so average of 78.79% of FE cases relating to over 60s used = 322.
- $ figures achieved by taking the average dollar amount lost per case across FinCEN, IC3, FTC, and known APS/crime figures ($57,070) before multiplying by the report figures mentioned above.
South Dakota
- No specific reports on elder fraud.
- Report figures achieved by multiplying the average reporting rate from all other states (0.0030 reports per senior) to the total elderly population in South Dakota to get an estimated number of reported cases.
- $ figures achieved by taking the average dollar amount lost per case across FinCEN, IC3, FTC, and known APS/crime figures ($57,070) before multiplying by the report figures mentioned above.
Tennessee
- DHS Report – 23,437 total reports, with around 1,650 for financial exploitation*. No age breakdown so average of 78.79% of FE cases relating to over 60s used = 1,300.
- $ figures achieved by taking the average dollar amount lost per case across FinCEN, IC3, FTC, and known APS/crime figures ($57,070) before multiplying by the report figures mentioned above.
*For this update, Tennessee didn’t report exact figures for financial exploitation and instead provided a guideline of figures displayed on a bar graph.
Texas
- APS Report – 11,484 allegations of exploitation in the over 65s.
- $ figures achieved by taking the average dollar amount lost per case across FinCEN, IC3, FTC, and known APS/crime figures ($57,070) before multiplying by the report figures mentioned above.
Utah
- Senior Services Division reported 937 APS reports in total. 75.14% related to the over 60s. No breakdown for type of abuse so the average % related to financial exploitation (20.87 percent) was used = 147.
- $ figures achieved by taking the average dollar amount lost per case across FinCEN, IC3, FTC, and known APS/crime figures ($57,070) before multiplying by the report figures mentioned above.
Vermont
- APS Report – 3,985 total reports. No age breakdown so average of 78.79% of FE cases relating to over 60s used. And the average % related to financial exploitation (20.87 percent) for FE used = 655.
- $ figures achieved by taking the average dollar amount lost per case across FinCEN, IC3, FTC, and known APS/crime figures ($57,070) before multiplying by the report figures mentioned above.
Virginia
- APS Report – 43,443 reports received, 79 percent related to over 60s and 13.79 percent related to financial exploitation = 4,733
- Crime Statistics – Average loss to fraud-related crimes is $10,256 (figures used to determine average lost to APS and LTCO cases).
Washington
- APS Report – 66,716 reports in total. 30.67 percent related to financial exploitation and 82.95 percent for over 60s = 16,973.
- $ figures achieved by taking the average dollar amount lost per case across FinCEN, IC3, FTC, and known APS/crime figures ($57,070) before multiplying by the report figures mentioned above.
West Virginia
- No specific reports on elder fraud.
- Report figures achieved by multiplying the average reporting rate from all other states (0.0030 reports per senior) to the total elderly population in West Virginia to get an estimated number of reported cases.
- $ figures achieved by taking the average dollar amount lost per case across FinCEN, IC3, FTC, and known APS/crime figures ($57,070) before multiplying by the report figures mentioned above.
Wisconsin
- APS Report – 2,340 reports of financial exploitation.
- $ figures achieved by taking the average dollar amount lost per case across FinCEN, IC3, FTC, and known APS/crime figures ($57,070) before multiplying by the report figures mentioned above.
Wyoming
- APS Report – 2,389 reports in total. No age breakdown so average of 78.79% of FE cases relating to over 60s used. And the average % related to financial exploitation (20.87 percent) for FE used = 393.
- $ figures achieved by taking the average dollar amount lost per case across FinCEN, IC3, FTC, and known APS/crime figures ($57,070) before multiplying by the report figures mentioned above.
Other sources:
State age statistics: https://agid.acl.gov/
FinCEN SAR statistics: https://www.fincen.gov/reports/sar-stats
IC3 statistics: https://ic3.gov
FTC statistics: https://www.ftc.gov/
LTCO statistics:https://ltcombudsman.org/omb_support/nors
Tips for preventing elder fraud
Despite the worrying prevalence of elder financial exploitation, there are some simple steps seniors and their friends, caregivers, and relatives can take to prevent fraudulent activities. We’ve listed 10 of these below:
- Plan ahead to ensure your assets are fully protected and your wishes will be followed. You might want to talk to a financial advisor or an attorney to find the best options for you.
- Always shred bank statements and receipts as well as unused credit cards before you throw them away.
- Never discuss your financial information with anyone you don’t know or trust. This includes giving someone your bank details, Social Security Number, and any other financial information over the phone.
- Order a copy of your credit report every year to make sure it’s accurate and that there aren’t any accounts on there that you don’t recognize. You could also sign up for identity theft protection so professionals are constantly monitoring your accounts for suspicious activities.
- Thoroughly check credentials and references before you hire anyone and don’t give workers access to your financial information. For example, you may want to lock up your account statements, checkbook, and other sensitive documents while others are in your home.
- Look out for charity fraud hoaxes by doing thorough research into the charity, not responding to solicitations for donations, not sending any of your bank details or mailing cash, and discussing the charity with your friends and family first.
- Never pay taxes or fees to collect lottery “winnings” or sweepstakes.
- Pay for things using your debit or credit card so you have a paper trail of all the transactions you’ve made.
- Trust your gut. If something doesn’t feel right – tell someone. And if you do feel threatened or intimidated (or you’re concerned for an elderly person you know), contact your local Adult Protective Service.
- Finally, don’t be afraid to say “no.” This is your money and you’re entitled to say how you want to use it.
Data researcher: Charlotte Bond