

For comprehensive Microsoft monitoring, the right SQL query optimizer is a must. In this article, we’re going to look at the best software.
Here is our list of the best SQL software and query optimization tools:
- ManageEngine Applications Manager EDITOR’S CHOICE A monitoring system for applications that includes database monitoring and query performance analysis. Available for Windows Server and Linux. Get a 30-day free trial.
- Paessler PRTG Network Monitor (FREE TRIAL) A network, server, and application monitor that includes monitors for SQL Server, Oracle SQL, MySQL, and PostgreSQL databases. Download a 30-day free trial.
- Site24x7 SQL Server Performance Monitoring (FREE TRIAL) Database monitoring as part of a system monitoring tool that covers networks, servers, services, applications, and websites. This is a cloud-based service. Get a 30-day free trial.
- Idera DB Optimizer (FREE TRIAL) A query optimizer for SQL Server, Oracle, and Sybase. Spots inefficiencies in database queries and produces recommended fixes.
- Redgate SQL Monitor A query optimization monitor for SQL Server that covers more than 40 conditions.
- EverSQL An SQL tuner that automatically rewrites queries to improve database server performance.
- dbForge Studio SQL editor that includes a range of utilities, including a query builder, an auto-complete system for developers typing in queries and code explorer.
- SolarWinds Database Performance Analyzer Performance monitoring for relational databases such as Azure SQL, MySQL, Aurora, ASE, Oracle, MariaDB, and IBM Db2 databases. Runs on Windows Server.
- Microsoft SQL Server Management Studio (SSMS) Free tool from Microsoft for its SQL Server system. This query editor includes tuning analysis.
Why do I need an SQL server tuning tool?
Tuning SQL server queries is essential for optimizing query performance and is part of all good database management software. If queries are running slow or failing, then performance monitoring and SQL tuning can help to make your code more efficient. However, doing this manually without a query optimization tool is difficult because you need to do everything manually with limited functionality.
Finding database queries that aren’t up to scratch is a painstaking task. Server optimization tools are invaluable because they allow you to view queries with poor performance and locate resource bottlenecks more easily. They also allow you to gather performance statistics which can help to improve SQL queries in the future.
Many tools can do this automatically with alerts and automated responses so that queries will be improved without the need for user intervention. Using an SQL server tuning tool helps to improve your server performance and increases your responsiveness to managing server problems. For example, with a Structured Query Language monitoring tool, you can tune SQL server queries before you start experiencing performance issues.
How to Optimize & Tune SQL Queries
SQL query optimization is part of the business process. Your SQL queries might not be bringing back the right information because the person that wrote the query didn’t understand the data request and hasn’t studied the structure of the database. So, optimization begins right at the creation of the database and each time a request for data arises.
- Understand the core data of the business Focus the design of the database on tables that hold the core data of the business and normalize tables accordingly.
- Make full use of indexes Read through the list of indexes on the tables that you are joining together and make sure you use these as often as possible. Look out for composite indexes, adding an extra field in your join could speed up the search.
- Find out how the RDBMS implements WHERE clauses Some RDBMSs work through the lines in the WHERE clause from the bottom up.
- Sequence joins in the WHERE clause Order your WHERE clause to filter out the most records with the first join. Make joins on ID fields first and leave text field joins to the very end of the query.
- Tighten up joins Avoid outer joins wherever possible. Make sure that you have fully linked records in tables and that you are not creating a “times.”
- Avoid comparisons Make concrete links between tables first and leave filters that use lists or wildcards to the end of the execution.
- Look for resource spikes during execution Queries that hit the performance limits of the RDMS will always take a long time to run.
- Use SQL performance tuning tools Experienced programmers understand SQL performance intuitively; everyone else needs a tool that can trace the implementation of the SQL line by line and identify joins that require excessive resources.
Related post: Best Tools for Oracle Database Management & Troubleshooting
The best SQL Software and Query Optimization Tools
Key Features of the SQL Query Optimization Tools:
- SQL Tuning – SQL query optimization tools with SQL tuning rewrite SQL statements to improve server performance and speed up data retrieval.
- Monitor Cloud Databases – Many SQL query optimizers can monitor relational databases in the cloud.
- Optimize SQL Queries Online – Optimize SQL queries remotely via your device or web browser.
Our methodology for selecting SQL query optimization tools
We reviewed the market for SQL software and analyzed the options based on the following criteria:
- An SQL query editor that includes color coding for different categories of keywords
- A brackets matcher in the editor
- A suggested query clause reorganizer
- The ability to analyze the indexes in the instance and suggest improvements
- Suggested improvements in table normalization and possible denormalization
- A free trial or a money-back guarantee for a risk-free assessment period
- A service that will improve efficiency and repay its purchase price
1. ManageEngine Applications Manager (FREE TRIAL)

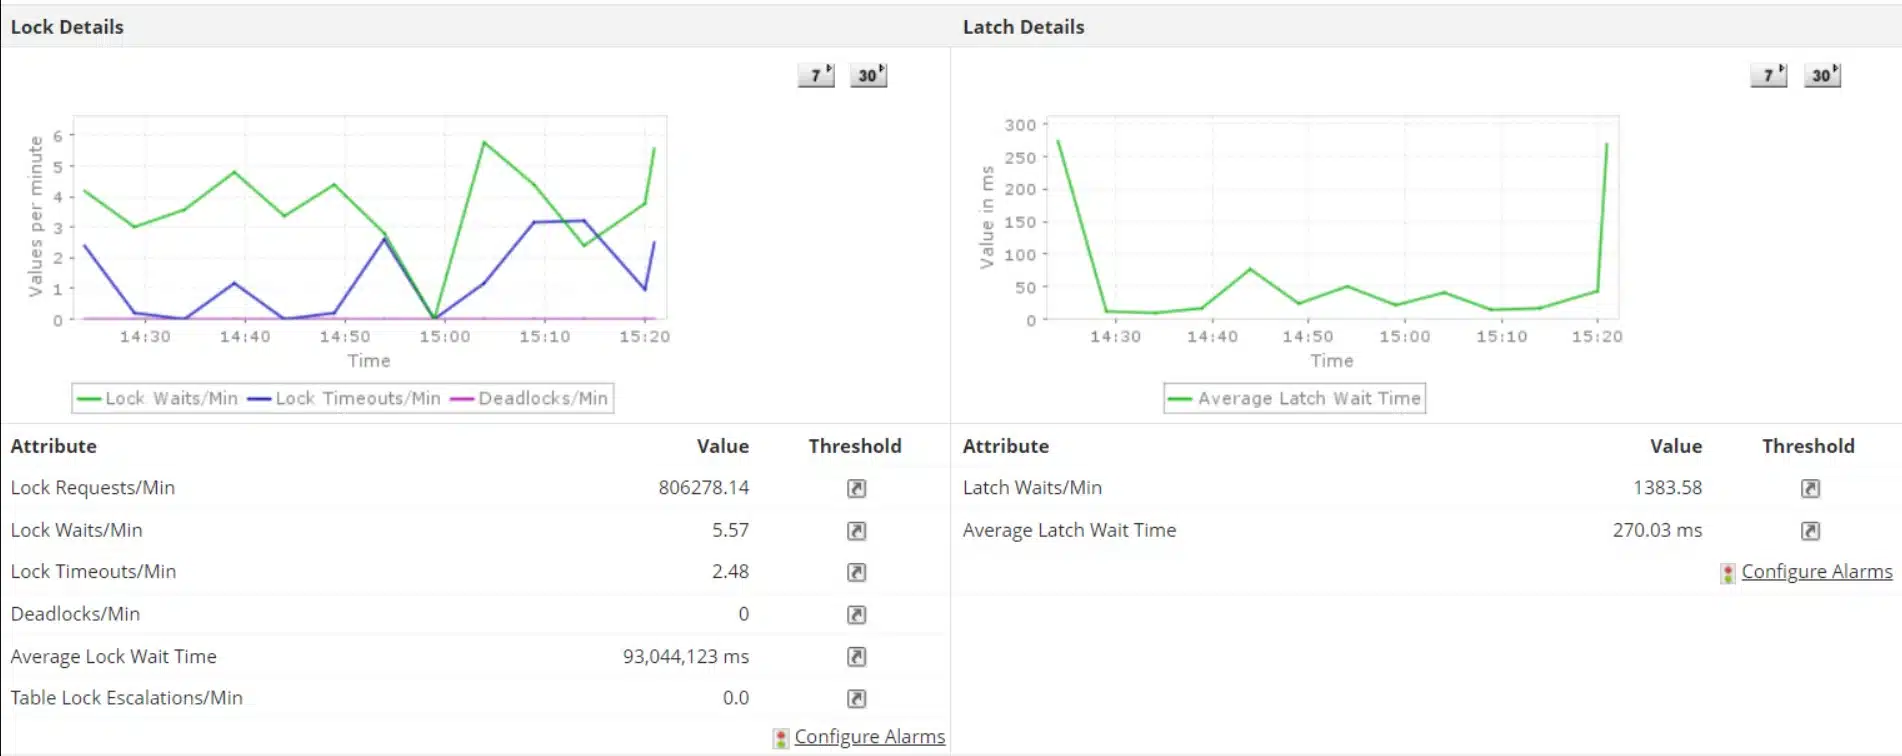
Databases are among the many categories of applications that are covered by ManageEngine Applications Manager. This service can monitor non-SQL databases, such as NoSQL, in-memory, and big data systems as well as SQL-based relational database management systems.
Key Features:
- Diverse Database Support: Monitors a wide range of SQL and NoSQL databases.
- Detailed SQL Analysis: Provides in-depth insights into SQL query performance.
- Application Dependency Mapping: Reveals interconnections for easier problem-solving.
- Resource Usage Tracking: Memory, disk space, I/O.
- Lock Metrics: Looks at deadlocks, lock duration, and wait times.
Why do we recommend it?
ManageEngine Applications Manager is able to track activity in SQL Server, Oracle, Sybase, MySQL, MariaDB, DB2, Informix, PostgreSQL, and SAP MaxDB.It can also monitor NoSQL systems, such as Apache Cassandra. The tool discovers all applications and draws up a dependency map, which identifies the root cause of problems when issues arise.
The Applications Manager monitors the performance of databases, looking at the metrics of normal operations, such as resource usage, buffer cache size, user sessions, and locks. It particularly tracks SQL query performance.
The monitor follows queries before they even get to the database. It starts by tracking the execution of code that implements database access as it sends the SQL that is going to be executed. This strategy, including logging the return of results and how they are used, means that the monitor records the full cycle of interaction between an application and the database.
Overall performance is then broken down per step. So, the system manager can see which action is underperforming if user-facing software starts to perform badly. If the issue seems to be with the database, the metrics gathered by the Applications Manager make it clear whether the issue is with lack of physical resources, a problem with database objects, or an error in the SQL statement.
SQL analysis identifies system errors and structure problems as well as query execution plans. The whole purpose of the Applications Manager’s database monitoring service is to quickly identify the root cause of performance issues.
Who is it recommended for?
This package is suitable for businesses of all sizes. There is a Free edition for very small businesses that will provide five monitors. The base package for the Standard Editon is reasonably priced and accessible to most small businesses. Larger companies pay extra for more capacity.
Pros:
- Comprehensive Monitoring: Tracks various metrics like user sessions and cache size for detailed analysis.
- Real-Time Alerts: Notifies about performance issues promptly, allowing for quick response.
- Effective Root Cause Identification: Helps in pinpointing the exact source of performance problems.
- Free Edition: Monitors five resources.
- Can be Run on the Cloud: Available for AWS and Azure as well as Windows Server and Linux on-premises.
Cons:
- No Cloud-Based Version: The lack of a SaaS offering might restrict usage flexibility for some organizations.
ManageEngine Applications Manager runs on Windows Server and Linux. It is available in three editions: Free, Professional, and Enterprise. The Professional edition gives access to 500 application monitors and there are advanced features in the Enterprise edition. The Free edition can only run five system monitors. ManageEngine offers Applications Manager on a 30-day free trial.
EDITOR'S CHOICE
ManageEngine Applications Manager is our top pick for an SQL query optimization tool because it provides comprehensive performance monitoring and diagnostic capabilities. It provides a holistic view of SQL databases, helping organizations optimize query performance and maintain database health. Applications Manager offers real-time monitoring and detailed query analytics, enabling users to identify inefficient queries quickly. It provides deep insights into execution times, resource utilization, and query plans, helping pinpoint bottlenecks. It tracks critical metrics such as CPU usage, disk I/O, and memory utilization. With customizable threshold-based alerts, administrators are notified of potential issues before they escalate, ensuring optimal database performance. The tool supports a wide range of databases, including MySQL, SQL Server, Oracle, and PostgreSQL. This broad compatibility makes it ideal for organizations with diverse database environments. Beyond identifying slow queries, Applications Manager offers actionable insights and recommendations for improving performance. It suggests indexing strategies, optimizes query structures, and highlights unused or redundant indexes. The service’s well-designed dashboard allows for easy navigation, with clear visualizations of database performance. Even less experienced users can quickly grasp complex database metrics. In addition to its SQL query monitoring system, Appliciaotns Manager is able to supervise many other applications and software packages, discovering them and identifying the relationships between them. This enables the system to project upcoming system requirements and identify resource shortages ahead of time.
Download: Get a 30-day FREE Trial
Official Site: https://www.manageengine.com/products/applications_manager/download.html/
OS: Windows Server, Linux, AWS, and Azure
2. Paessler PRTG Network Monitor (FREE TRIAL)
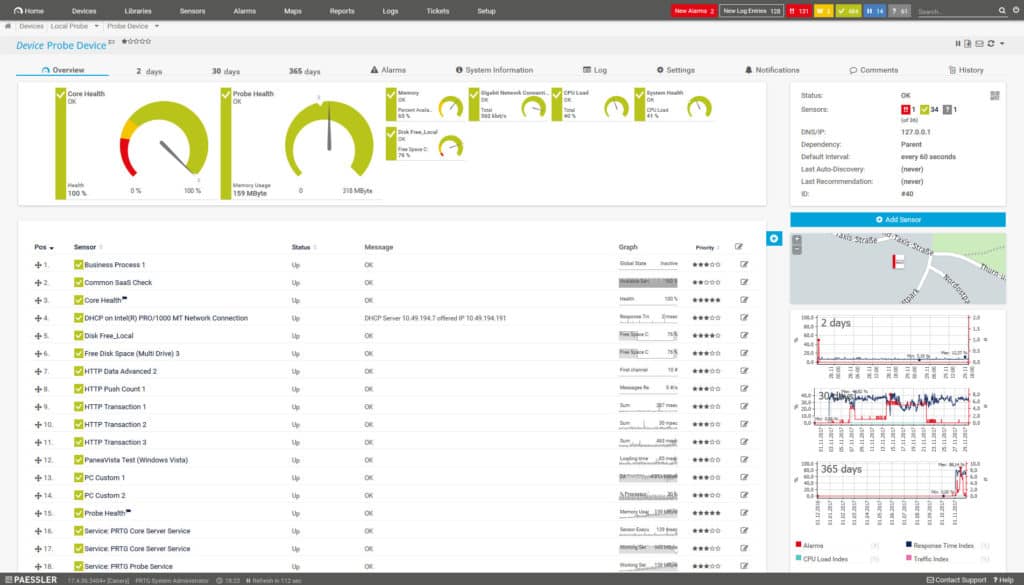
Next on this list of database management software, we have Paessler PRTG Network Monitor, a network monitoring tool that offers a diverse database monitoring experience. PRTG Network Monitor can monitor relational databases such as Microsoft SQL, Oracle SQL, MySQL, and PostgreSQL. Monitoring on this tool is achieved through the use of sensors that monitor individual databases. These sensors are preconfigured for each major database so that you don’t have to tweak anything once you start up for the first time.
Key Features:
- Diverse DBMS Sensors: Offers specialized sensors for each major database system for targeted monitoring.
- Performance Tracking: Highlights long-running queries and provides database activity statistics.
Why do we recommend it?
Paessler PRTG Network Monitor is a misleading name for a system monitoring tool that also watches over servers, cloud platforms, middleware, and applications. The package includes sensors for SQL Server, MySQL, Oracle, SAP, and PostgreSQL databases. You would need to activate a specialized sensor for each of these DBMSs.
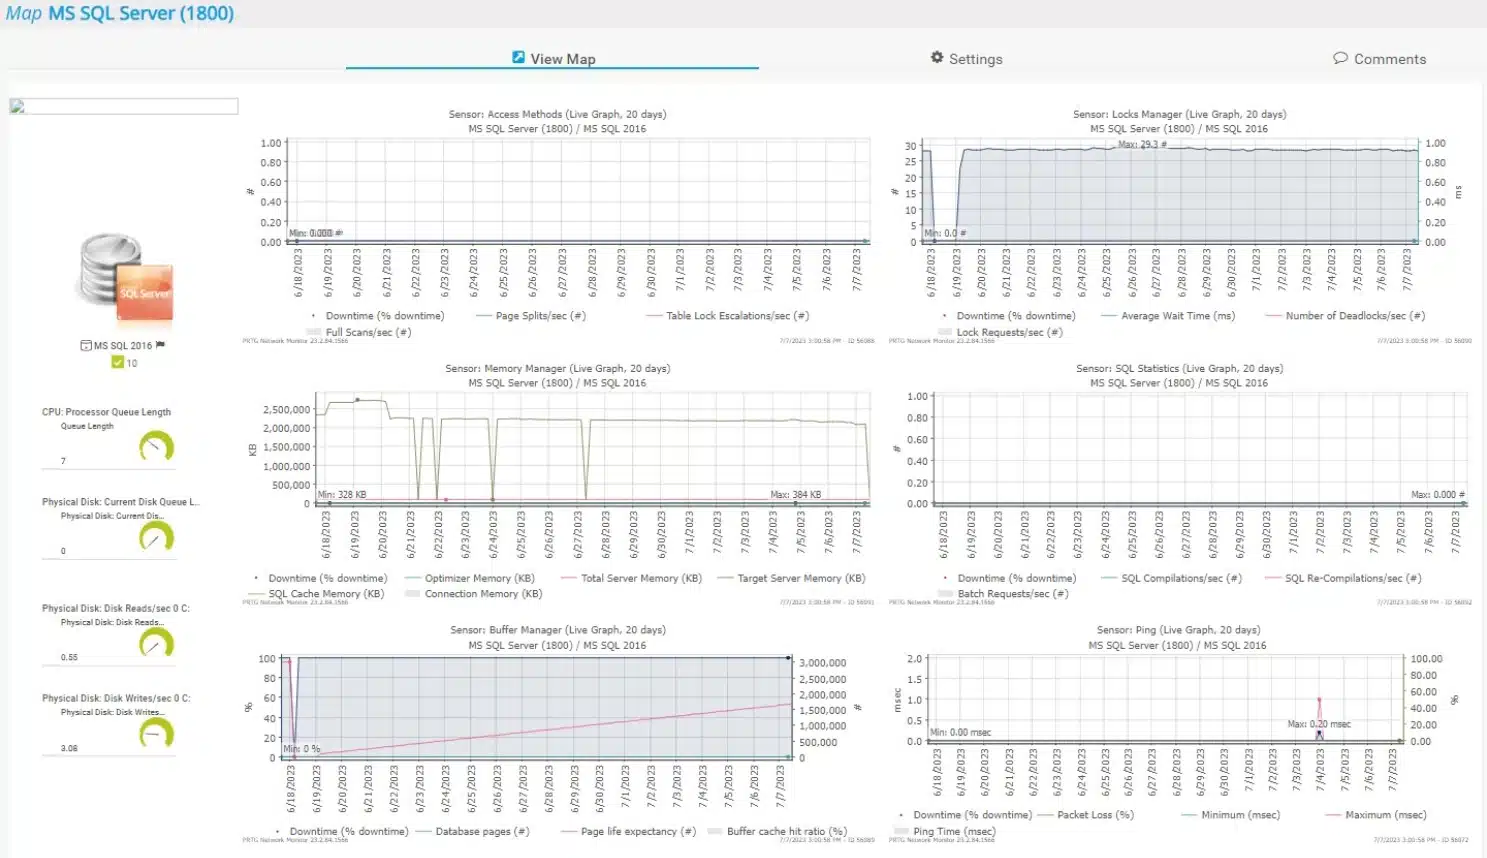
PRTG Network Monitor makes monitoring SQL query optimization easy, and measures how long an SQL query request takes from start to finish. The query execution time of the request is then shown on the dashboard so that you can see if there are any problems. In addition, you can also monitor your wider network to identify any performance issues that could have an influence on your database servers.
The PRTG Network Monitor alerts system helps to make sure that you don’t miss any key information. Once a problematic activity is recognized you are sent a notification immediately. Alerts are sent to you via email, SMS, or push notifications on Android, iOS, and Windows Phones. There is also an API that you can use to write your own notification scripts if you want further control over the notifications you request.
Who is it recommended for?
PRTG includes a device and application discovery service. It maintains a network inventory and creates a topology map, so you can locate each host on your network and then look at its activity. SQL sensors supplement this view and give you a way to coordinate database and server resource monitoring.
Pros:
- Versatile Database Monitoring: Supports various databases including SQL Server and PostgreSQL, catering to a wide range of needs.
- Effective Alert System: Ensures key information is not missed by promptly notifying about problematic activities.
- Free Version Availability: Offers a no-cost option, making it accessible for small businesses or trial purposes.
Cons:
- Limited Database Tuning Advice: Does not provide specific guidance on query optimization or database tuning, which might be a drawback for some users.
PRTG Network Monitor is available as both a paid and a free tool. The paid versions of PRTG Network Monitor start from $1600 (£1,206) for 500 sensors and one server installation to $60,000 (£45,237) for unlimited sensors with five server installations. There is also a 30-day free trial.
Related post: Best PostgreSQL Monitoring Tools
3. Site24x7 SQL Server Performance Monitoring (FREE TRIAL)

Site24x7 Infrastructure is a cloud-based monitoring system that covers database monitoring. It is able to monitor database instances that are managed by SQL Server, MySQL, Oracle, PostgreSQL, DB2, MongoDB, VoltDB, Cassandra, CouchDB, and ClickHouse DBMSs.
Key Features:
- SaaS Model: Cloud-based approach for easy accessibility and management.
- Integrated Monitoring: Combines database, network, and application monitoring for a holistic view.
- Efficient Root Cause Analysis: Quickly identifies the underlying causes of performance issues.
Why do we recommend it?
Site24x7 SQL Server Performance Monitoring is part of a cloud platform of monitoring systems that covers networks, servers, middleware, applications, cloud platforms, and websites. The tool works on database logs, so its monitoring activity won’t place any load on your databases. It identifies inefficient queries.
Database monitoring is just one of the responsibilities of Site24x7 Infrastructure. It also monitors networks, servers, applications, services, and websites. Its purpose is to link together all of the application stack that lies behind a web page or a user-facing software package. By the use of this application dependencies map, the system can perform root cause traces to identify the cause of performance issues in front-end systems.
The database monitoring features of Site24x7 collects statistics on read and write activities, slow queries, aborted clients, threads, and open files. It monitors total temporary tables, space used by temporary tables, temporary tables on disk, and temporary table removal. The system also tracks database connection usage, aborted connections, and the maximum number of used connections.
Thanks to the application stack map, the Site24x7 Infrastructure system can spot when performance problems in other parts of the system are the cause of database performance problems. It can identify the resources of the supporting host that are used by the database and spot when those resources are running low.
Site24x7 Infrastructure database monitoring includes a system of performance and resource availability thresholds. This generates alerts if a problem arises or if resources are running low. The alerts can be forwarded to key staff by SMS, email, voice call, or instant messaging post. This alerting mechanism automates system supervision because it removes the need for human involvement unless things go wrong.
Who is it recommended for?
This system is good for small businesses because its base packages are priced for low monitoring capacity and larger business pay for extra data throughput. Its cloud hosts are capable of very heavy processing and can cover multiple sites in one account – attributes that will attract large businesses.
Pros:
- Broad Database Support: Covers a range of databases including SQL Server, MySQL, and Oracle for comprehensive monitoring.
- Live Activity Tracking: Provides real-time statistics on database operations, enhancing visibility and control.
- Proactive Alerting System: Sends performance alerts to prevent potential issues from escalating.
Cons:
- Limited Base Plan Capacity: The initial plan may be restrictive for larger organizations, necessitating additional costs for expansion.
The charge for Site24x7 Infrastructure is $9 per month if paid annually. You can access a 30-day free trial of the service.
4. Idera DB Optimizer (FREE TRIAL)
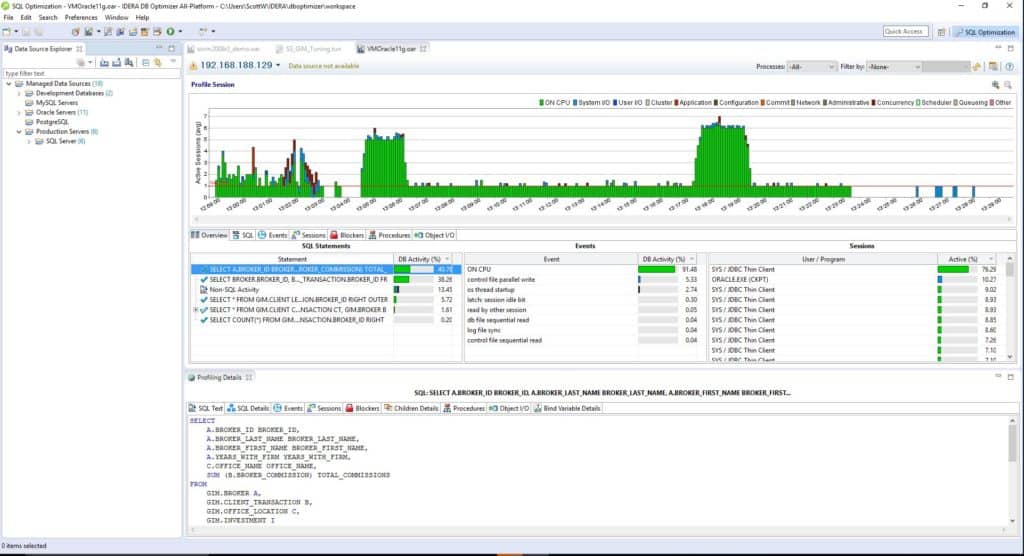
Few tools offer as straightforward an SQL tuning experience as Idera DB Optimizer. With DB Optimizer you can tune SQL on Oracle, SQL Server, DB2 and Sybase. The SQL tuning wizard automatically provides suggestions for tuning and improving SQL code. This ensures that your code performs the best it can.
Key Features:
- Guided SQL Tuning: Provides step-by-step recommendations for optimizing SQL queries.
- Bottleneck Spotting: Identifies performance issues in databases efficiently.
- Live Activity Monitoring: Tracks real-time database operations for immediate insights.
Why do we recommend it?
Idera DB Optimizer is able to tune SQL queries for SQL Server, Oracle, PostgreSQL, DB2, and many other RDBMSs – surprisingly, MySQL is not on the list. The system also provides a query editor, showing database objects, where SQL queries can be developed. It will also show how a query runs.
Monitoring for performance bottlenecks is another task that DB Optimizer does very well. You can view a graph of wait-time analysis to view the underlying causes of poor database performance.
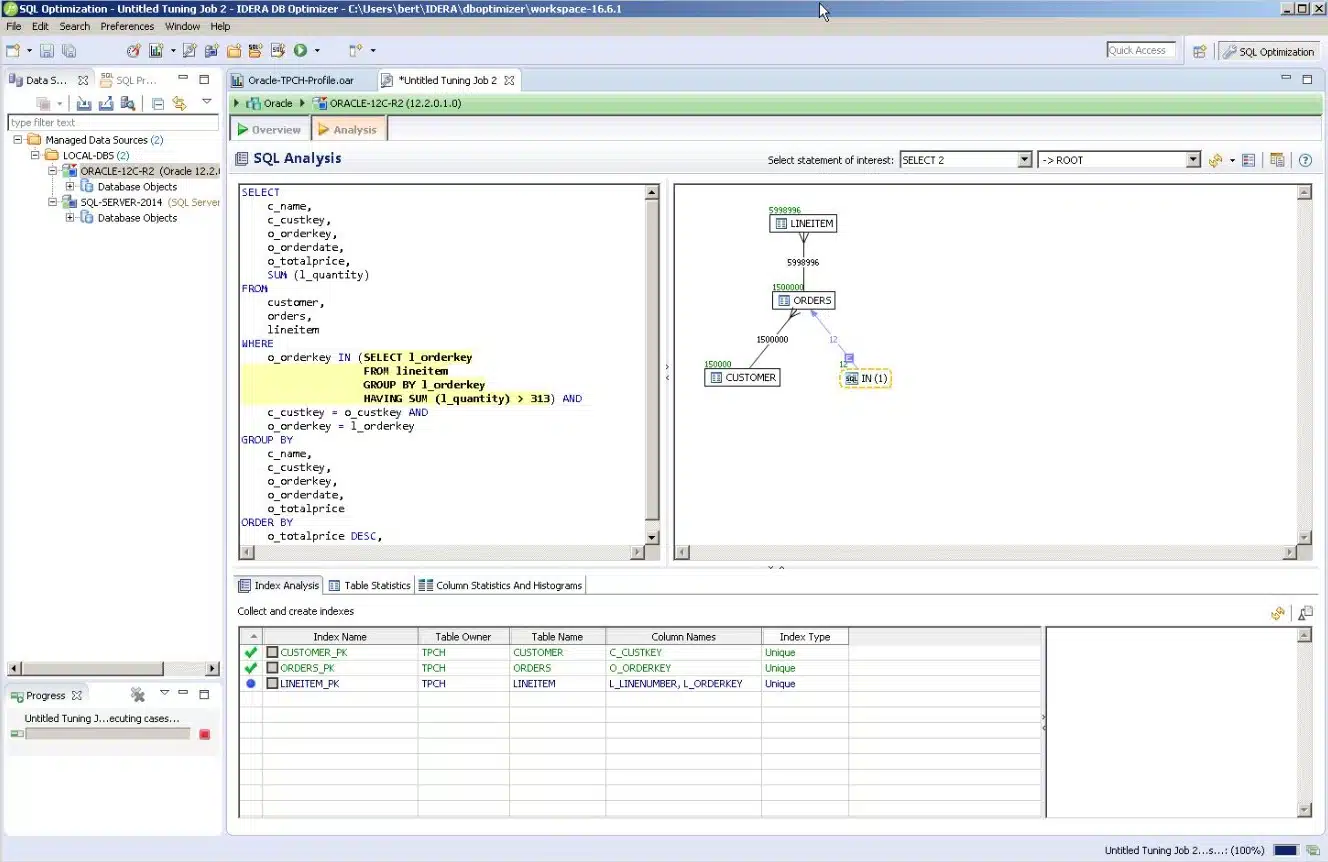
There is also the option to run SQL queries with alternative execution paths until you find the most efficient SQL statement. Once you find a more efficient alternative you can make the change with one click.
Who is it recommended for?
The tool will suggest keywords as the developer types and it will even reorder clauses to optimize them. This is a great teaching tool for inexperienced coders and provides a validation check for queries before you allow them to be rolled out to the live system.
Pros:
- Supports Major RDBMS: Compatible with popular databases like Oracle and Sybase, ensuring wide applicability.
- Intuitive Interface: Offers an easy-to-use platform, especially beneficial for less experienced users.
- Effective Optimization Suggestions: Helps in enhancing SQL performance with practical advice.
Cons:
- No MySQL Support: The absence of compatibility with MySQL may limit its applicability for certain environments.
Overall DB Optimizer is a SQL tuning tool that is ideal for midsize organizations. DB Optimizer starts at a price of $572 (£431) per user. There is also a 14-day free trial.
5. Redgate SQL Monitor
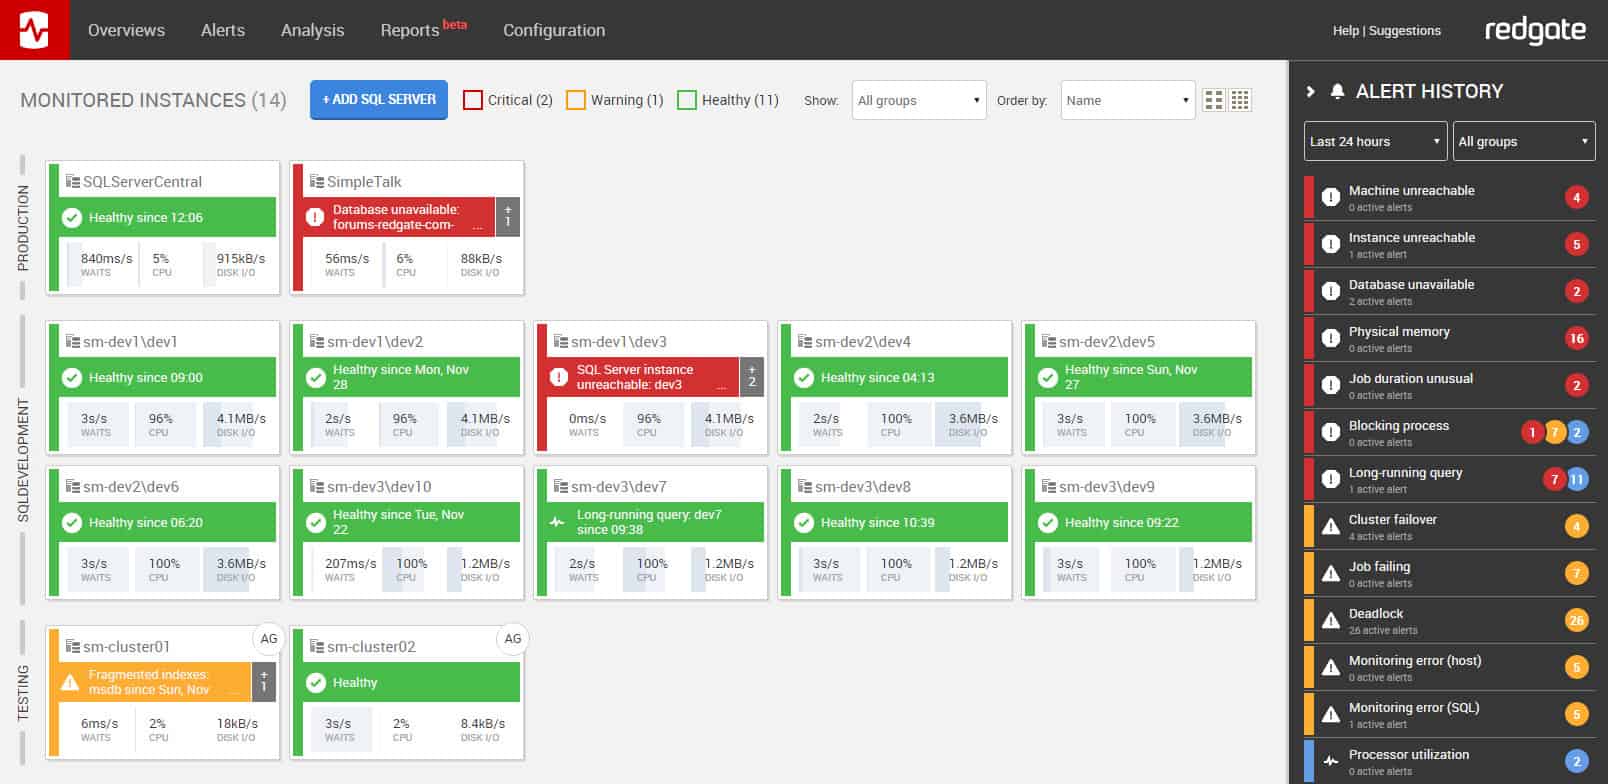
Redgate SQL Monitor is another widely-used query optimization tool. Redgate SQL Monitor adds a state-of-the-art dashboard to help monitor SQL performance. Through the dashboard, you can view an overview of your SQL servers that updates every 15 seconds.
Key Features:
- Live Performance Tracking: Offers real-time monitoring of SQL Server instances.
- Color-Coded Statuses: Simplifies identification of database health with visual cues.
Why do we recommend it?
Redgate SQL Monitor is a live performance tracker for SQL Server instances. This package is implemented as on-premises software for Windows Server. The system is able to centralize the monitoring of databases on different sites and cloud platforms in one console. It provides alerts for performance issues, such as long-running queries.
In other words, you can easily stay on top of the status of your SQL infrastructure without missing anything important. The instance timeline is particularly useful as it shows you the CPU, Memory, Disk I/O, and Waits of your database.
There is also an alerts system to keep you updated on performance changes. Redgate SQL Monitor comes with over 40 customizable templates to warn you about all the common performance issues, whether a query is performing poorly or processes are being blocked.

Troubleshooting is another area that Redgate SQL Monitor does remarkably well. Once you discover a performance problem, the platform provides you with additional metrics to help pinpoint the root cause. Metrics can be compared to baseline activity to find what caused the problem. We feel this is a good SQL management tool with a good dashboard and great performance.
Who is it recommended for?
This system is a live monitor rather than a database or query analysis tool. You would buy this system for use by a DBA. However, you could also get database monitoring with alerts from the system-wide platforms on this list, such as the Site24x7 package.
Pros:
- Multi-Instance Monitoring: Allows tracking of multiple database instances from a single overview, enhancing manageability.
- Detailed Metrics for Troubleshooting: Provides granular data to assist in pinpointing performance issues.
- Customizable Alert Templates: Offers over 40 templates for various common performance issues.
Cons:
- Short Trial Period: A 14-day trial may be insufficient for comprehensive evaluation by some users.
In terms of pricing, Redgate SQL Monitor’s price depends on how many servers you wish to support. Between 1-4 servers the price per server is $1,565 (£1,179). Between 5-9 servers the price is $1,330 (£1,002) per server. If you require over 10 servers then you can contact the company directly for a custom quote. There is also a 14-day free trial which you can download here.
6. EverSQL
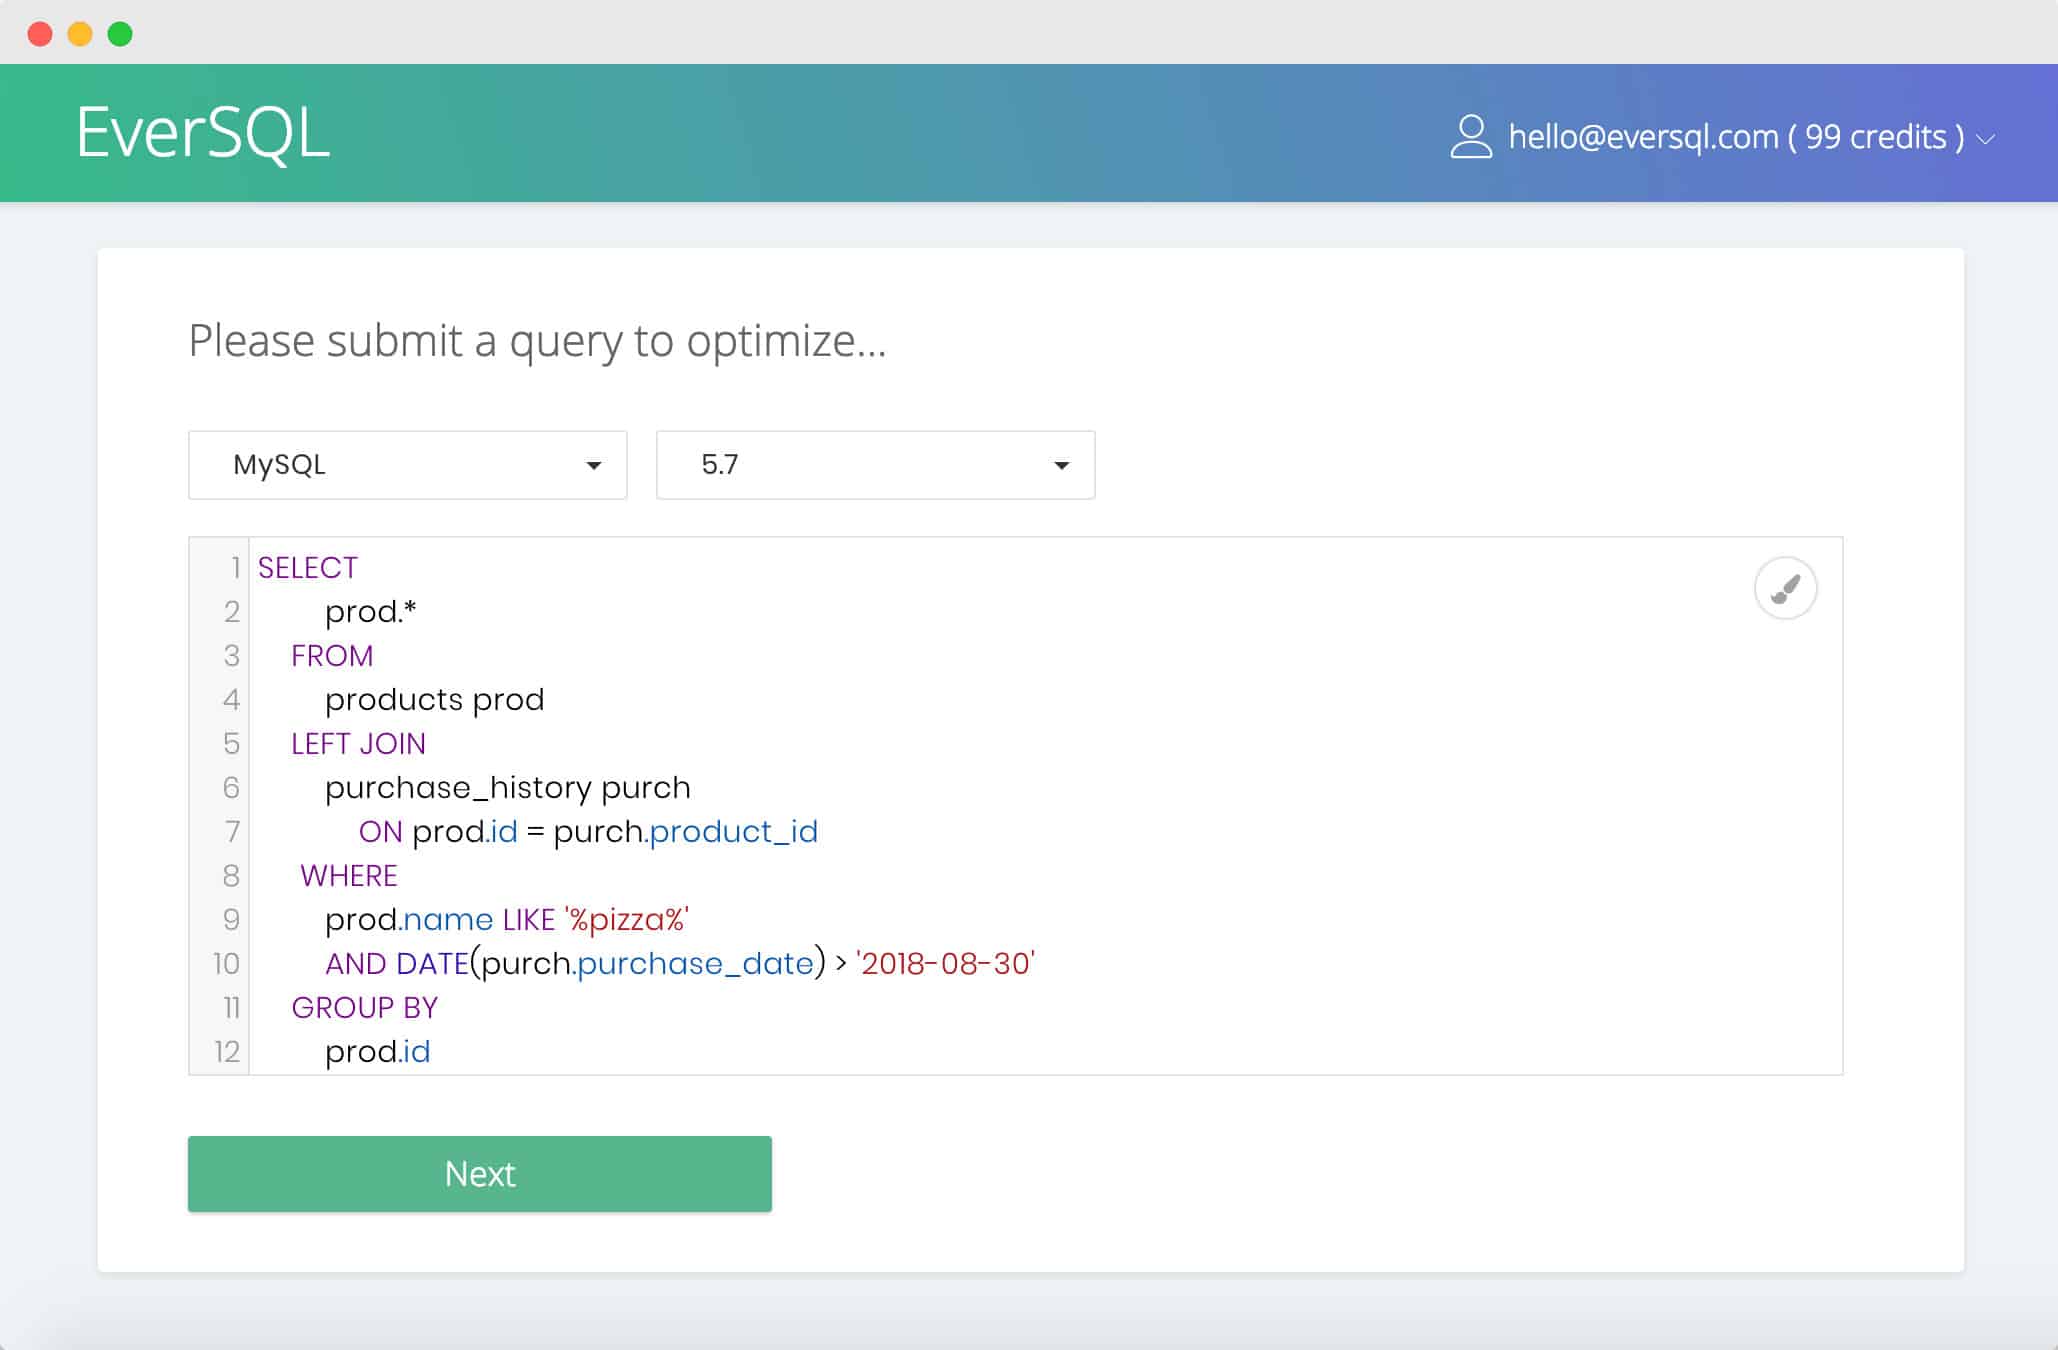
EverSQL is an SQL optimizer that is a popular choice for Structured Query Language tuning. The tool has a smart algorithm that automatically rewrites SQL queries to make them run faster. Once a query has been rewritten, you can view a code comparison with notes on all changes made to the query. These features combined make it convenient to increase the performance of queries without losing track of what changes have been made.
Key Features:
- Automated SQL Rewriting: Enhances query performance with smart algorithm-based optimizations.
- Indexing Guidance: Offers recommendations for effective database indexing strategies.
- User-Friendly Interface: Simplifies SQL optimization with an intuitive platform.
Why do we recommend it?
EverSQL is an SQL query optimizer. It is able to analyze database objects alongside query clauses to prevent problems or identify the causes of issues that have already arisen in live databases. The system is able to operate with a long list of DBMSs, including MySQL, MariaDB, Oracle, SQL Server, and PostgreSQL.
You can also use EverSQL to take indexing recommendations for multiple queries at the same time. Similarly, queries can be optimized directly from the MySQL slow log file. You can also add the schema to view advanced optimization options to further improve performance.
If you want to start optimizing and tuning queries through your web browser at a competitive price, EverSQL is highly recommended. EverSQL is compatible with MySQL, MariaDb, and PerconaDB database management systems (EverSQL may work with other database types with varying success).

Who is it recommended for?
The plans for EverSQL make it suitable for all sizes of businesses. It provides live database monitoring as well as query optimization. This is a very easy-to-use tool that will help small businesses that can’t afford a full-time DBA and it will also be a welcome tool for large organizations.
Pros:
- Query Performance Improvement: Automatically revises SQL queries for enhanced speed and efficiency.
- Detailed Change Explanations: Provides insights into each optimization, aiding in developer education.
- Broad Database Compatibility: Works with various DBMSs like MySQL and PostgreSQL, offering versatility.
Cons:
- Usage Limitation: The service stops if the monthly query analysis quota is exceeded, potentially disrupting workflow.
EverSQL Is available for free with 50 query optimizations for 14 days. The Basic version costs $29 (£21.87) a month for 25 queries and the Plus version $135 (£101) for 100 queries. There is also a Premium version which offers a custom number of credits but you need to contact the company directly. You can download the free trial version of EverSQL here.
7. dbForge Studio
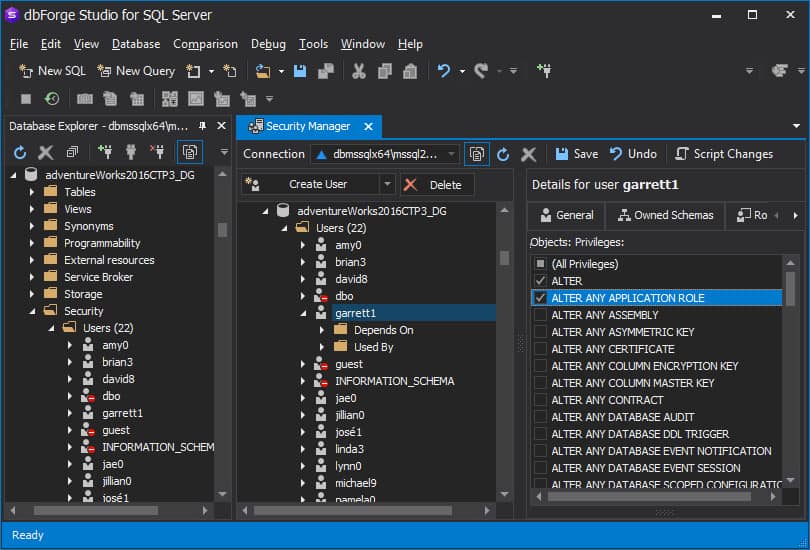
dbForge Studio is one of the top SQL query optimizers on this list. dbForge Studio comes with a range of server management tools to help monitor server performance and tune coding. This tool adds code completion, SQL formatting, SQL snippets, and code navigation to allow you to tune SQL code more easily.
Key Features:
- Data Transfer Assistance: Facilitates efficient data movement between servers.
- SQL Code Formatting: Enhances code readability and maintenance with well-structured SQL formatting.
- Index Management: Helps in identifying and resolving index fragmentation issues.
Why do we recommend it?
dbForge Studio is specifically intended for use with SQL Server databases but Devart also produces dbForge flavors for Oracle, MySQL, MariaDB, and PostgreSQL. This tool provides a development environment for queries and a table design assistant. The whole package provides stored expertise on how to create a database and manage data with SQL.
One tool that is particularly useful is the Index Manager which monitors SQL indexes and highlights index fragmentation issues. With the Index Manager, you can find databases that aren’t performing well. It functions well as a SQL performance monitor.
If you need to transfer data from server to server the Data Compare feature is vital. With Data Compare you can synchronize data from multiple tables, analyze the differences and generate reports. dbForge Studio is thus one of the best tools for data synchronization on this list.

There are three versions of dbForge Studio for purchase; the Standard, Professional and Enterprise Versions. The Standard version starts at $249.95 (£188.45) with basic code competition and a visual query builder.
Who is it recommended for?
This is a very good tool for businesses that might have developers on staff who don’t have too much experience. The system makes it very easy to design a new database, create applications with SQL, and test potential performance issues before taking this new work live.
Pros:
- Comprehensive SQL Query Builder: Assists in crafting and optimizing SQL queries with ease.
- Robust Analyzer and Tester: Provides tools for thorough SQL query analysis and performance testing.
- Flexible Versions for Different Needs: Offers Standard, Professional, and Enterprise versions to suit varied requirements.
Cons:
- DBMS-Specific Packages: Requires separate packages for each database type, which might complicate management and increase costs.
The Professional version costs $499.95 (£376.96) with advanced code completion and features like data compare and sync, plus a T-SQL code analyzer. The Enterprise version costs $699.95 (£527.76) and comes with Source Control and a T-SQL Unit Test. There is also a free trial version you can download here.
8. SolarWinds Database Performance Analyzer
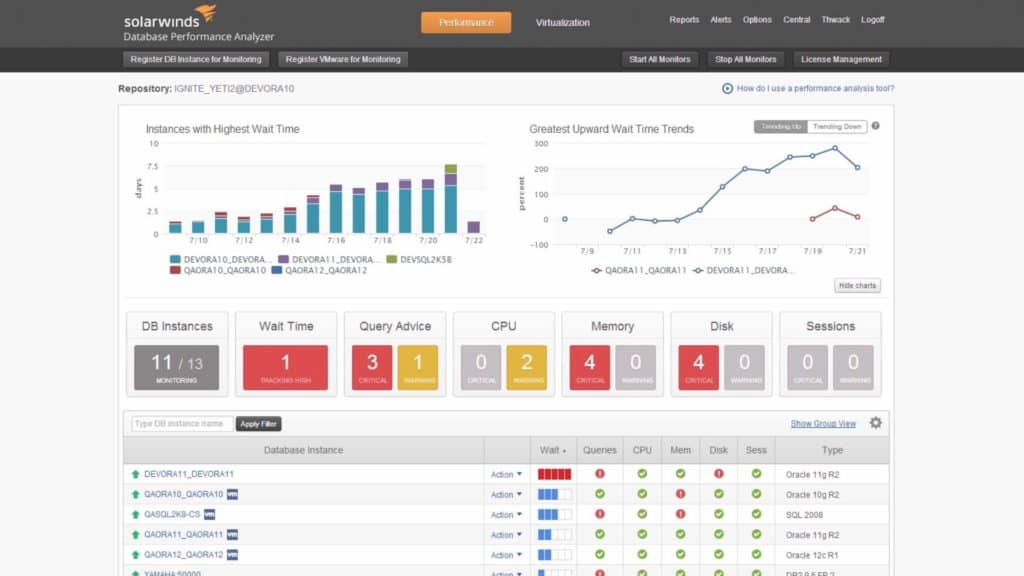
First up on this list we have SolarWinds Database Performance Analyzer. SolarWinds Database Performance Analyzer is a SQL query optimizer that was built for query performance monitoring and tuning. With this management tool, you can monitor the SQL server performance, Client Machines, Users and Applications through a dashboard. You can view graphs of all these entities to find any larger performance trends.
Key Features:
- Multi-Platform Monitoring: Tracks performance across both cloud and on-premises databases seamlessly.
- Advanced Query Analysis: Pinpoints inefficient queries with detailed insights for optimization.
- Real-Time Anomaly Detection: Identifies performance irregularities instantly, aiding in proactive management.
- Comprehensive Dashboard: Offers a unified view of database health, including CPU, memory, and disk usage.
- Application Dependency Mapping: Visualizes connections between applications and databases for better troubleshooting.
Why do we recommend it?
SolarWinds Database Performance Analyzer is an on-premises package that is able to track the activity of databases on-premises and on the cloud. It focuses on relational databases and provides database object analysis that is tuned by watching the queries that run on the database. This information helps the tool highlight reasons for long-running queries.
With SolarWinds Database Performance Analyzer, you can monitor databases 24/7 for performance anomalies. Views show data like Top Waits for SQL (Hours) which help to show the state of the network. If your network performance is declining SolarWinds Database Performance Analyzer gives you the heads-up you need to start troubleshooting for a solution.
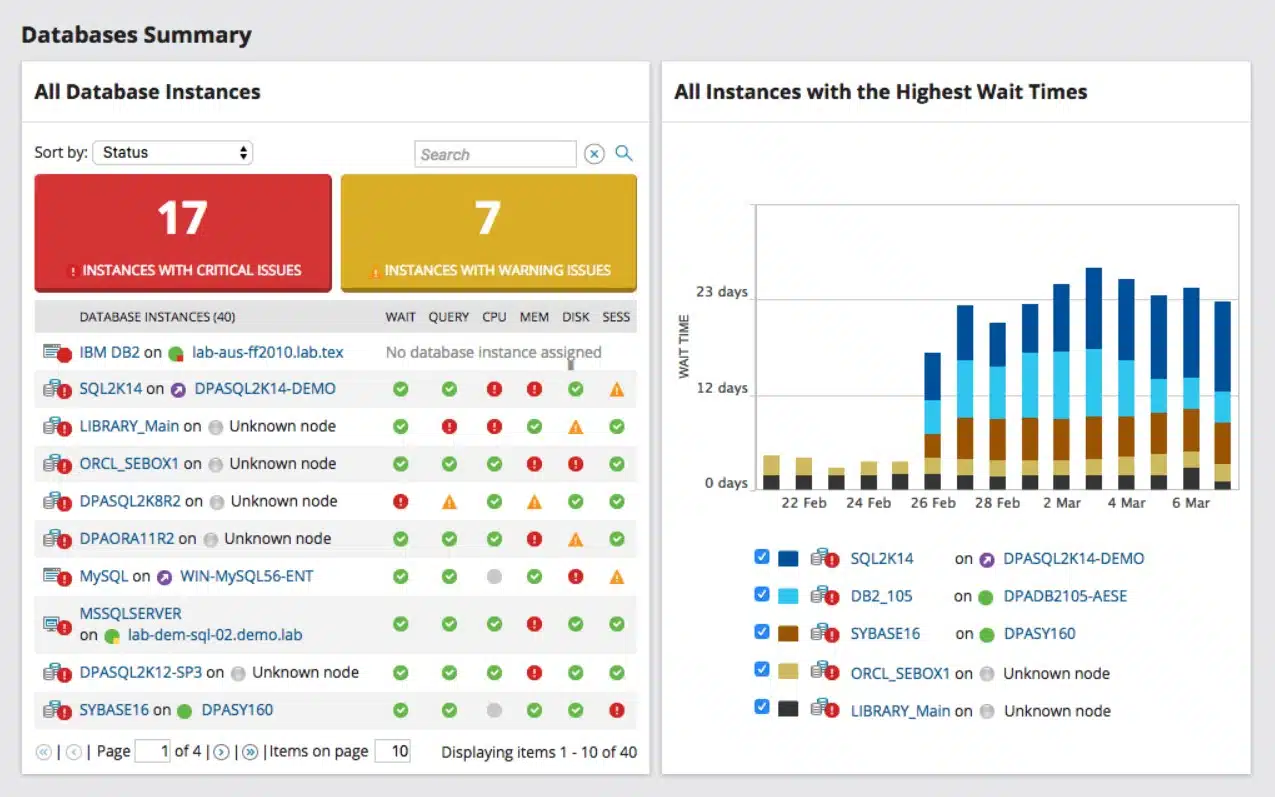
You can use SolarWinds Database Performance Analyzer to monitor the following database management systems: Azure SQL databases, MySQL, Aurora, ASE, Oracle, MariaDB, and IBM Db2. The status of your database is shown via an overview page that details Wait, Tuning, CPU, memory, and disk status. All of this information is color-coded so that you can see promptly if there is a problem that needs to be addressed.
Who is it recommended for?
This system is intended for use by DBAs and code developers. It is able to identify inefficient queries and recommend changes to database objects that would improve performance. It spots resource locks that can be preventing queries from running. The system lets DBAs profile new code before moving it to production.
Pros:
- Wide DBMS Support: Compatible with major database systems like MySQL, Oracle, and IBM Db2, providing versatile monitoring.
- In-Depth Resource Reporting: Live reports on database usage help in efficient resource allocation and troubleshooting.
- Effective Query Optimization: Offers guidance on SQL query improvements, enhancing overall database performance.
- Lock Identification: Quickly spots resource locks, aiding in smoother database operations.
Cons:
- Lacks SaaS Option: The absence of a Software as a Service version might limit accessibility for some users.
- Complex Setup: The initial configuration can be challenging for users without extensive database management experience.
SolarWinds Database Performance Analyzer is an excellent choice for buyers looking for a full-featured SQL query optimization tool that is compatible with other SolarWinds products. In our view, it’s one of the best SQL server monitoring and performance tools on the market. SolarWinds Database Performance Analyzer is available from a price of $2,045 (£1,541). There is also a 14-day free trial which you can download below.
9. Microsoft SQL Server Management Studio (SSMS)

SQL Server Management Studio is a widely-used query optimizer for Windows. On SQL Server Management Studio, monitoring the performance of queries is done through the Database Engine Tuning Advisor or DTA. The DTA is used to make queries run faster. It can add indexes and partition queries to eliminate performance bottlenecks and decrease run time.
Key Features:
- No-Cost Availability: Freely accessible tool, offering cost-effective SQL management.
- In-Depth SQL Analysis: Provides a thorough examination of SQL queries for optimization.
- Database Tuning Advisor: Guides database tuning efforts for improved performance.
Why do we recommend it?
Microsoft SQL Server Management Studio (SSMS) is the definitive tool for optimizing SQL Server and Azure SQL databases. This system provides an SQL query tester and a database creation guide. The system lets you watch over multiple instances in one console, which is useful for checking on differences between instances and replicating data from one to another.
SQL Server Management Studio is available for Windows10, 8, 8.1, 7, 2012, and 2008 R2. If you’re looking for an SQL tuning tool that is easy to use and doesn’t come with a substantial price tag with good data reporting, SQL Server Management Studio is worth considering.

Who is it recommended for?
This is a free tool that runs on Windows and Windows Server. Although you would think that Microsoft would produce the absolute best SQL query tuning and database analysis tool for SQL Server, it actually doesn’t compete well with dbForge Studio, Idera, or EverSQL. However, it offers competent advice and costs nothing.
Pros:
- Tailored for SQL Server: Specifically designed for SQL Server, ensuring optimized performance and compatibility.
- Comprehensive Indexing Advice: Offers valuable recommendations for database indexing.
- Versatile Instance Management: Enables monitoring of multiple instances in a unified console.
Cons:
- Limited to SQL Server: Exclusive focus on SQL Server, restricting its utility for other database systems.
- Less Competitive Features: May not offer the same level of functionality as some other specialized tools.
SQL Server Management Studio is a relational database tool that is ideal for smaller enterprises on account of its low cost. SQL Server Management is completely free and can be downloaded from the Microsoft website here.
SQL Query Optimization FAQ
Which software is best for SQL?
There is no “best” SQL software. Some programmers prefer to write SQL in a plain text editor, while others like SQL editors that highlight keywords and match up brackets; non-technical staff would benefit from SQL assemblers that suggest syntax and clauses.
Is SQL software free?
There are many free SQL optimizers and editors available and many of them are no use. Finding the right software for SQL creation and optimization is a personal journey.
What is SQL Query Analyzer?
There is no single product called SQL Query Analyzer, rather this is a type of utility that scans existing SQL code and suggests performance improvements. For example, the SolarWinds Data Performance Analyzer includes an SQL query analyzer.
How do I monitor SQL performance?
SQL query performance monitoring requires a number of different factors to be logged while the query is running. This is difficult to perform manually, so you really need to invest in monitoring software that supports that task.
What is the best free SQL database?
The best way to get SQL database software for free is to acquire it as part of a bundle of services, such as a database system that is included with a web hosting package. It is important to get an SQL database system that is widely used and is supported by extensive user training and online help advice.
Can I run an SQL query online?
There are many useful online services that enable you to run SQL online. Look for web schools that include SQL editors and then check out virtual server providers to get a managed RDMS online.
Choosing SQL Query Optimization Tools
If you need to monitor SQL queries as part of your day-to-day workload we highly recommend that you invest in a query optimization tool. Database management software allows you to keep a watchful eye over SQL query performance to make sure that your servers run efficiently.
For those organizations with lower budgets Microsoft SQL Server Management Studio can help you to visualize SQL server performance. Though it isn’t as advanced as some of the other SQL server management tools on this list. However, it provides a solid user experience.
