
Maintaining strong network performance requires the right monitoring tools, especially as infrastructures become more complex. Datadog and SmokePing are two widely used options, each offering different approaches to tracking and analysing network health.
Datadog is a cloud-based platform built for modern environments, delivering full-stack observability across infrastructure, applications, and services. It provides detailed metrics, real-time analytics, custom dashboards, and advanced alerting, making it well suited to organisations running cloud, microservices, or distributed systems.
SmokePing, by contrast, is a focused, open-source tool designed specifically for monitoring latency and packet loss. Using ping-based measurements, it tracks round-trip times and visualises performance over time, helping administrators identify instability or connectivity issues. Its simplicity and lightweight nature make it ideal for teams that need clear, long-term visibility into network reliability without the complexity of broader monitoring platforms.
This comparison explores how each tool performs across key areas, helping you decide which option best fits your monitoring requirements.
Overview of Datadog
Datadog is an agent-based on-prem and cloud infrastructure monitoring service for cloud applications, servers, databases, tools, and services. Datadog Network Performance Monitoring for example provides full visibility into every network component that makes up your on-prem, cloud, and hybrid environments, including monitoring the performance of connections among your hosts, services, Virtual Private Clouds (VPCs), and other elements. It provides IT operations teams real-time visibility into all technology infrastructure through a single visual interface. Datadog uses its auto-discovery service to explore and identify devices in your network. The outcome of the auto-discovery service is then used to create a device inventory, which forms an index for the complete monitoring service.
Once all devices and links have been identified, you can overview all network activity from the Datadog dashboard. The service also draws up a network topology map that can be used to get quick insights into each node. Any changes to the network can be automatically spotted. This helps to adjust the network inventory and topology map without any human intervention. Traffic flow analysis features in the Datadog tool enable you to examine each device and link to discover total capacity and utilization. The analysis features let you see which applications or endpoints generate the most traffic on your network.
Datadog’s key features include:
- Network monitoring Allows companies to visualize traffic flow in cloud-native environments and analyze performance using meaningful, easy-to-understand tags.
- Application performance management Monitors, troubleshoots, and optimizes application performance.
- Log management Allows users to search, filter quickly, and analyze logs for troubleshooting and data analysis.
- Synthetics Synthetic tests proactively monitor end-to-end user experience with an intuitive web recorder.
- Alerts Companies can create custom alerts for any metric or performance problem. Notifications are available via email, PagerDuty, Slack, etc.
- Integrations The software integrates with multiple products and development stacks to aggregate metrics and events.
- Dashboards High-resolution interactive dashboards help companies monitor and graph real-time metrics and events.
- Collaboration Collaboration tools provide visibility across teams by letting users annotate changes, record problems, and communication, and discuss issues in context with production data.
- Application programming interface (API) API access helps companies observe apps and infrastructure by capturing events and metrics using client libraries.
A free 14-day trial with full access to all the features is available for download. After that, the software is generally sold through monthly subscription plans based on hosts, events, or logs.
Overview of SmokePing
SmokePing is a free and open-source network diagnostic tool that offers a graphical interpretation of several Ping runs that give information about the quality of a network connection. It can measure, store and display latency, latency distribution, and packet loss, and also has alarm features that can be configured to provide real-time notifications, as well as historical data. This method of testing is very important for examining the availability and response times of websites and applications. This enables network admins to understand their network, monitor performance, troubleshoot problems, and measure anomalies and improvements.
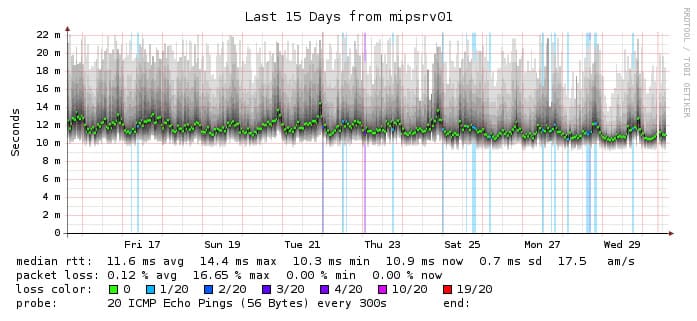
Smokeping consists of two parts: The first is a daemon that runs in the background pinging and collecting data at set intervals. The second is a web interface that displays that data in the form of graphs. SmokePing works by sending out test packets to the network and measures the latency—the amount of time they need to travel from one place to the other and back. It has an option to test a destination from five different locations. For every round of measurement, SmokePing sends several packets. The different round trip times are then sorted out to select the value or quantity lying at the midpoint (median). The other values are indicated as successively lighter shades of gray in the background which it calls smoke.
When a test packet that is sent out does not return, it means the packet is lost. This is indicated by the change in the color of the median line according to the number of packets lost. When reliable delivery is necessary, packet loss increases latency due to additional time needed for retransmission. SmokePing uses a tool called RRDtool to maintain a long-term data store and to generate statistical charts based on RRDtool’s output, with up-to-the-minute information on the state of the network connection. A variation in the delay of the received packet indicates network jitter. Heavy fluctuation of the round trip time values means that the network is overloaded. This shows on the graph as smoke; the more smoke, the more fluctuation.
SmokePing is not supported on Windows machines. It is delivered as a TAR file, which installs on Unix and Unix-like operating systems such as Linux and macOS. The software is freely available for download. An online demo is also available.
Datadog vs SmokePing: How They Compare
Installation and Configuration
Since Datadog is a SaaS-based application, there are no on-premise system requirements and no installation hassles. However, you’ll be required to install local agents specific to the device or service you wish to monitor for the most part. An agent-based mode means no auto-discovery feature, so you have to deploy an agent for all your devices individually. Datadog supports integration with VMware vSphere, but the setup process is a bit complicated. That said, Datagod provides enough documentation and setup instructions to guide you through the installation and configuration process.
You can install SmokePing on virtually any Linux or UNIX-like operating system that has the Apache Web server, RRDtool, Perl, and a host of other tools running on it. Installation is via the SmokePing package which consists of two parts:
- The SmokePing daemon and configs This daemon performs the monitoring.
- The SmokePing “htdocs” These will be used by the web interface.
Smokeping is easy to install but harder to configure. It takes only a few minutes for an experienced Linux user to install SmokePing. However, if you are not familiar with Linux OS, you will struggle with the installation and configuration process, and for that, you will need some assistance or guidance. Smokeping can be deployed as a distributed model, but if you intend to manage enterprise-sized networks and cloud infrastructure with multiple locations, you will find Datadog and other Smokeping alternatives more appealing.
Dashboards and Visualizations
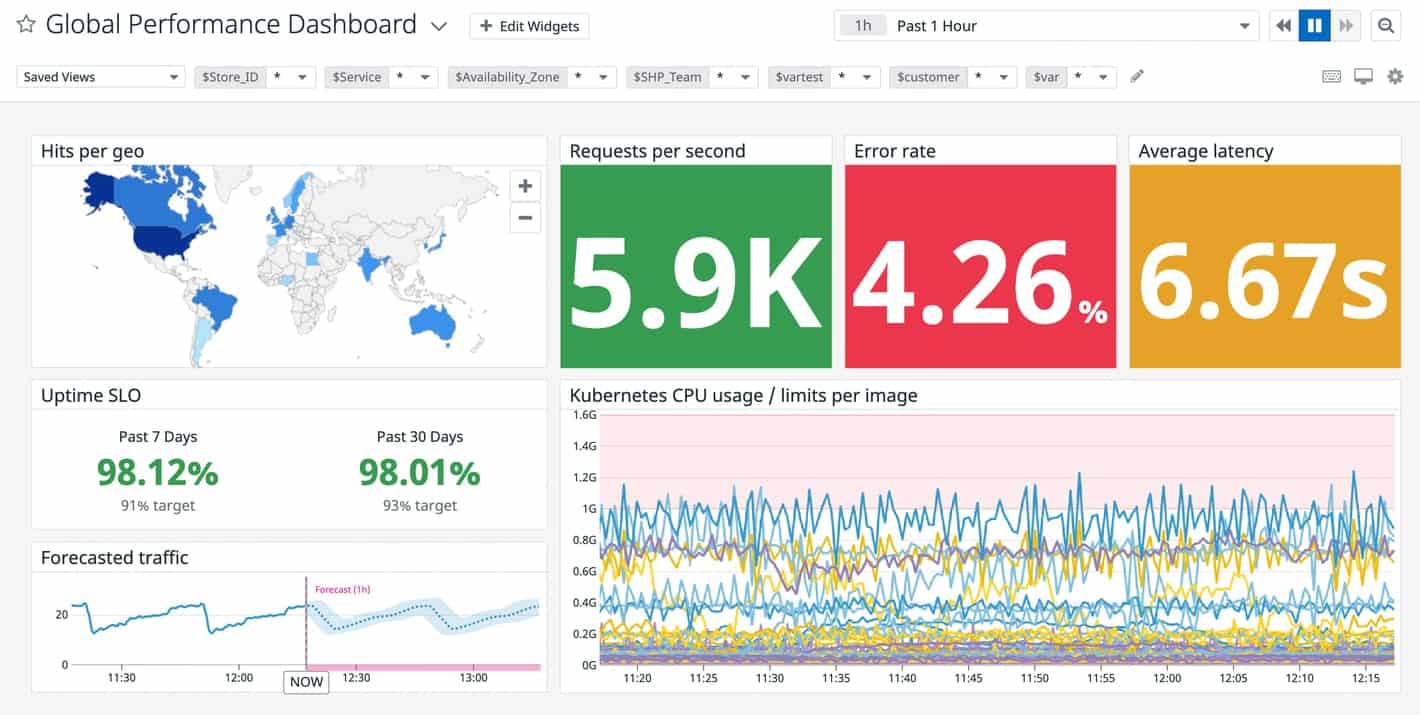
Datadog performs relatively better from a visual perspective with its clean and modern dashboard design. In addition, Datadog allows you to customize your dashboards with a vast library of visualization tools and drag-and-drop widgets. But it requires a lot of setup work to get things working. Once set up, there are two primary ways of visualizing your data:
- Screenboards These are grid-based dashboards with free-form layouts that include images, tables, host maps, graphs, and logs. They are commonly used as status boards or storytelling views that update in real-time or represent fixed points in the past.
- Timeboards This represents a single point in time—fixed or real-time—across the entire dashboard. They are commonly used for troubleshooting, correlation, and general data exploration. In addition, you also get a time series that can plot any metric being captured from your hosts, such as CPU usage, uptime, or memory usage.
SmokePing enables you to visualize information on a web interface that displays data in the form of graphs. SmokePing uses RRDtool to store data and generate aesthetically pleasing latency visualization and interactive frontend charts or graphs. If you click on the graph you can zoom interactively in the navigator mode. The line color of the graph depicts the number of lost packets and the dark area around the line shows the amount of variation between individual probes. SmokePing uses the concept of smoke which are lighter and darker shades of gray in the graph area to convey the idea of variable round trip times (RTT) or jitter. It’s a great way of visualizing the amount of variation for the various test packets.
Alerts and Notifications
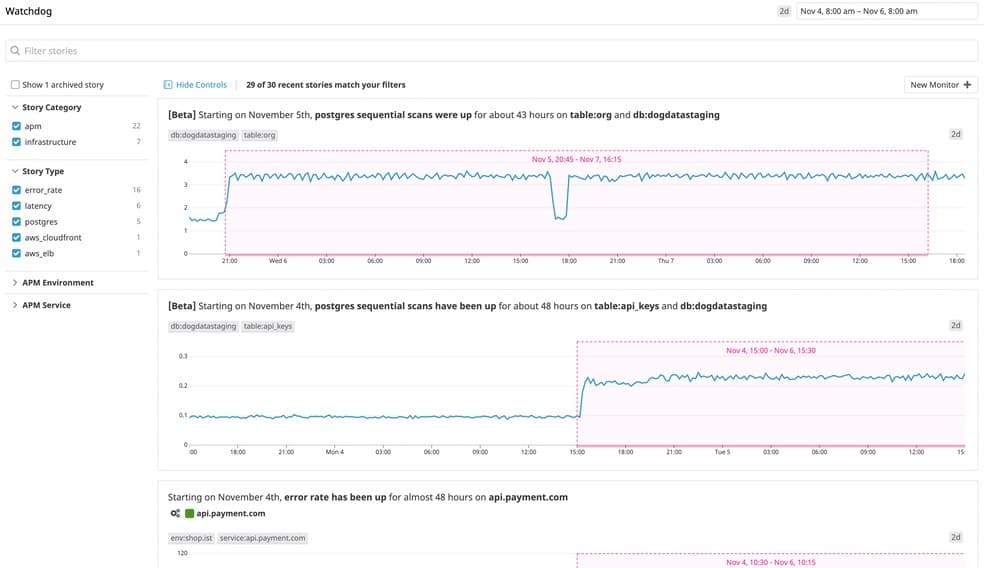
Datadog’s approach to alerts and notifications is based on machine learning (ML), which it calls Watchdog. Watchdog uses ML techniques to identify problems in your infrastructure, applications efficiently, and services and flag anomalies. Alerts in Datadog are called Monitors. Users can receive signals using Pagerduty, Slack, and email. These can be based on nearly any metric that Datadog can capture. As a result, every alert is specific, actionable, and contextual—even in large-scale and highly ephemeral environments—which helps minimize downtime and prevents alert fatigue.
One great feature of smokePing is its ability to let you write your own alert rules and then have SmokePing email when a rule is fired. By default, SmokePing sends an email alert using sendmail. But you can also directly call an external program or a ticketing system to send or automate an alert. The alert settings are a bit complex but easy to use. The alerting channels may not be as rich as Datadog’s, but for a free tool, this is just enough to meet your alerts and notifications needs.
Reporting and Integration
The Datadog approach to reporting aims to make metrics easily searchable, and it does excellently. Although some network managers prefer the good old out-of-box fixed PDF report, not everybody needs it. Therefore, Datadog also comes equipped with an easy-to-use API that can significantly extend the range of what Datadog can track. The Datadog API is an HTTP REST API that can access the Datadog platform programmatically and returns JSON from all requests.
Unlike Datadog, SmokePing does not have any reporting feature, and it is not able to produce in-depth error reports. This means that SmokePing is not a tool to rely on to meet your compliance requirements unless you’re okay with the graphs generated. SmokePing provides a wide range of latency measurement plugins called Probes for protocols such as LDAP, Radius, SSH, SendEmail, DNS queries, and others that can integrate an external ping command into SmokePing. Other network monitoring tools such as Observium, LibreNMS, and Cacti also implement plugins that enable them to integrate with SmokePing.
Licensing and Price Plans
Datadog pricing model is based on per server, per month, and it’s free for up to 5 hosts (with 1-day data retention). But some customers complain that it becomes costly at scale. As a result, Datadog is available in several different pricing tiers:
- The Network Performance tier Suitable for monitoring networks and systems for most small to midsize businesses.
- The Infrastructure tier Ideal for organizations that want to use the software as a centralized monitoring service for systems and services.
- The APM tier Designed for larger organizations looking to fix service and device-layer problems.
- Serverless tier Aimed at those looking to monitor network and application issues.
- Log Management tier Meant for companies with large amounts of log data to parse for context and retention.
- There are also different tiers for security, synthetic, and accurate user monitoring, each appropriate pricing for the core task.
All Datadog prices are billed annually, making it one of the most price-customizable management apps.
SmokePing is free and open-source software; which means that there are no licensing costs. You are free to use, modify, and/or redistribute it under the terms of the GNU General Public License as published by the Free Software Foundation. Just like most free software, support is not available. But you can subscribe to the mailing list and post questions there.
| Features | SmokePing | Datadog |
|---|---|---|
| Target market | Ideal for small and medium-sized networks and ISPs that want a tool for diagnosing network performance issues. | Ideal for developers, freelancers, IT operations teams, security engineers, and business users from SMB to large organizations in the cloud age. |
| Supported platform | Linux and macOS | Windows, Linux, Mac, Cloud |
| Deployment model | On-premises | SaaS-based |
| APIs calls | None | HTTP REST API |
| Support methods | Mailing list | Phone Online Knowledge base Video tutorials |
| Licensing and pricing model | Free and open source | Free trial available No credit card required Free account Subscription-based |
Table 1.0 | Comparison of SmokePing and Datadog key features
Conclusion
Datadog is a powerful feature-rich observability and network performance monitoring solution that can meet the needs of any organization, from SMB to large enterprises. Most users find it easy to use and administer. While the feature set may seem overwhelming, nonetheless, network managers will find it hard to run out of options. More extensive networks with multiple remote locations may find Datadog’s agent-based model inconvenient since agents will need to be individually installed. But if you can successfully get past the agent installation and configuration process, Datadog is an excellent network monitoring and infrastructure management tool.
SmokePing is a powerful network monitoring and diagnostic tool for experienced network managers as long as they can navigate the tedious configuration process. It is particularly useful in simulating customer experience. SmokePing’s main competitive advantage is the fact that it is open source, and can produce latency trend data. This is incredibly valuable data for a network administrator, especially when collected over a long period. If simplicity and minimal disk and CPU footprint are what you’re after in a network monitoring tool, then SmokePing is your ideal solution.
