When it comes to optimizing network performance, understanding key metrics such as jitter and latency is crucial. Both play significant roles in the overall quality of a network connection, but they measure different aspects of performance. While latency refers to the time it takes for data to travel from one point to another, jitter measures the variability or inconsistency in that latency over time. Together, they have a significant impact on real-time communication services such as VoIP (Voice over Internet Protocol), online gaming, video conferencing, and other applications requiring low-latency, high-quality connections.
Latency is often described as the “delay” or “lag” in a network. It’s the time it takes for a data packet to travel from its source to its destination and is typically measured in milliseconds (ms). High latency can lead to noticeable delays in communication, such as voice calls or video streaming, which can cause frustration for users. Low latency is generally desirable, especially for time-sensitive applications.
On the other hand, jitter refers to the fluctuation or variation in latency. Even if the average latency is low, high jitter can cause packets to arrive out of order, resulting in poor audio or video quality. For instance, in a video call, jitter may cause audio to lag behind video or lead to skipped frames, disrupting the user experience. Reducing jitter is just as important as minimizing latency for ensuring smooth and stable real-time communications.
Understanding these concepts will help network administrators optimize performance and deliver a better experience for users, whether for gaming, VoIP, or business communications.
Here is our list of the best Jitter and Latency software:
- PRTG Network Monitor EDITOR’S CHOICE A monitoring solution that offers pre-configured VoIP sensors that help track jitter, latency, packet loss, round-trip time, and IP SLA. Start a 30-day free trial.
- Site24x7 VoIP Monitoring (FREE TRIAL) This cloud-based system examines the quality of service on connections within a network to ensure regular and speedy packet delivery. Get a 30-day free trial.
- SolarWinds VoIP & Network Quality Manager A network management solution that measures jitter levels and provides in-depth insights into VoIP call quality and performance. You can even analyze all the Call Detail Records.
- Multiprotocol Network Tester – The open-source tool is great for tracking IP packet delays and root causes for jitter and latency.
The optimal network configuration
The efficiency of a network is gauged by its capability to transport data packets within five parameters of efficiency:
- Time – shortest time possible
- Delivery – no dropping or loss of packets
- Security – delivery of non-tampered packets
- Scalability – a network’s capabilities to keep up with growth
- Reach – its ability to cover all the devices it is intended to, regardless of its location
If there are two things that could negatively affect all these parameters they would be jitter and latency.
What are jitter and latency?
The simplest explanation of jitter would be delays in the average time difference between sequences of data packets.
Jitter, in more detail, is the variation in the delay times of data packets being received. If we were to consider an ideal networking environment, the packets are sent at an evenly-spaced interval. They then traverse the network and reach their destination intact, in the right sequence, and in the same even-paced intervals.
But, when the network has issues like congestion, misconfiguration, or erroneous queuing, this steady interval is put out of sync resulting in unsteady packet transmissions that make them arrive in irregular bursts. The average delay time between these packets’ arrivals is known as “jitter”.
When the sequence of packets is transmitted at a regular interval, the average time will remain constant meaning there is less jitter. But, when the time keeps spiking and dropping it will create a disruption in the smooth flow of data and information causing network jitter.
Jitter can also be defined as “the differentiation within the latency (or delay) between each data packet“. The jitter of more than 20 ms will cause delays in packet arrivals which, in turn, will result in delays in your audio or video communications.
Now, on the other hand, and in layman’s terms, latency is the time it takes a data packet to reach its intended host or device. This time is measured by the “echo” that is sent back from the destination – or any bridging devices in between – confirming that the packet has indeed made it through and that the host device is ready for the next batch of packets.
This back-and-forth communication is critical in a TCP/IP networking environment where origin devices always wait for acknowledgments before they send the subsequent data packets.
Each “hop” a packet makes as it traverses through a network adds to this latency. If the latency is higher than 150 ms it causes unnatural pauses in audio or video communications. In a video call, high latency creates a disparity between the audio and the video. If this latency continues to rise it could eventually result in long periods of no audio or video – until the call is totally dropped.
According to Cisco, the standards to adhere to for an optimal network performance are:
- Maximum One-Way (“mouth-to-ear”) Delay: 150ms
- Maximum Round Trip Delay: 300ms
- Maximum Jitter: 30ms
As we can see, both these issues are inter-related – meaning, one can cause the other: jittery packets can cause delays, aka latency, in the delivery times as they clog up buffers along the way.
On the other hand the late delivery of packets between networking devices, or “latency,” can hold up the transmission of packets from their buffer queues which could result in jitter.
And this all leads us to the conclusion that the ideal solution for a “smooth” network would be to get rid of – or, at the very least, minimize – both jitter and latency.
Related post: What is Network Jitter?
Causes of jitter and latency
Before we can even consider tackling jitter and latency, we will need to know what causes them. Here are a few of the reasons:
- Legacy or under-performing hardware – perhaps your routers and switches are simply broken or incompatible with your networking environment or the tasks they are expected to perform
- Interference from objects – walls can degrade your WIFI signal, even passing cars or airplanes flying too close can send out EMF that can interfere with your broadcasts; don’t forget even the weather can become an obstacle on cloudy days
- Distance between devices – the distance between a device from a WIFI router, or the distance a router is from the next connecting device, determines the performance speed and latency of the packets that will be using the network connection; the greater the distance, the higher the chance for jitter and latency
- Misconfiguration – badly configured software and hardware can cause data packet collisions or broadcasts within a subnet that will, in turn, slow communication down
- Abysmal Internet connection – if your business has a poor connection to the Internet, or you have simply not invested in the required amount of bandwidth, then no matter what you do, you will still experience jitter and latency; your bandwidth should comfortably accommodate your business’ connectivity requirements
In order to stop or reduce jitter and latency, we need to focus on the monitoring of networks, optimization of hardware assets, and proactively ensure that configuration of software solutions is correct at all times.
How do you measure jitter and latency?
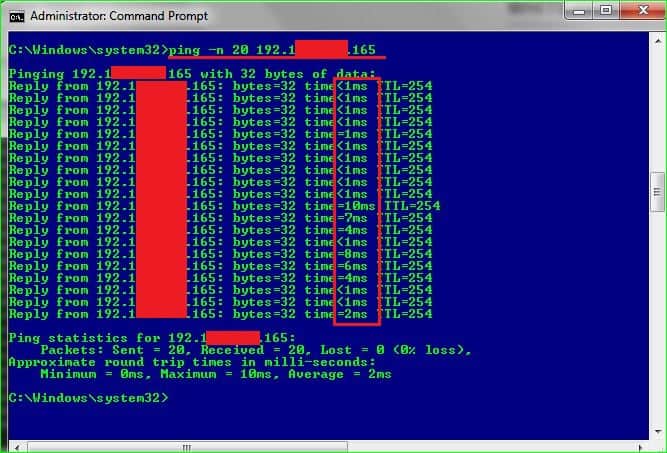
The easiest way to measure jitter is by PING-ing a remote device with a number of packets – say 20 to 50 – and then calculating the average time difference between each reply packet sequence.
For example, if we were to ping 192.1xx.xxx.240 (this is a sample remote device’s IP address) with 20 packets, the command would be “ping –n 20 192.1xx.xxx.240”.
Your results would look something like this:
Once done, we can copy the times into a spreadsheet and calculate the average of the difference between the times by calculating the absolute value of the difference between the milliseconds from the one before it:
t0
.
.
.
| (tx+1 – tx) | (where x = row number of pings)
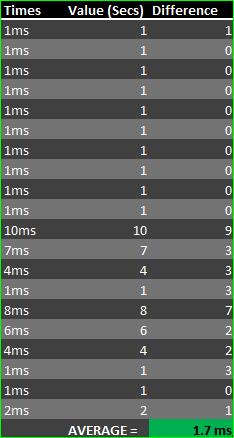
In our example above, the jitter is just 1.7ms – a very small amount, we are proud to say. Of course, this test needs to be done on a regular basis to see if there are any variables that could cause it to rise. Good examples would be traffic during office peak hours or IT package rollout campaigns. Also, one part of the network might not perform as well as another, so testing over subnets would also be required especially in larger enterprise networks.
Note: some hops could return an asterisk (“*”) or two – this is OK if the final destination is reached. The targeted device could have simply ignored the ping request due to security or prioritization for Quality of Service (QoS) reasons. But, if the asterisks continue until the number of pings has been iterated through it means the host could not be reached.
Next, we can use the TRACERT or TRACEROUTE (depending on your operating system) to measure the time it takes for a packet to reach its destination. If there are any delays, it can be assumed that there is latency on the network.
But, before we can see how to use TRACERT we will need to see how it works.
Once the command has been run it sends out packets and waits for a reply from each network connectivity device – usually a router or switch but also from ISP and major network service providers – along the way until it reaches the destination host.
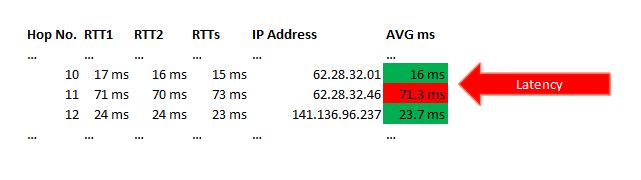
TRACERT sends out three packets to each of these devices in a series of hops and registers the Round Trip Time (RTT). This helps measure the time it took each packet to get to and from the devices. And it is these sets of three packets that we use to measure the RTT’s average times to find out if there is any latency on a network connection.
Once we have the RTT table for the whole route, we can take the average of each hop. If there is a relatively large difference between two or more, hops it is an indication of latency in the communication between the two devices.
Some diagnosis examples that you can use to understand what your network is telling you under different scenarios (Sx) include:
S1= High RTTs at the beginning of the hops indicate that there are issues within the LAN
S2= High RTTs at, and towards, the end indicate that there are connectivity issues in, or close to, the destination host
S3= High RTTs in the middle of the hops which continue to remain high until the end is simply an indication of a slow network – and should be tackled accordingly
S4= An asterisk (“*”) doesn’t necessarily mean that the device is offline; it could simply mean that it is busy processing other requests with higher priority, has been configured to ignore TRACERT requests or your IP address has been blocked – which should also be handled accordingly
As we have seen, these two tools alone can give you rich feedback about your network’s current jitter and latency situation.
How bad are the effects that jitter and latency have on a network?
There are many effects that jitter and latency have on a network, and hence a business’ performance. Here are some examples:
Bad communication
Networks with latency and jitter can be a real hindrance to a business’ communications performance. This is especially true in cases where the data packets being transported need to arrive intact for the transmitted information to make any sense at all.
The case in hand is VoIP. There is nothing more annoying than laggy voice calls and overlapping conversations. In the worst-case scenario, the conversation becomes totally intelligible and could even end with a dropped call.
This is usually caused by jitter which sends packets out-of-order.
Timeouts
Some applications poll a connection or destination host for a limited amount of time before dropping the connection and alerting that there is a “timeout”.
If these timeouts occur when mission-critical applications try to connect to a server, for example, it could spell financial disaster for businesses that rely on their clients’ online transactions.
Network bottlenecks
We have seen that jitter can cause latency and vice versa.
Packets that are being transmitted at irregular intervals create jitter due to the buffers in the connectivity hardware filling up while waiting for the whole data to arrive. This slows the traffic down for packets that don’t even need buffering and causes overall delay, i.e. latency.
Let us now move on to ways to tackle jitter and latency.
More methods and tools to prevent jitter and latency
One of the best pieces of advice anyone could give you about reducing latency, and especially jitter, on a network would be: “Prioritize the traffic on your network”.
We are, of course, talking about implementing QoS on your network. This would ensure high-priority packets – like your VoIP data – get assigned or tagged with higher transmission privileges. This allows these packets to get transmitted, and thus delivered, first.
There are also tools to keep track, troubleshoot, and resolve jitter and/or latency issues. We have seen:
- PING – this is the good old-fashioned way of testing how long it takes for a packet to reach its destination; this is hence the most basic (and simple) tool to test for latency
- TRACERT or TRACEROUTE – here we have another oldie that has always been to track the path packets would need to take to reach their destination; this makes it the best (and simplest) choice for testing for causes of jitter
But, as effective as these two tools are, it wouldn’t make sense to rely on just the two when running a wide network with lots of assets on it – it would be a tedious task.
And so, let us have a look at tools and solutions that can automate your administrative task when it comes to fighting jitter and latency.
Jitter buffers
In a VoIP network, a jitter buffer is temporary packet storage and buffer which sits between endpoints. It receives packets and holds them for a set amount of time before letting them go on to their destination in their correct sequences and at evenly-spaced intervals.
There are two types of jitter buffers:
- Static jitter buffers – These are buffers that are hardware devices that come configured by their manufacturers.
- Dynamic jitter buffers – Here we have jitter buffers that are implemented within the software of the network system and are configured by administrators who can mold them to fit their custom needs.
Download managers
Latency can be caused by applications and systems hogging bandwidth. On networks that have many of these types of applications, it is necessary to make sure that they all share the bandwidth fairly or, at least, use it during non-peak hours.
One way to do this is to install download managers such as Download Accelerator, DownThemAll, or GetRight. With these solutions in play, the network bandwidth is shared among downloads and the tools also find mirror sites for faster, efficient downloads.
Note: before you choose a download manager, make sure it is secure and that it meets your network’s specific requirements in terms of, for example, the operating systems or browsers it is compatible with.
Use fewer hops
At every possible chance, a network should be configured to bridge origin and destination hosts using the shortest possible routes. This can result in cutting out unnecessary hops and, hence, reducing latency. Administrators can achieve this with the minimization of the number of gateways that are within their networks.
Software solutions for Jitter & Latency
Finally, let’s have a look at some off-the-shelf network monitoring solutions that can allow administrators to have greater insights into, and control of, their network domains:
Our methodology for choosing the best Jitter and Latency software
We observed several Jitter and Latency software and selected the best one for you based on the following criteria:
- Comes with a service that sends alerts on identifying delays and jitter
- Monitors availability, VoIP quality, and network jitter
- Ability to track irregular transmissions and network traffic
- A system that supports SLA monitoring
1. PRTG Network Monitor (FREE TRIAL)
This network monitoring solution from Paessler is one of the leading tools on the market. PRTG Network Monitor lets administrators take control of their network from end-to-end and across the whole infrastructure. It is an easy tool to use and its jitter and latency monitoring features will certainly help get rid of these two particular issues.

This is a monitoring solution for larger networks which is, usually, where the issues of jitter and latency are more prominent and troubling.
Key Features:
- IP SLA tracking
- Continuous Ping
- QoS metrics
- SNMP-based mapping
Once installed the tool starts monitoring for jitter and can run tests to find any problems with VoIP traffic or QoS configurations. And should there be any issues, it sends out alerts for prompt action.
PRTG’s QoS sensor and its Advanced PING sensor also help to monitor latency. It regularly polls and simultaneously monitors servers, routers, and switches to make sure they are up and running, to begin with, and then checks for any latency in their communication.
Why do we recommend it?
PRTG Network Monitor provides full control and end-to-end visibility into the entire network infrastructure. Users can personalize their dashboards, automatically track the VoIP calls, and get notified of experiencing poor voice quality.
Who is it recommended for?
Businesses of all sizes can purchase the feature-rich platform and choose monitoring services as per their requirement and budget. In simple terms, you’ll have to pay only for the number of sensors you are planning to activate.
Pros:
- Utilizes SNMP, NetFlow, and other a variety of other protocols to create the most accurate picture of network and VoIP traffic
- Comes with pre-configured VoIP sensors
- The dashboard is customizable through a series of widgets and feels intuitive out of the box
- Supports a completely free version for up to 100 sensors, making this a good choice for both small and large networks
- Pricing is based on sensor utilization, making this a flexible and scalable solution for larger networks as well as budget-conscious organizations
Cons:
- PRTG is a feature-rich platform that requires time to fully learn all of the features and options available
Try the unlimited version of PRTG Network Monitor on a free trial for 30 days.
EDITOR'S CHOICE
PRTG Network Monitoring is our recommended tool for tracking jitter and latency, offering an all-in-one platform with clear visibility into key performance metrics. These metrics are essential for maintaining stable communication and consistent performance, especially for real-time services like VoIP, video conferencing, and online gaming. PRTG helps IT teams monitor these metrics closely, reducing disruptions and identifying issues before they affect end users. A key strength of PRTG is its flexible monitoring approach, supporting a wide range of sensors to track jitter and latency across devices and services. Using built-in sensors such as Ping, HTTP, and SNMP, it measures round-trip time, packet loss, and latency, providing real-time insights into network conditions. Configurable alerts notify teams when thresholds are exceeded, enabling quick action and helping identify potential causes such as device or infrastructure faults. Its user-friendly dashboard presents data through clear visualizations, making it easy to spot trends and network bottlenecks, while historical analysis helps detect recurring patterns. With a scalable architecture, PRTG is suitable for monitoring both small and large networks.
Download: Get a 30-day FREE Trial
Official Site: https://www.paessler.com/download/prtg-download?download=1
OS: Windows Server and SaaS
2. Site24x7 VoIP Monitoring (FREE TRIAL)
Site24x7 provides IT system monitoring and management tools on its cloud platform and its VoIP Monitoring service is part of its Network Monitoring system. The tool produces quality of service statistics by examining traffic flows through switches. Those metrics include jitter and latency.
The package produces many more connection quality of service statistics, which can result in a crowded dashboard screen. However, that screen is customizable, so you can reorganize it to show only the measurements that matter to you.
Key Features:
- Positive and negative jitter
- Latency
- Packet loss
Why do we recommend it?
Site24x7 VoIP Monitoring is able to track Quality of Service while simultaneously monitoring all network devices for faults and assessing traffic flows for surges, bottlenecks, and dips. So, you don’t just get a VoIP monitor with the Site24x7 service but you get a complete network monitoring system.
This system operates live, so you can see the connection quality of your network links minute by minute. There is a mobile app available to enable technicians to take a look at the dashboard even when they are on site and away from their desks. This app is available for Android and iOS.
If any of the QoS metrics tracked by the Site24x7 system dip below or rise above an acceptable range, the service raises an alert. The alerts of the VoIP monitor appear in the dashboard. However, you can also set up the platform to forward alerts as notifications by voice call, SMS, email, or push notification.
Who do we recommend it for?
This system is part of a full-stack observability package that includes network, server, and application monitoring. The tool will simultaneously track the performance of all IT assets on your site. It can also monitor cloud systems and websites. Plans are sized to be affordable for small businesses but capacity expansions also make the plans suitable for larger organizations.
Pros:
- Quality of Service metrics
- Mobile app for roaming technicians
- Alerts for poor performance
Cons:
- No on-premises version
The Site24x7 platform is available in a range of plans that include all of its modules. One of the plans is designed for use by managed service providers. You can assess the Site24x7 system with a 30-day free trial.
3. SolarWinds VoIP & Network Quality Manager

The VoIP & Network Quality Manager is a product that comes to us from SolarWinds, one of the biggest network management solutions makers today.
Key Features:
- Specialized in voice traffic
- Current and maximum jitter
- Network map
- WAN monitoring
- IP SLA tracking
While the whole suite offers a robust solution, it is the Network Jitter Monitoring tool that helps in the analysis of VoIP traffic and measuring the amount of jitter and latency, if any, by analyzing data packet streams traversing a network.
Administrators can grasp the performance and quality of their VoIP traffic because the Network Jitter Monitor measures various aspects like current jitter and maximum jitter levels. Any calls that have issues can be isolated for further analysis based on these jitter metrics as well as common error codes.

The tool also allows for the maintenance of high-quality VoIP communications by analyzing call record details from popular brands like Cisco and Avaya. SolarWinds offer you the chance to try out the VoIP & Network Quality Manager on a free trial.
Why do we recommend it?
SolarWinds VoIP and Network Quality Manager is a specialized package with which enterprises can keep track of multiple sites and VoIP traffic metrics, all from a single console. You can even go through the call logs that contain information that will help identify the root cause of poor performance.
Who is it recommended for?
Investing in this tool will be only worthwhile if you get a lot of voice network traffic. Using SolarWinds NetFlow Traffic Analyzer, you can monitor bandwidth for VoIP metrics and other types of network traffic.
Pros:
- Enterprise-focused solution for VoIP management, highly detailed
- Can easily monitor multiple sites and key quality metrics from a single customizable dashboard
- Features a network map that helps teams visualize VoIP issues, great for troubleshooting complex deployments
- Can automatically discover VoIP devices, making on-boarding a simple process
- Supports SLA monitoring measuring packet loss, jitter, MOS, and latency
Cons:
- The tool is specifically designed for enterprise use, fully exploring all features and options will take time
4. Multiprotocol Network Tester
Here we have an open-source network testing tool from StarTrinity. It is a deceivingly tiny application that really packs a surprising punch when it comes to painting a complete jitter and latency picture of a network.
Key Features:
- Free to use
- Identifies irregular transmission
- Simulates traffic
This free tool helps monitor delays in IP packets and helps spot the reasons for jitter and latency. It can also be used to spoof attacks on the network to see how it will hold up in case of an actual attack.
Administrators can run tests for extended times to find the maximum jitter times.
Why do we recommend it?
Multiprotocol Network Tester is a free tool with which you can record and track the root cause for IP packet delays and latency. You can even run tests for longer periods of time and identify any irregular traffic or transmission.
Who is it recommended for?
Businesses with complex network environments and IT professionals can use the open-source tool to test and troubleshoot network issues as well as evaluate the network performance.
Pros:
- Doesn’t just record jitter it investigates it
- Enables systems to be tested by generated traffic
- Simulate irregular traffic
Cons:
- Not much of a user guide
Download the StarTrinity Multiprotocol Network Tester for FREE. It is available for Windows or Linux.
Keep your network free from jitter and latency
We hope this article was helpful in getting you to identify jitter and latency on a network. We also hope that you will now be able to rid your infrastructure of the two issues.
Jitter and latency FAQs
Can jitter be higher than latency?
It is possible that jitter on a line could get higher than latency. This is because jitter is a measure of deviation from a standard rate of delivery and latency is the time a packet takes to get from source to destination. So they actually measure two different things. Consider this scenario. A sender issues packets at a regular rate and then, for some internal reason, stops sending packets for a while and then resumes the transmission. If that pause s longer than the time it takes for a packet to travel down the connection, the gap between the last packet before the pause and the first packet on resuming would be a greater period than the time it takes for each packet to travel. In this case, the jitter would be caused by a problem with the sending device rather than on the connection. Such a delay could also be caused by one of the routers in the path pausing and resuming its operations.
How is jitter different from delay?
Propagation delay is the time it takes for the first bit of a packet to travel from source to destination; jitter is the variation in arrival rate of data packets. So delay measure travel time and jitter measures packet arrival frequency.
