Windows Management Instrumentation (WMI) has been a component of all Windows versions since Windows 2000. It is an interface through which applications can push notifications to the user of the computer. It is a part of all flavors of Windows, including Windows Server. This capability is not restricted to Microsoft utilities and operating system elements. Any software developer can include WMI notifications in a program. We take a look at the best WMI monitoring tools.
Here is our list of the best WMI monitoring tools:
- ManageEngine OpManager (EDITOR’S CHOICE) Excels in WMI monitoring and real-time network alerts. Customizable dashboards and integrated tools enhance its usability. Start a 30-day free trial.
- Paessler WMI Service Sensor with PRTG (FREE TRIAL) WMI monitor integrated into the three-in-one PRTG, which monitors networks, servers, and applications. Runs on Windows Server. Start a 30-day free trial.
- Site24x7 Windows Monitoring (FREE TRIAL) This endpoint monitoring tool from a cloud platform includes the tracking of Microsoft software. Start a 30-day free trial.
- SolarWinds WMI Monitor with Server and Application Monitor Part of the Server and Application Monitor, which specializes in WMI monitoring and runs on Windows Server.
- Sapien CIM Explorer In-depth WMI and Powershell monitor for the tech-savvy.
- Nagios Core Comprehensive network monitoring system with WMI plug-ins available. Runs on Windows and Linux.
- WMI Explorer Free WMI data browser available on GitHub.
- Adrem Free WMI Tools Free WMI data viewer and event log manager.
- Hyena WMI Inventory Reporting Tool Part of an operating system analysis bundle. This tool has great data-gathering capabilities.
- NirSoft Simple WMI Viewer WMI data viewer with a scripting interface.
- Goverlan WMIX Free WMI data gatherer with a WQL query assembler built-in.
- Powershell WMI Explorer WMI data gatherer that uses Powershell for information fetches.
How does WMI work?
The WMI mechanism is based on principles designed by the Distributed Management Taskforce (DMTF) which were defined in two published protocols: Web-Based Enterprise Management (WBEM) and the Common Information Model (CIM). Essentially, they enable background tasks to get through the constantly-running desktop environment by including a message check routine within the environment’s desktop management program.
The routine provides a service that is a little like a pigeonhole system. Applications that want to get their notifications displayed on the desktop place them in a specific area of memory. When the desktop program cycles back around to the point that instructs it to check for messages, all of the waiting notifications will be processed in turn and displayed in the expandable panel on the right side of the desktop.
Problems with WMI
The desktop area that contains “published” notifications is called the Action Center. Once all messages have been processed, the desktop shows an alert to the user, informing about the presence of notifications in the side panel. The design of the icon that gives access to the Action Center also changes to show the presence of unread notifications. This icon is a square speech bubble that is hollow if there are no unread notifications and solid if there are. These two communication methods do not necessarily allow the user to see those notifications.
The Action Center is not permanently visible, and so messages only get read if the user chooses to open the side panel. Either intentionally or through forgetfulness, the user might never open the Action Center and so might never read those notifications. A context menu on the notifications icon in the system tray also enables the user to flush the notifications from the Action Center regardless of whether or not they have been read.
The use of WMI messaging is a useful “forget me not” channel for the developers of commercial software and it is also possible for websites to push notifications through WMI via WBEM. This means that the notifications system is a little over-exploited as a method for reminding potential customers of a product’s availability. It has become an important marketing channel. As people tend to resist sales pitches, they have become inured to the benefits of the Action Center. It can get full of “spam,” so it is not unusual for users to regularly empty out the Action Center notifications without reading any of them, much in the way that they delete all contents of the Junk folder in their email system.
Uses for WMI
The disregard of Action Center messages is a shame, particularly in commercial situations. WMI is used by a number of important business applications and even network administration functions send WMI notifications. SNMP, for example, can be set to process alerts into the Action Center through WMI. So, you could be using WMI much more effectively to help you manage your network and also to alert end users of errors on their devices.
WMI includes APIs and if you have programming support, you could use this system to communicate with end users via alerts. However, in order to change the culture and encourage users to drop their prejudices against the Action Center as a waste of time, you need to filter out irrelevant messages and marketing ploys.
WMI tools
You can exploit WMI notifications to gain information on your computer, your server, or your network if you can properly filter and manage those messages. Unfortunately, the Action Center doesn’t include any controls. However, there are a number of useful WMI assistants on the market that can help you harness the information contained in WMI notifications without having to wade through spam.
The following sections explain the benefits of each of these tools.
The Best WMI Monitoring tools
Our methodology for selecting WMI monitoring tools
We reviewed the market for Windows Management Instrumentation monitors and assessed the options based on the following criteria:
- Collection of WMI messages
- Creation of WMI activity statistics
- Categorization of WMI messages by source
- Alerts for high WMI output from a specific source
- Filtering for WMI message severity
- Free trial or a demo service that enables an assessment before buying
- Value for money from a WMI monitoring package that supports other Windows system activity monitoring as well
1. ManageEngine OpManager (FREE TRIAL)

ManageEngine OpManager’s WMI monitoring capabilities provide comprehensive insights into the performance and health of Windows devices. Utilizing the WMI protocol, it can monitor various parameters such as CPU usage, memory consumption, disk space, and process status in real time. This detailed monitoring allows network administrators to proactively identify and resolve issues before they impact the network’s performance.
Key Features:
- WMI Monitoring: Monitors Windows devices using WMI protocol for comprehensive insights.
- Real-Time Network Monitoring: Provides instant updates on network status and performance metrics.
- Customizable Dashboards: Allows users to tailor dashboards to display relevant metrics and alerts.
- Threshold-based Alerts: Triggers notifications based on user-defined thresholds for proactive management.
- Integrated Network Tools: Includes tools for network troubleshooting and diagnostics within the same platform.
Why do we recommend it?
ManageEngine OpManager is recommended for its robust WMI monitoring capabilities, which provide comprehensive insights into Windows device performance and health.
OpManager’s WMI monitoring includes customizable alerts and reports, ensuring that administrators are always informed about the critical aspects of their Windows environment.
In all, ManageEngine OpManager offers comprehensive insights into Windows devices. The platform provides real-time alerts and customizable dashboards, making network management efficient and user-friendly. Integrated tools for troubleshooting enhance its utility, while the instant notifications ensure prompt response to network issues. Although it requires significant resources and has a steep learning curve, its robust feature set makes it a standout choice for network administrators.
Who is it recommended for?
This tool is ideal for network administrators and IT professionals who need detailed monitoring of Windows environments and require a comprehensive network management solution.
Pros:
- Comprehensive WMI Monitoring: Offers detailed monitoring of Windows devices, enhancing network visibility.
- Instant Alerts: Sends real-time notifications for quick response to network issues.
- User-Friendly Dashboards: Customizable dashboards improve usability and efficiency.
- Integrated Tools: Built-in network tools facilitate easier troubleshooting and diagnostics.
Cons:
- Limited Third-party Integration: May not seamlessly integrate with all third-party applications.
Get started with a 30-day free trial.
EDITOR'S CHOICE
ManageEngine OpManager is our top pick for a WMI monitoring tool because this network device and server monitoring system gathers most of its statistics about Windows endpoints through WMI. This is particularly useful for reporting on processor activity. The WMI service can provide details on each running process, even those that are running in the background and possibly don’t display any current activity. The service can also track disk usage and memory utilization. Each of the statistics that OpManager collects has thresholds on then that will activate alerts if they are crossed. The system can forward alerts to technicians by email or SMS. This mechanism allows a support team to focus on system maintenance tasks because there is no need to sit and watch the monitoring console waiting for problems to arise – they will be notified when they are required.
Download: Get a 30-day free trial
Official Site: https://www.manageengine.com/network-monitoring/download.html
2. Paessler WMI Service Sensor with PRTG (FREE TRIAL)
Paessler doesn’t produce many individual stand-alone tools. Instead, it ships one monolithic package, called PRTG Network Monitor, that covers every imaginable utility that you could possibly want in order to monitor networks, servers, and applications. This bumper pack contains a series of “sensors.” The functionality of PRTG depends on the sensors that you activate. So, if you want a network monitor, you buy PRTG and turn on the network monitoring sensors. If you’re in the market for a server monitor, you just turn on PRTG’s server monitoring sensors.
Key Features:
- WMI Monitoring: Delivers detailed statistics on WMI services for in-depth analysis.
- File Monitoring: Utilizes WMI for precise file service tracking.
- Custom Alerts: Generates notifications for identified performance issues.
Why do we recommend it?
Paessler PRTG Network Monitor is able to monitor endpoints and software as well as networks. The system is offered as a SaaS platform or a software package for installation on Windows Server. You buy an allowance of sensors and decide which to turn on and there is one for WMI monitoring.
PRTG contains WMI sensors, so you can just use the package as a WMI monitor and leave all of the other sensors turned off. A big benefit of that strategy is that it will cost you nothing. Paessler’s charging bands for PRTG are calculated on the number of sensors that you want to use and the system is free for 100 sensors or less.
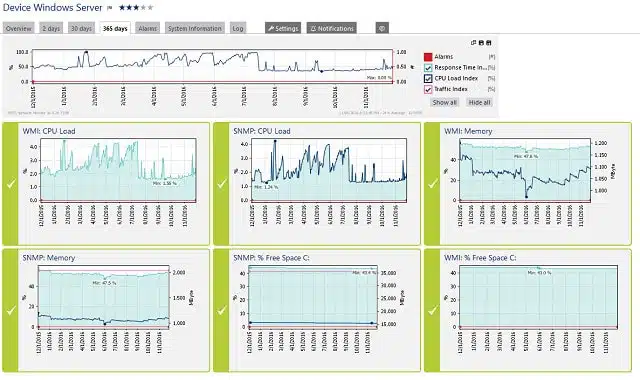
The screenshot above shows how PRTG interprets WMI notifications. In this view, you can see performance graphs for both WMI and SNMP notifications. The graphs represent the volume of generated notifications and in this view, you can see a whole year’s worth of data interpreted. The view can be reduced down to a two-day timeframe, giving you notification volumes per hour. Alerts are also depicted on the graphs, represented as dots imposed on the performance line.
The illustration shows just one way that you could use WMI notification data. The dashboard is completely customizable and you can also drill down to view individual notifications. You can also create custom alerts based on WMI messages.
Who is it recommended for?
The Paessler PRTG system is suitable for businesses of all sizes. If you only want to use 100 sensors, you don’t have to pay anything. This is an appealing option for small businesses. Larger companies only pay for the monitoring system that they really need with a minimum order quantity of 500.
Pros:
- Versatile Data Collection: Integrates packet sniffing, WMI, and SNMP for comprehensive network insights.
- Instant Inventory Updates: Auto-discovery keeps device inventories current without delay.
- Intuitive Customization: Features a drag-and-drop editor for personalized dashboard and report creation.
- Diverse Notification Options: Offers alerts through SMS, email, and external integrations for timely updates.
- Freeware Availability: Provides a no-cost version for small-scale monitoring needs.
Cons:
- Learning Curve: The platform’s complexity and breadth of features necessitate a commitment to learning for effective use.
PRTG is a very comprehensive tool and it is highly likely that you will want to turn on other sensors beside the WMI features. For example, the user in the illustration above chose to implement SNMP monitoring as well. This strategy is perfectly feasible and could even be managed within the 100 sensor limit on the free version. If you want to deploy PRTG fully, you will have to pay for it. You can get a 30-day free trial of PRTG with unlimited sensor activation.
3. Site24x7 Windows Monitoring (FREE TRIAL)
Site24x7 Windows Monitoring is a cloud-based service that reaches out to endpoints running Windows through the installation of an agent. This system watches the computer’s physical resources, the operating system, and also any Microsoft software installed on the computer. The system can monitor Windows Server with all of its integrated services.
Key Features:
- OS Surveillance: Monitors the health and performance of Windows operating systems.
- Microsoft Ecosystem Tracking: Keeps an eye on Microsoft services and applications.
- Resource Observation: Analyzes CPU, memory, disk, and network usage metrics.
Why do we recommend it?
Site24x7 Windows Monitoring is part of a cloud platform that provides full-stack observability. The task of Windows monitoring is a cross-modular task and involves examining server resources and services, such as web servers and email systems. So, the multiple modules of Site24x7 provide all of the coverage needed for the task.
The Windows Monitoring system collects 80 metrics about the operations of a Windows Server computer. Some of these statistics relate to CPU, memory, disk, and interface activity. So, the tool isn’t just about monitoring Windows; it also monitors all of the components of a computer that the Windows operating system guards and controls.
Watching operating system activity is a major part of Windows monitoring. This section of the Site24x7 platform’s tasks looks for errors and operating slowdowns that create inconvenience and could be the start of something worse. Microsoft created Windows Events and Windows Management Instrumentation to identify status problems and systems activity. So, the Site24x7 system collects, analyzes, and displays information from those sources.
Windows includes so many important utilities, such as the registry and system management functions and Windows Server has many more. Windows Server is really Windows, with a lot of extra software bundled into it. These extras include Hyper-V virtualization, and Internet Information Services, which is the IIS web server. These important systems report statuses through Windows Events and so the log collection process of Site24x7 catches problems with those tools while it is monitoring Windows activities.
Many business buy their productivity software from Microsoft. This group of products is bundled together under the Microsoft 365 and Office 365 brands. While many of the tools in the suite are now hosted on the cloud, there are still a few components that you could be running on your own servers. Specifically, these are Microsoft Exchange Server, Microsoft Outlook, and SQL Server. The Site24x7 Windows Monitoring package watches these software systems as well.
While not directly part of the Windows Monitoring task, there are network and application issues that the Site24x7 platform monitors that will have connections to the performance of a Windows server. For example, email performance problems might be due to issues arising in Exchange Server or in the Outlook mail client, or it could actually have nothing to do with those two Microsoft systems and be caused by the network between these two components. So, many of the other monitoring services in the Site24x7 platform will help to ensure that your Windows system is delivering efficiently.
Who is it recommended for?
This package is necessary for any business that runs the Windows operating system and the Microsoft software that runs on top of it. This includes most of the companies in the world. The tool is suitable for small businesses because it is sold in plans that are sized and priced for the smallest enterprise. Very large companies currently use Site24x7 – NASA, GoDaddy, and SAP are on the package’s customer list.
Pros:
- Comprehensive Coverage: Offers full-stack observability across Windows environments.
- Detailed Event Logging: Gathers and interprets Windows Events for actionable insights.
- Integrated Server Management: Enhances oversight of server operations through OS monitoring.
Cons:
- Cloud-Only Deployment: Lacks an on-premises solution for businesses preferring local control.
The whole Site24x7 platform provides extra services that can help you keep your Windows system running well. These include the Log Management unit, which is included in all plans. The list of editions available from Site24x7 includes one for managed service providers. You can examine the Site24x7 system before buying by accessing a 30-day free trial.
4. SolarWinds WMI Monitor with Server and Application Monitor
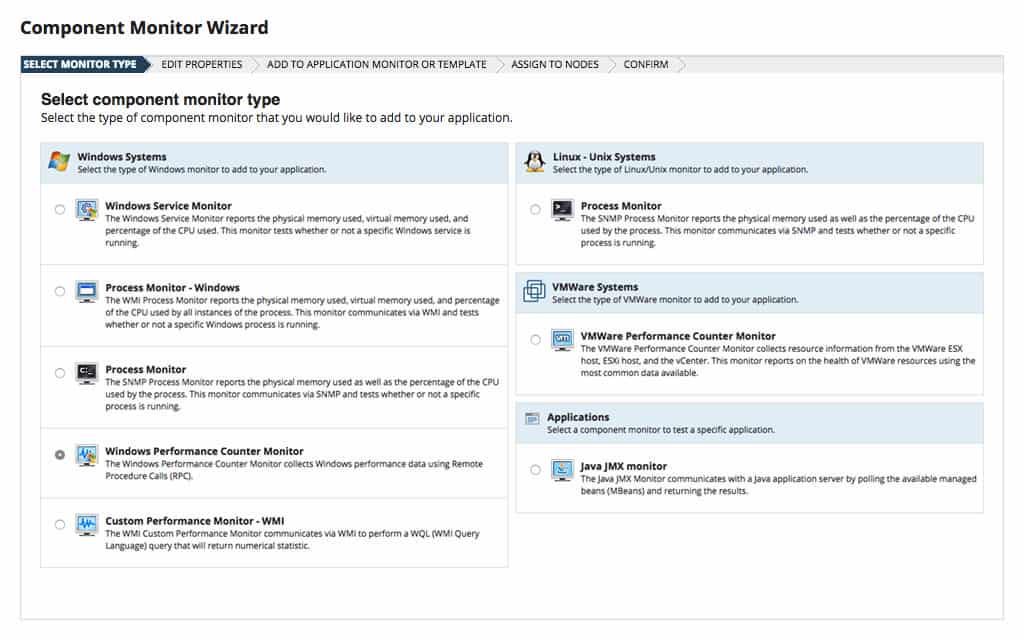
The SolarWinds Server & Application Monitor (SAM) includes a section that allows the user to add on extra monitoring systems to the standard monitors that appear in the package out of the box. The addition of these tools doesn’t require any technical skills because the SAM has a guided service creation facility that includes a setup for a WMI Process Monitor.
Key Features:
- WMI Process Monitoring: Tracks live WMI activity for comprehensive oversight.
- Dynamic Graphs: Offers customizable visualization of performance data.
- Server Correlation: Relates WMI metrics to server operations for better analysis.
- SNMP Integration: Enables SNMP-based reporting for diverse monitoring.
Why do we recommend it?
SolarWinds Server & Application Monitor provides performance tracking for applications, services, and servers. The WMI system in the Windows operating system is one of the services that this package will track. The WMI screen in the SolarWinds dashboard shows live processor activity with time-series graphs. This is a software package for Windows Server.
The screen that gets created by this service shows live WMI activity and you can specify which values to show in the output and where they appear. The screen creator automatically connects the selected display elements through to sensors on the server that selects that data from the WMI system.
The SolarWinds process monitoring service is also able to create live feedback on other technologies running on your server. Factors that can be displayed include physical server resource activity, which includes those system metrics that are displayed in the Performance tab of the Task Manager. It is also possible to get a screen built on SNMP activity.
Process monitors can also be set up for data gathered from Linux computers, even though the software for the Server & Application Monitor runs on Windows Server.
Who is it recommended for?
Anyone can get a free WMI monitor within the Windows operating system. However, large businesses need to centralize monitoring in one office, so remote access to that WMI data is essential. The SolarWinds system is able to collect WMI data from many PCs and servers, so large businesses will get the most out of this tool.
Pros:
- Enhanced Monitoring: Augments the standard Server & Application Monitor with additional capabilities.
- Simplified Setup: Features a guided process for creating monitoring screens without technical hurdles.
- Intuitive Displays: Provides clear, easy-to-understand visualizations of data.
- Versatile Reporting: Includes options for visualizing server resource usage and SNMP metrics.
Cons:
- Separate Installation: This functionality could have been integrated into the main package from the start.
- Trial Access: Full exploration of features is limited to a 30-day trial period.
You can try out the WMI Process Monitor creation system by accessing a 30-day free trial of the Server & Application Monitor.
You can extend your management of system messages by opting for the Log and Systems Performance Pack. This package that runs on Windows Server, you get the SolarWinds Log Analyzer as well as the Server & Application Monitor. You can get the bundle on a 30-day free trial.
5. Sapien CIM Explorer
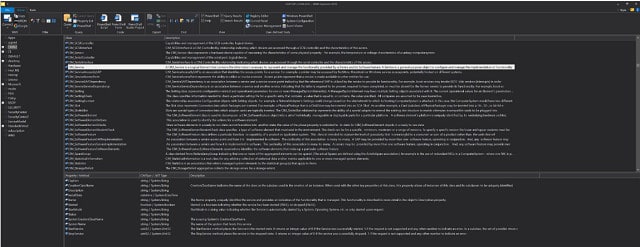
Sapien produced a full WMI management tool with its CIM Explorer. This is a much more in-depth WMI tool than the others on this list and focuses purely on WMI notifications. It also gives you access to PowerShell. This is a very technical tool and if you understand how PowerShell works and how WMI messages are structured then you will never want to use any other tool for accessing the WMI system. If you are not adept with programming concepts and you don’t work well with codes and tokens, then you will struggle to get anything meaningful out of this utility.
Key Features:
- Advanced WMI Access: Offers deep dives into WMI data with customizable queries.
- Data Persistence: Stores WMI messages for comprehensive analysis and offline access.
- Export Options: Facilitates data sharing with support for multiple formats.
Why do we recommend it?
Sapien CIM Explorer gives you access to the Common Information Model that underlies the Windows WMI system. This enables you to write your own WMI data extract processes. Set up scripts to run continuously and you can create your own live monitoring tool. The Explorer also provides an ad-hoc query environment.
Sapien CIM Explorer throws back the curtain of user-friendly front ends and gets you right into the pit of WMI data, the digital equivalent of getting your hands dirty.
WMI stores Action Center messages in a database, and CIM Explorer gets you into that data source directly. You can examine data from the computer that you have the Explorer installed on and also access the WMI stores of other computers over a network. The program will even cache messages from remote systems so you can still explore their WMI data when they are not able to be contacted.
As you read above, there is a large volume of WMI notifications lurking in the depths of every Windows computers and you need to cut down the overgrowth before you can detect any meaningful information. Sapien is very good at providing you with filters and search facilities that act as your machete as you delve into the jungle of WMI.
The tool includes a VBScript and PowerShell script generator to create data gathering and formatting procedures. Again, use these with caution. If you are not familiar with PowerShell, you would be better off looking at the templates that the tool provides. These are pre-written scripts that will automate data collection for you.
Each notification in the WMI database is usually linked to an explanation that is made available online by the software house that provided the notification-generating program. This information can provide deeper explanations for any error codes contained in the WMI message and even propose solutions. CIM Explorer pulls in those guides to help you fix the problems that the WMI message alerts.
Data can be exported in HTML, XML, CSV, and plain text. CIM Explorer doesn’t have a fancy user interface, so the developers expect users to transfer data into other applications, such as Excel for analysis.
Who is it recommended for?
Technicians who like to stretch their programming and scripting capabilities will love this package. However, if you don’t know how the CIM system works and you don’t have time to learn, you will never use this tool. The good news is that this software package has a low price.
Pros:
- Professional-Level Tool: Caters to IT experts with robust scripting capabilities.
- Offline Functionality: Enables continued work with cached WMI data, enhancing flexibility.
- Scripting Support: Features extensive VBScript and PowerShell scripting tools for customized data extraction.
Cons:
- Complex Usability: Presents a challenging learning curve for those less familiar with CIM or scripting.
- Text-Intensive Interface: The heavily text-based UI may deter users looking for graphical insights.
- Niche Appeal: Best suited for users comfortable with programming and advanced system management.
CIM Explorer is not free, but is very cheap. The price you pay gets you the software to use forever, but it only gives you support for one year. That support is not just a Help Desk, but also includes patches and updates. You can buy a support package for subsequent years.
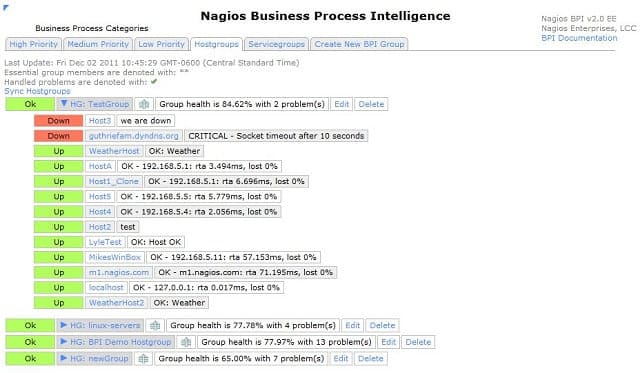
6. Nagios Core
Key Features:
- Network-Wide WMI Collection: Efficiently harvests WMI data across the network.
- Plug-in Expansion: Offers enhanced functionality with a wide array of plug-ins.
- Resource Monitoring: Tracks the performance of endpoint resources alongside WMI data.
Why do we recommend it?
Nagios Core is a free system monitoring tool that covers networks and servers as well as services and software. The package includes WMI monitoring. The advantage of Nagios is that it can be expanded by add-ons, called plug-ins, which are available for free from the Nagios Exchange.
Nagios runs on Windows and Linux. However, don’t think that you can’t gather WMI data if you install the monitor on a Linux computer because the system reaches out over the network to explore systems data on every computer connected to it. That exploration includes the gathering of WMI data.
The WMI usage of Nagios is not specifically channelled towards one screen in the dashboard because the tool exploits the WMI system to gather data on application and host performance, so a lot of the feedback of live statuses that you see in the tool is actually based on WMI notifications.
Who is it recommended for?
As it is free to use, Nagios Core will automatically appeal to small businesses that don’t have big budgets for IT systems. However, it is a large and comprehensive full stack observability package, so it is particularly interesting for startups and rapidly expanding small companies. The software runs on Linux or on a VM.
Pros:
- Cost-Effective: Open-source, free solution with optional paid upgrades for enterprises.
- Auto Discovery: Simplifies network device management with automatic discovery features.
- Cross-Platform Capabilities: Capable of running on Linux and aggregating WMI data from Windows systems network-wide.
Cons:
- Basic Interface: Lacks sophistication in user interface design, requiring usability improvements.
- Limited Visuals: Network mapping and visualization tools could benefit from enhancements.
- Additional Costs: Advanced support services are available but at an extra cost.
Nagios Core is a world-beating free network monitoring system. There is also a paid version, called Nagios XI. Both versions can be enhanced by add-ons that are available for free from a very active user community. Both versions of Nagios employ WMI to gather data and present it to administrators. There are also a number of WMI-related plug-ins available from the community.
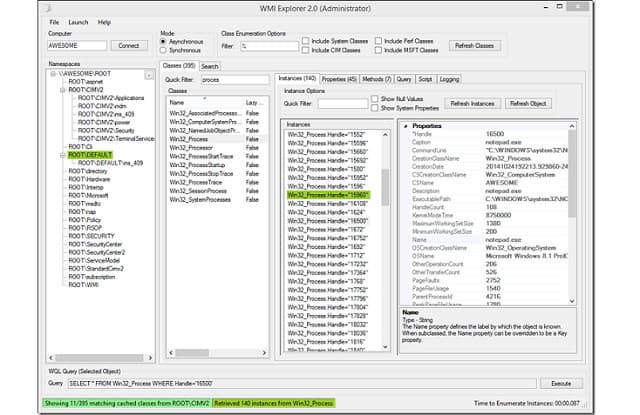
7. WMI Explorer
Key Features:
- Intuitive Data Browsing: Employs a user-friendly interface for navigating WMI data.
- Endpoint WMI Access: Facilitates direct WMI queries on local or remote machines.
- WQL Support: Simplifies query creation with an automated WQL assembler.
Why do we recommend it?
WMI Explorer solves the complexities of learning the CIM command structure that you would need to use the CIM Explorer. This system has a query assembler, which does all of the hard work for you. The program is small and it doesn’t use much processor power, and you can’t do any damage to the computer.
This is a WMI data browser. The layout of the interface is similar to Windows File Explorer. It has a tree structure in a panel to the left of the window, which looks like the directory panel in File Explorer. The next panel lets you narrow down records by class and then you get a search panel to filter out results even further. The right-most panel in the screen is a data viewer, showing the details of the currently-selected object.
What these different panels actually show are the elements of the WMI Query Language. So, as you select options from each list, you are really assembling a WQL query. The interface assembles the query in a line at the bottom of the screen, so this is actually also a WQL tutorial. As you use the WMI Explorer you will become more familiar with the language.
This is a very straightforward interface, and you don’t need specialist skills in order to use it. You can explore any computer remotely over a network as long as you have the admin password for it. As well as assembling the WQL query, the tool will generate a PowerShell script to deliver and execute the query in the WMI database and return the results. This tool takes care of all of the programming work needed to fetch WMI data.
Who is it recommended for?
This is a free tool, so there is no cost barrier to using it. There are two interface options for the system; Query View and GUI. If you access the GUI version, you can connect to remote computers to examine the values of their WMI databases. This is crucial to the requirements of corporate support teams.
Pros:
- Cost-Free Accessibility: Available as an open-source tool without any associated fees.
- User-Friendly Interface: Designed to mirror the familiarity of Windows File Explorer, enhancing ease of use.
- Remote Management Capability: Allows for the exploration and management of WMI data on remote systems.
Cons:
- No Official Support: Lacks a dedicated support option, relying on community assistance for troubleshooting.
- Community-Dependent Fixes: Bug resolutions and updates are contingent on community contribution and timing.
This tool is an open-source project and you can use it for free. It was developed by a systems administrator who couldn’t find the right tool to enable him to sort through WMI notifications, so he wrote one himself. He then made this tool available to others.
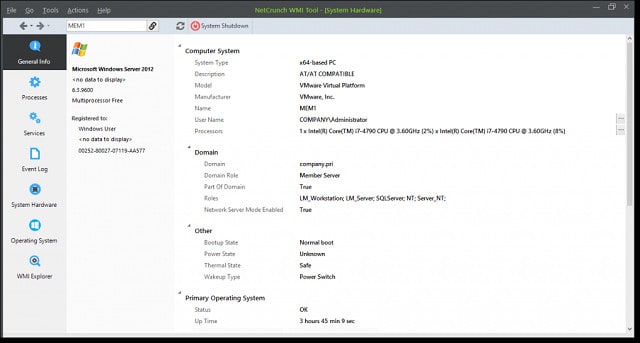
8. Adrem Free WMI Tools
Key Features:
- Comprehensive Toolkit: Includes a variety of tools for in-depth WMI exploration.
- Event Log Access: Provides detailed insights into system event logs.
- WMI Query Capabilities: Supports the creation and execution of WMI queries.
Why do we recommend it?
Adrem Software offers NetCrunch Tools, which are free to use. This package of utilities includes useful, small system administration tools. In this collection, you will find WMI tools. Apart from the WMI Explorer, which is the core utility in the toolkit, there are pages in the interface that give system information.
The WMI Tools include access to event logs and they can also query system statuses for you. These utilities make this free pack of utilities into a lightweight system monitoring tool, taking you far beyond simply viewing WMI messages or gathering statics on their sources and frequency.
The views available in the interface are:
- Overview – giving a general system summary
- Processes – shows all current, active processes on the machine being examined
- Services – a list of all installed services and their status, including inactive services
- Event Logs – a list of all of the event logs on the machine
- Hardware – live details of hardware statuses
- Operating System – all active OS components
- WMI Explorer – a WMI Query Language interpreter
This set of tools gives you very comprehensive controls over the Windows machines in your business. The only downside to the way the toolset is structured is that it can only give views on one computer at a time.
The data interpretation screens mean that you would very rarely need to go to the WMI Explorer tool to make direct investigations on the raw data. For most people, the system status visualization and well-planned data layout would provide sufficient information.
If Adrem ever created a consolidated version of this utility, it would be a fully-fledged infrastructure monitoring system. The pleasing GUI interface, together with its view limitations, makes this tool well-suited to small networks, where possibly an owner-operator would have to take responsibility for administering the system. You would not need any technical skills in order to install and use this great pack of system monitoring utilities.
Who is it recommended for?
The WMI tools are useful for exploring a PC. They are free to use and you can just install the toolset on each device for diagnostics. However, the tool isn’t networked, so it is a solution for small businesses that have few computers all in one place that can be visited and checked for issues.
Pros:
- Intuitive Design: Features a user-friendly interface that simplifies system administration tasks.
- Rich Tool Selection: Equipped with an array of utilities for system monitoring and management.
- Hassle-Free Setup: Allows for quick and straightforward installation across devices.
- Cost-Efficiency: Available for use at no charge, offering significant value.
Cons:
- Credential Requirement: Accessing data on remote machines necessitates administrative credentials.
- Limited Network Utility: Not ideally suited for extensive or complex network environments due to its focus on individual device management.
9. Hyena WMI Inventory Reporting Tool
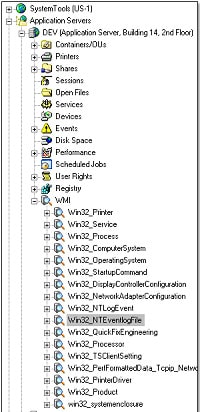
Hyena is a system monitoring package created by System Tools Software. The Enterprise Edition of this pack includes the WMI Inventory Reporting Tool. This is a query interpreter and VBScript generator. The utility takes all of the programming requirements out of the task of monitoring WMI by presenting each query element in a series of lists. The user assembles a query using point-and-click options and then the tool will package the assembled query in VBScript to delivery it to the WMI database and retrieve results.
Key Features:
- Query Assembly: Simplifies WMI data queries with a user-friendly selection process.
- Script Generation: Automatically produces VBScript for executing WMI queries.
- Extensive Data Collection: Enables detailed inventory reporting on networked computers.
Why do we recommend it?
Hyena WMI Inventory Reporting Tool has a Windows Explorer display format that is a similar concept to the Query View of the WMI Explorer. This system will generate VBScript queries for WMI database inquiries, which is also similar to WMI Explorer. This package also supports the creation of scripts for admin tasks.
Before you have recourse to the WMI query assembler, you could browse through a library of pre-written queries, one of which may well already cater to your objective. Whether you run a library query or create your own, you have the option to run the investigation on your own computer, or a remote computer, or even on groups of computers. You will need the admin permissions of all of the computers that you access.
The utility is called an “inventory reporting tool” and you can use it to log many details about each Windows computer that you have connected to your network.
Types of information that can be gathered with the tool include:
- Computer make, model and system asset ID
- CPU type, architecture, capacity, and utilization
- Memory capacity and utilization
- Operating system, service pack level, and serial number
- Computer MAC addresses and IP address plus DHCP details
- Installed applications, hotfixes, and security updates
The tool includes an action execution function, which enables you to execute programs that act on the collected WMI data. This task automation includes log management, DHCP address management, launching or killing processes, removing applications, creating system startup routines, and commanding reboots or shutdowns. All Hyena activities can be logged for audit purposes.
One weak point of Hyena is its interface. It is very good at gathering data but it isn’t very good at displaying it and there aren’t many analytical features in the utility. However, you can export data from Hyena to Access or Excel for analysis there.
Who is it recommended for?
Hyena isn’t free and a license is quite expensive. However, the price is levied per administrator, not per device. You can access as many computers remotely as you like with one license without incurring an extra fee. So, this tool ends up giving better value for money for larger networks.
Pros:
- Pre-Built Queries: Includes a range of ready-to-use queries for quick data retrieval.
- Customizable Reporting: Allows for tailored inventory reports to meet specific needs.
- Automation Capabilities: Facilitates task automation for efficient system management.
Cons:
- Outdated Interface: User interface can be challenging to navigate due to its complexity and design.
- Limited Analytical Tools: While strong on data collection, it falls short on in-depth data analysis.
- Cost Consideration: May not be the best value for smaller networks due to its pricing structure.
Hyena is not a free tool, but you can try it out on a 30-day free trial.
10. NirSoft SimpleWMIView
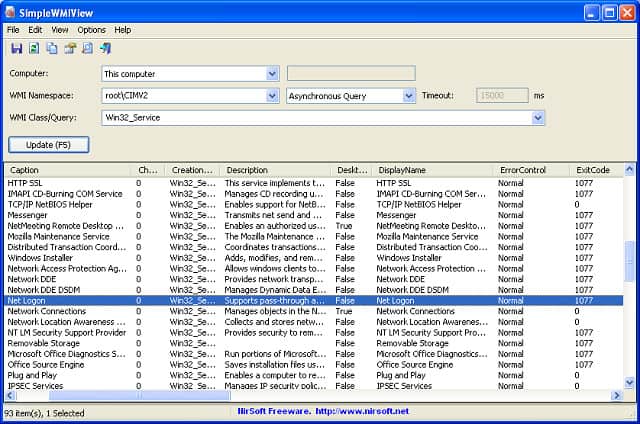
NirSoft offers a free WMI database front end, called SimpleWMIView. This tool displays the records that it encounters in a given WMI namespace on a given computer. The tool tabulates WMI records for easy viewing and this formatting also makes the records easy to write out to CSV files for import into other tools, such as Excel. It is also possible to write out plain text, tab-delimited, HTML, XML, and JSON formats.
Key Features:
- Multi-Computer Monitoring: Accesses WMI data across multiple systems.
- Flexible Viewing: Offers a streamlined interface for easy WMI data inspection.
- Command-Line Operation: Enhances utility with scriptable, command-line functionality.
Why do we recommend it?
NirSoft SimpleWMIView uses an interface layout that is a little like Task Manager. The screen reads in records and then shows them – it doesn’t provide a live view because you have to hit an update button to get newer records. The download gives you the executable, so there is no installer.
The download for the utility is its executable file, so it doesn’t require any installation process. You just run the downloaded file to get the interface running. SimpleWMIView can also be run at the command line with a series of options that get your WMI data into a file without opening the interface.
The program will access WMI records stored on the same computer on which the SimpleWMIView software is installed. However, it is possible to connect to other computers over the network through the interface.
The interface includes some straightforward filters and you can set up your own WQL data filters if you have knowledge of the query language. The interface is also able to sort data on any of the columns shown in the interface. All of these data manipulation actions can also be specified at the command line.
The ability to gather data through a command makes it possible to integrate this utility into a batch job and run queries periodically. This is a good option if you want to archive off WMI messages into log files. So, you can create your own WMI log file server with this tool.
The utility works well if you are looking for a raw data manipulation tool. It doesn’t really rank as a WMI analysis tool. However, the range of export formats that the tool provides means that it would be a good back-end for any other tool, which could provide better analysis functions.
Who is it recommended for?
This tool is free to use and so it competes with the Adrem tool and WMI Explorer. It is possible to query remote computers across the network from one console, which makes this a viable option for support teams of mid-sized companies. It is also a good tool for small businesses.
Pros:
- Ease of Use: Straightforward interface for efficient data management.
- Versatile Interface Options: Supports both GUI and command-line operations for diverse user preferences.
- Pre-Set Filters: Equipped with built-in filters for quick data sorting and analysis.
- Free Tool: No cost, providing an accessible solution for all users.
Cons:
- Basic Reporting: Lacks advanced reporting features and a variety of export formats for deeper data analysis.
11. Goverlan WMIX

Goverlan’s main product is a network monitoring tool, called Reach. The company also produces a number of complementary tools and WMIX is one of these. The WMIX is a free WMI data gatherer.
Key Features:
- Network-Wide Collection: Gathers WMI data across the network efficiently.
- WMI Query Builder: Simplifies the creation of WMI queries with a GUI interface.
- Script Generation: Automatically crafts scripts for WMI data retrieval and management.
Why do we recommend it?
Goverlan WMIX is a free tool that includes a query builder, which makes it similar to WMI Explorer and Hyena WMI Inventory Reporting Tool. Goverlan explains that this utility is a great way to get to know the WMI query system. You can generate PowerShell scripts to repeat useful queries.
Like some of the other tools in this list, WMIX simply represents the elements of a WMI Query Language search in a GUI front end. As you select elements from each option panel, you will see the WQL query assemble in a field at the bottom of the screen. So it offers a good way for you to become familiar with WQL.
WMI queries are usually managed via PowerShell of VBScript. The interface packages your WQL statements into scripts so you don’t have to worry about learning the command language of these two systems. If you are interested in writing your own scripts for future WMI monitoring, you can assemble the WQL queries in the WMIX interface and then extract them for inclusion in your scripts.
The data viewer presents WMI records in a tree structure, enabling you to drill down through message categories, expanding out each node to reveal more detailed properties. A side panel explains each node’s attributes. This layout makes it very easy to explore the statuses and properties of your Windows computer.
WMIX is a very attractive query and script generator. It works both as a guide and a teaching tool as well as a data access interface. This tool would be suitable for administrators of any size network but it would be of particular interest to the managers of small systems that rely on Windows computers.
Who is it recommended for?
This tool provides a remote access option, which makes it an appealing tool for corporate technical support teams. You would probably find this tool as a working utility in SMBs whereas an administrator in a large organization might keep it for ad-hoc queries and to generate scripts for simple admin tasks.
Pros:
- No-Cost Solution: Available as a free tool, making it accessible for all sizes of networks.
- User-Friendly Approach: Offers an intuitive way for less technically-inclined users to interact with WMI data.
- Scripting Aid: Ideal for generating PowerShell scripts for those looking to automate tasks without deep scripting knowledge.
Cons:
- Interface Design: Could benefit from a modern overhaul for easier navigation.
- Limited Advanced Use: May not fully meet the needs of sysadmins heavily reliant on scripting and PowerShell for complex tasks.
12. Powershell WMI Explorer
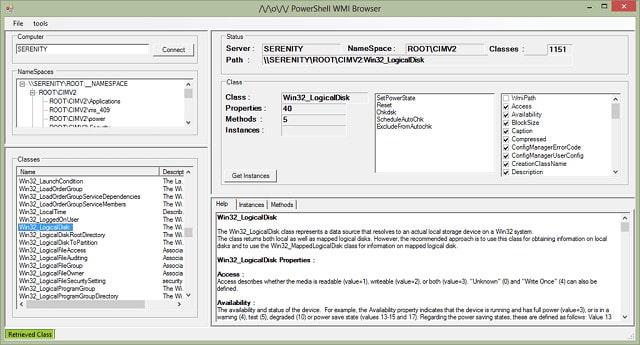
The Powershell WMI Explorer is a free, enthusiast-developed WMI interface. This tool has been around for a long time and was one of the first WMI interpreters available. Although the interface is not very sophisticated, it more or less started the whole software category of WMI interpreters, and influenced the development of all of the other tools on this list. It is sometimes referred to by its developer’s name, so you may see this tool billed as Marc van Orsouw’s WMI Explorer. Mr Van Orsouw also identifies himself as “/\/\O\/\/” so another name that is sometimes used for this tool is MoW WMI Explorer.
Key Features:
- Comprehensive Access: Mines WMI messages from both local and networked computers.
- Scripting Support: Utilizes PowerShell for data retrieval, offering a script-centric approach.
- Data Exploration: Enables in-depth exploration of WMI properties and data classes.
Why do we recommend it?
Powershell WMI Explorer is an old but highly respected WMI query tool. The display for the tool is very crowded with many panels. A nice feature is a description panel that explains the meaning of the code that is currently highlighted and its value. Such features explain why this tool endures.
The Explorer can access WMI data on the local computer or it can connect via a network to access WMI data on other computers. The interface doesn’t enable the simultaneous fetching from several sources. However, you could collect WMI records from each source, write them out to file and then merge those files if you wanted a unified overview of the WMI activity on your network.
The interface contains four main panels – two index panels to the left, and two wider data access panels to the right. The first index panel shows a File Explorer-type view of the namespaces available on the computer. The second left-hand panel lists all the data class options for WMI. The lower right-hand panel explains the selected category and also shows all of the available properties. The upper right-hand panel lets you assemble a query and then execute it.
WMI data fetches are automatically conducted via PowerShell, so you don’t have to write any of your own procedures to gather data.
The Help panel in the tool is particularly useful because it explains what each data class means. There are a lot of classes and so this reference manual can come in handy even if you don’t intend to use the tool to query WMI directly.
Who is it recommended for?
This is a useful tool for investigation because of the guides that are built into the interface. An administrator would use this system for analysis and problem investigation. It can access remote computers on a network, so it isn’t limited to querying the computer that hosts the software.
Pros:
- Foundational Tool: Acknowledged as a pioneer in the WMI tools category, influencing subsequent developments.
- Embedded Documentation: Provides valuable insights with an integrated help panel explaining WMI classes and properties.
- Scripting Efficiency: Facilitates automatic data collection through PowerShell, eliminating the need for manual script writing.
Cons:
- Outdated Interface: Lacks the ability to aggregate data from multiple sources in a modern, user-friendly format.
- No Visual Analytics: Offers limited capabilities for visual data analysis and longer-term monitoring.
- Steep Learning Curve: Requires a higher level of effort to master compared to more contemporary tools.
WMI issues
The tendency of many to ignore Action Center notifications is a gift to hackers. Similarly, intrusion detection systems often overlook WMI notifications as being too mundane to facilitate attacks. However, WMI can be used in every phase of an attack strategy, and its combination with PowerShell to transport data and queries across networks makes this tool a great conduit for data theft in plain sight.
WMI messages usually don’t make it into physical files. This means that they never become source material for host-based intrusion detection systems (HIDS) and never get considered by security information managers (SIMs) that form part of SIEM. So, simply dumping WMI messages into files periodically (daily), will begin to get those WMI notifications tracked as long as you find a HIDS or a SIM that can handle the format of the log files that your log server process produces.
PowerShell is ubiquitous in Windows systems and any attempt to block this service method would disable the usefulness of your computer because it is used by too many applications to be considered an optional system. So, despite the obvious attraction of PowerShell to hackers, network-based intrusion detection systems (NIDS) don’t always look too closely at the activities of this essential service.
The WMI operating methods include a facility called a “subscription.” This will restart a WMI process if it is killed. So, that would provide a useful mechanism for an advanced persistent threat (APT) to keep running on a computer even after a reboot or a system cleanup is performed by anti-malware software.
A combination of WMI and PowerShell provides an efficient way for fileless malware to remain active on a computer even when the original infection has been cleaned up. However, there may not need to be an initial, traceable infection. Websites are able to push WMI notifications, implemented with the permission of the user. That mechanism allows the website to send notifications to users, even when the website is no longer open in a browser on the computer. So, a malicious attack could easily be directed by a remote command center through the WMI system. The desktop process could be manipulated into transporting malicious instruction to each Windows computer by delivering the alerts requested from a remote site by a persistent WMI subscription. Network-wide activity could be coordinated through innocuous PowerShell routines.
All computer users are cautious about allowing notifications from little-known websites. However, hackers have been known to piggyback their virus distribution through the websites of trusted sites. An infected or outright fake product update is another well-known method of distributing viruses, and if the system modification is implemented as a WMI notification set-up without storing any files on the computer, antivirus systems would not spot it.
Monitor WMI
Windows Management Instrumentation is widely used by software providers and websites to communicate error information and event publicity to the users of Windows computers. The owners of computers seem less interested in the capabilities of WMI, but they should pay attention to it.
As you have read in this guide. WMI is a good source of useful system information that can be of use to private computer users and also the administrators of commercial networks. However, the overwhelming volume of non-essential messages can often drown out the usefulness of the WMI system.
If you wrote off WMI as irrelevant, then think again. Company network systems administrators should particularly start combing through WMI namespaces for system activity information. If you have become the subject of an advanced persistent threat, you won’t know about the intrusion until you look for it – that is the nature of APTs. An APT is a hidden infection that can go undetected for years. This type of intrusion compromises your system integrity, exposes data to disclosure and offers a hacker enough time to explore every corner of your business, setting traps, altering data, and harvesting authentication credentials.
Getting familiar with the WMI system, its data formatting structures, and information landscape is the first step in harnessing the power of Windows Management Instrumentation. Your next task is to start hands-on operations, and any of the tools in our list will provide you excellent support as you learn about WMI classes, WMI Query Language and PowerShell and VBScript access to data stores.
Once you are comfortable with WMI processes, you will be in a better position to assess whether your current security systems are sufficient in order to protect your company from fileless malware attacks and advanced persistent threats. If you can’t find a SIEM system that currently gathers WMI data, write your own WMI log management routine and feed them into a host-based intrusion detection system. Both fileless malware and APTs are fast-growing intrusion strategies and you need to get ahead of these problems in order to protect the users and data on your system.
Do you monitor your WMI system? Have you discovered an APT operating through WMI and PowerShell? Did you find the intrusion difficult to get rid of? Have you found an IDS that includes WMI monitoring? Leave a message in the Comments section below to share your experiences with the community.
WMI monitoring FAQs
What is WMI Provider Host?
WMI Provider Host is implemented as a program called WmiPrvSE.exe. It is an operating system service that underpins all processes running in the Windows environment. Software running on the computer sometimes needs system information. WMI provider host acts as a messenger that receives these information requests and delivers responses. This service protects the operating system from potentially damaging actions.
How many WMI filters can be configured for a GPO?
Only one WMI filter can be configured per GPO. After creation, you can link this filter to multiple GPOs.
How do you find your Windows Management Instrumentation service?
To find the Windows Management Instrumentation service:
- Click on the Start menu and scroll down to Windows Administrative Tools. Click on this node to expand it.
- Click on the Services option. This will open a new window.
Scroll down the alphabetically ordered list of systems in the Services window to find the Window Management Instrumentation line.
