
Here is our list of the top network monitoring tools:
- NinjaOne RMM – Best for MSPs needing cloud-based network and endpoint management
- Progress WhatsUp Gold – Best for organizations with complex multi-site infrastructures
- AdRem NetCrunch – Best for ease of use for small businesses
- ManageEngine OpManager – Best choice for Linux users
- Atera – Best for large and small IT teams and MSPs who need an all-in-one IT management solution
- SuperOps – Best for MSPs that need to choose between RMM and PSA options
- Obkio – Best for operators of VoIP and video streaming
- Site24x7 Network Monitoring – Best for monitoring web applications and sites
- ManageEngine OpManager Nexus – Best for unified observability across your entire stack
- Datadog Network Monitoring – Best for centralized data centers
- Domotz – Best for MSPs and multiple site monitoring
- ExtraHop Reveal(x) – Best for mid and large sized companies that need a more complex solution
- AKIPS – Best for users who monitor a single network
- SolarWinds Network Performance Monitor – Best for teams looking for automated network configuration monitoring
- Fortra’s Intermapper – Best free tool with basic features plus paid plans
- Zabbix – Best for businesses that need an open-source option for Linux systems
- Catchpoint Network Experience – Best for monitoring website performance, not networks
- Nagios Core – Best for businesses that need to create their own monitoring application
- Icinga – Best for network engineers with programming skills
What is network monitoring software?
Most network monitoring tools fall into two categories: device monitors and traffic monitors. This article focuses on device-monitoring solutions, often marketed as network performance monitors. These rely on the Simple Network Management Protocol (SNMP), a long-established standard built into nearly all network hardware and major operating systems.
SNMP uses two components: a central SNMP Manager and lightweight agents installed on each device. Hardware is typically shipped with an agent already in place, and operating systems such as Windows, Linux, and macOS include one that can be enabled. The missing piece on most networks is the SNMP Manager role, which the monitoring software assumes.
Each agent continually gathers information about its host device and stores it in a Management Information Base (MIB). When the SNMP Manager broadcasts a request, every agent replies with its MIB, allowing the monitor to identify all connected devices, their hardware details, operating systems, and addresses. Because each switch or router interface reports what it’s connected to, the monitoring tool can automatically build a topology map and maintain an accurate hardware inventory.
SNMP also supports proactive alerts. If an agent detects a fault, it can immediately send an unsolicited update, known as an SNMP Trap, so the monitoring system can flag the issue without waiting for a scheduled poll. This automation allows IT teams to focus on problems as they occur rather than manually checking device status.
Features to look for in network monitoring tools
Network monitoring software has different features and capabilities. Here are some of the key things to look out for before making a purchase:
- Real-time performance and availability monitoring
- Traffic and bandwidth analysis (SNMP, flow, packet-based)
- Security monitoring & anomaly detection
- Cloud and hybrid visibility (AWS, Azure, GCP, SaaS apps)
- Alerting, escalation, and integrations (Slack, Teams, PagerDuty, etc.)
- Custom dashboards and reporting
- Scalability (multi-site, multi-tenant, distributed agents)
Network monitoring tools compared
We’ve compared the most important features of the best network monitoring software. Prefer to read the in-depth reviews? Start with Auvik – our #1 choice.
Product/Features | Auvik | Paessler PRTG Network Monitor | Checkmk | NinjaOne RMM | Progress WhatsUp | AdRem NetCrunch | ManageEngine OpManager | Atera | SuperOps | Obkio | Site24x7 | ManageEngine OpManager Nexus |
|---|---|---|---|---|---|---|---|---|---|---|---|---|
| SNMP Data | Yes | Yes | Yes | Yes | Yes | Yes | Yes | Yes | Yes | Yes | Yes | Yes |
| Autodiscovery | Yes Collectors | Yes | Yes | Yes | Yes | Yes | Yes | Yes | Yes | Yes | Yes | Yes - Advanced |
| Network Mapping | Yes | Yes Automatic & Interactive | Yes Automated | Yes Automated | Yes Automated & Custom | Yes Automatic | Yes Automated & Custom | Yes | Yes - via Asset Discovery | Yes - Dynamic Monitoring Agent paths | Yes Automated | Yes Automated, Layer 2/3, Custom, 3D views |
| Alerts | Yes | Yes Automatic & Thresholds | Yes Device level | Yes By Default & Custom | Yes Email, SMS, Integrations | Yes Manual Setup | Yes Notification profiles | Yes | Yes | Yes | Yes | Yes Automatic & Thresholds, Adaptive |
| SaaS/On-Premises | SaaS | On-premises, SaaS available | On-premises, SaaS available | SaaS | On-premises | Hybrid | On-premises | SaaS | SaaS | SaaS | SaaS | On-premises, SaaS |
| OS | Cloud-based | Windows Server | Linux, Cloud-based, Virtual or Phisical appliance | Cloud-based | Windows Server | Window Server | Linux, Windows Server, Azure, and AWS | Cloud-based | Cloud-based | Cloud-based | Cloud-based | Windows Server, Linux (with cloud/hybrid options) |
| Free Trial Period | 14-days | 30-days | 30-days | 14-days | 30-days | 30-days | 30-days | 30-days | 14-days | 14-days | 30-days | 30-days |
Our network monitoring software testing methodology
We’ve broken down our analysis for you based on these key criteria:
- An autodiscovery system to log all network devices
- A network topology mapper
- The ability to collect live network device statuses by using SNMP
- A facility to analyze network performance over time
- Graphical interpretation of data, such as charts and graphs
- A free trial period, a demo, or a money-back guarantee for a no-risk assessment
- A good price that reflects value for money when compared to the functions offered
The tools I reviewed include a combination of free, paid, and open-source software for Windows, Mac, and Linux.
If you’re only interested in free home networking monitoring software, click the link to check out our list for Windows, Mac and Linux.
The best network monitoring tools
As part of our comparison I’ve looked out for important network management platform features such as SNMP, network mapping, uptime/downtime, alerting, bandwidth monitoring, network health, dashboards, and more to highlight tools with an exceptional user experience.
1. Auvik (FREE TRIAL)
Tested on: Cloud/SaaS

Auvik is a cloud-based network monitoring system that includes several system management tools. The package is accessed through a Web browser, and when you open an account, the setup process installs collectors on your system. The Auvik package is able to monitor multiple sites and centralize their control. This makes the package ideal for monitoring a WAN.
The service provided by Auvik begins with a network discovery process. This automatically populates all of the base information needed for the monitor to work. The discovery service is continuous, so it will spot when new devices are added to the network.
Key Features:
- Automated Setup: Our findings show that Auvik automated setup process simplifies the initial configuration and deployment of the monitoring system.
- Network Mapping: The platform offers network mapping capabilities, allowing users to visualize the layout and connections within their network infrastructure.
- Resource Utilization Alerts: Auvik includes resource utilization alerts, enabling proactive identification of issues related to network resource usage.
- Configuration Management: Users can manage and control the configurations of network devices efficiently.
Unique Feature
Auvik’s automated network mapping provides a visual representation of the network infrastructure, which includes devices, connections, topology, network traffic and configuration history. Network administrators find its color-coded status indicators particularly helpful.
Why do we recommend it?
The great feature of Auvik that I found is that its higher plan provides both traffic analysis and network device performance monitoring. From its cloud location, this package can watch over multiple sites, providing alerts that buy time to head off system disasters.
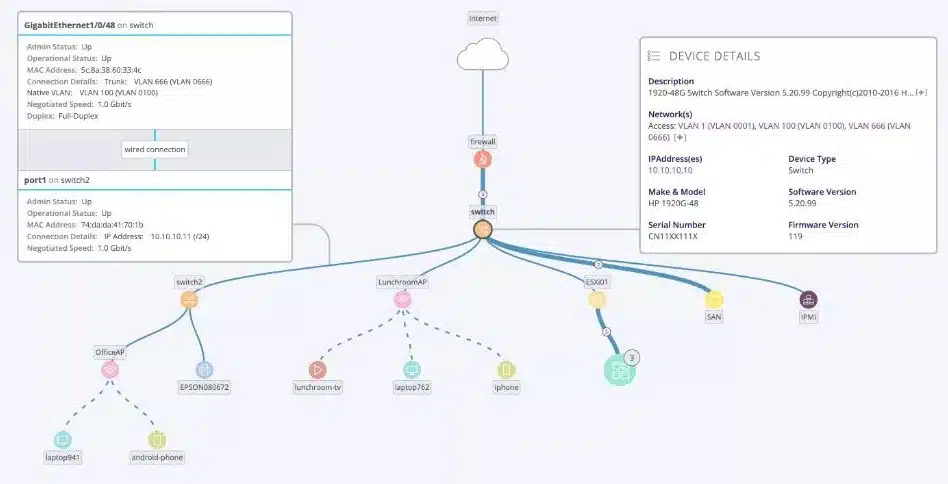
You can drill down on each device on the map and explore its connectivity as a cloud-based system
Auvik is designed for remote system monitoring – even your home network is remote to the processes on the Auvik servers. Network monitoring works on a system of thresholds. The service tracks a list of metrics on network activity and a threshold for resource usage or system performance is added to each of these conditions. If that threshold level is passed, the Auvik service will generate an alert. This means that your team of technicians doesn’t need to pay attention to the network unless a problem arises.
The Auvik service can be expanded through the use of third-party tools for which the network monitor has integrations. There are two plan levels for Auvik – Essential and Performance. The Performance plan is the higher plan and it offers traffic analysis functions and Syslog management on top of the network monitoring services that are available in the Essentials plan.
Who is it recommended for?
I feel that multi-site businesses would benefit most from the Auvik service. This network monitoring package enables you to centralize system management in one location.
Pros:
- Monitoring Across Multiple Networks and Sites: Auvik’s monitoring package can monitor multiple networks across different sites and unify the data, providing a centralized view of the entire network infrastructure.
- Accessible Anywhere: The console is browser-based, providing flexibility in access from anywhere with an internet connection, enhancing remote management capabilities.
- Automated System Asset Inventory Management: Auvik automates the creation and maintenance of system asset inventory, simplifying the tracking and management of network devices.
Cons:
- Single-Package Offering: This lack of variety might limit the options for users who require additional or specialized functionalities beyond what Auvik provides in its core package.
Auvik doesn’t publish its prices. Your buyer’s journey begins by requesting a 14-day free trial and seeking a quote.
2. Paessler PRTG Network Monitor (FREE TRIAL)
Tested on: Windows Server
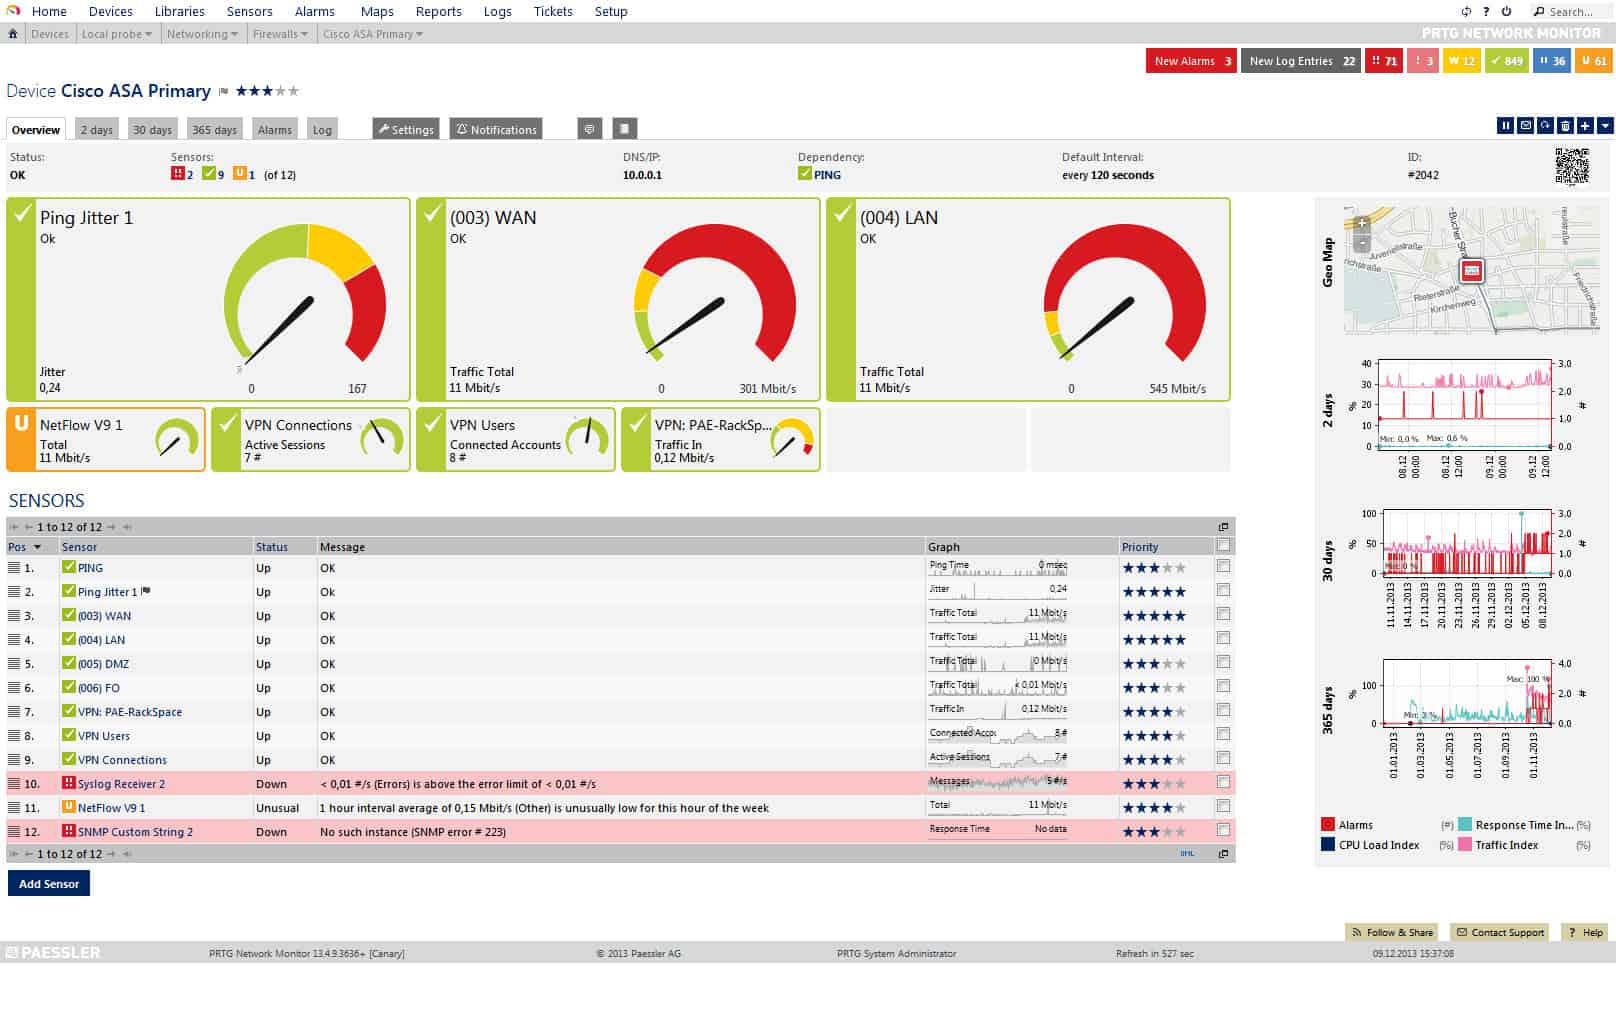
PRTG’s characteristic gauge-style visualizations have become a mainstay for network administrators.
PRTG Network Monitor from Paessler is a free network monitoring suite that uses SNMP, packet sniffing, and WMI to monitor your network. Scan network segments to discover and add devices to monitor. You can choose between a range of sensors to monitor various segments of your network. Each sensor monitors an individual value in your network, for instance, there are Bandwidth Monitoring Sensors, Hardware Parameters Sensors, network data usage meters, SNMP sensors, VOIP and QoS sensors, and more.
Key Features:
- SNMP Monitoring: PRTG SNMP monitoring allows for the collection of performance data from SNMP-enabled network devices.
- Bandwidth Monitoring: The platform includes bandwidth monitoring capabilities, enabling the tracking and analysis of network bandwidth usage.
- IP Segment Device Discovery: PRTG allows for the scanning of network devices by IP segment, simplifying the process of discovering and adding devices to the monitoring system.
- Threshold-Based Alerts System: PRTG features a threshold-based alerts system, notifying administrators when specific conditions or thresholds are met.
- Customizable Network Maps: Customizable network maps provide visual representations of the network topology tailored to the user’s preferences.
- Supports Freeware Version: PRTG offers a freeware version, allowing users to experience and utilize the basic functionalities at no cost.
Unique Feature
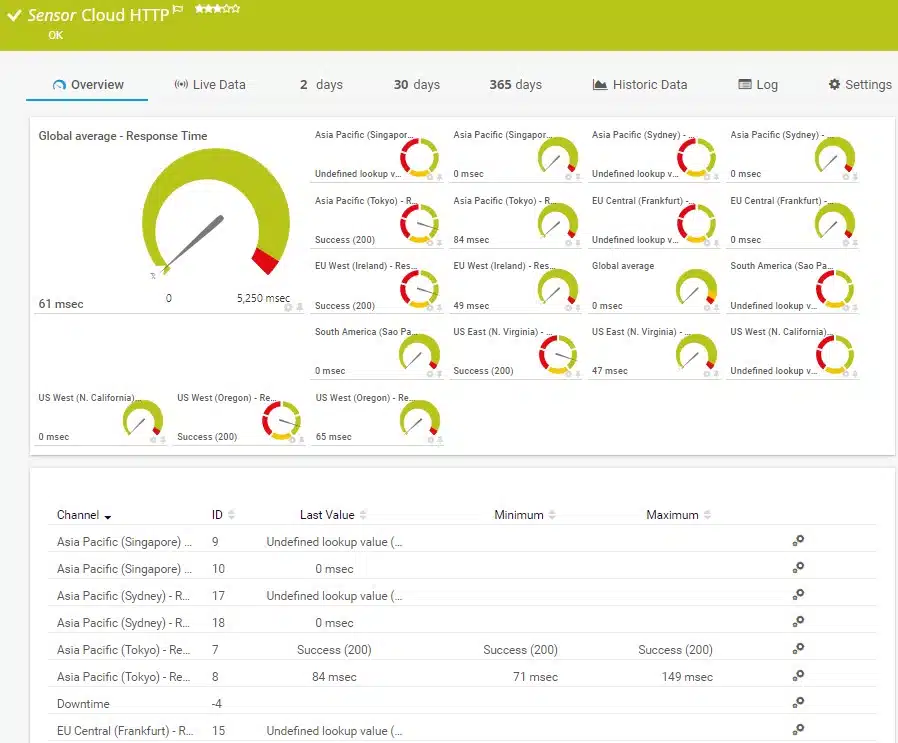
Of the on-premises packages on this list, I found that PRTG is probably the best option for response time monitoring for websites. The PRTG system includes a Web Page Sensor for recording the load times of pages. You can use it on demand or set it to run on a schedule. I also found that the bundle includes a Ping-based availability monitor for websites. The website monitoring sensors can all be included in the free edition of the PRTG system.
The dials indicate how close each device and process is to its maximum capacity.
Why do we recommend it?
Paessler PRTG is a very flexible service. You can choose which sensors to turn on and create your own tailored monitoring system for networks, servers, and applications.
I was impressed with the great visualization, the tool has a customizable dashboard that allowed me to produce real-time network maps of our infrastructure. You can create maps with the drag-and-drop editor and use over 300 map objects to build the map. You can even create your own map objects with custom HTML.
The threshold-based alerts system keeps you updated if the status of a sensor changes, a value changes or a threshold is breached. Notifications are available in a variety of formats including email, push notification, SMS, Slack message, Syslog message, SNMP trap, HTTP action, execute program, and more.
Who is it recommended for?
The comprehensive nature of PRTG provides extensive monitoring for all categories of IT systems, which makes this a good choice for large organizations. However, the free option, which is limited to 100 sensors, is very appealing to small businesses.
Pros:
- Multi-Protocol Data Collection: PRTG utilizes a combination of packet sniffing, WMI, and SNMP to report network performance data, providing a comprehensive view.
- Fully Customizable Dashboard: The fully customizable dashboard is suitable for both lone administrators and NOC teams, offering flexibility in displaying relevant information.
- Application-Specific Sensors: PRTG provides pre-built sensors designed for monitoring specific applications, such as sensors for capturing and monitoring VoIP activity.
Cons:
- Learning Curve: The many features of PRTG may require time for administrators to learn and fully utilize all aspects of the system.
PRTG Network Monitor is a must-try for enterprises looking for cost-effective but comprehensive network monitoring tools. The platform is available for free for less than 100 sensors, after which you have to pay. Paid versions start at $1,600 (~£1,335) for 500 sensors and 1 server installation. The software for PRTG runs on Windows Server and you can get it on 30-day free trial.
Related post: Paessler PRTG Network Monitor – Full Review
3. Checkmk (FREE TRIAL)
Tested on: Linux Server & SaaS Cloud

Visually identify stress points over different time scales
Checkmk provides comprehensive network monitoring across LAN and wireless networks, including servers, switches, routers, and firewalls. It supports a wide range of devices and vendors, including less common or niche solutions. Its monitoring scope extends beyond the network layer, allowing end-to-end visibility across the entire IT stack. The Checkmk observability platform is available both as an on-premises installation and as a SaaS solution, giving teams flexibility in how they deploy it.
Key Features:
- Full-Stack IT Monitoring: Covers LAN and wireless networks, servers, containers, cloud services, and application performance.
- Automated Network Discovery: Automatically detects network devices and adds them to the monitoring system together with relevant metrics, eliminating manual tuning.
- Threshold-Based Alerting: Applies predefined, host-specific metric thresholds during discovery to enable immediate visibility and reduce alert noise.
- Rules-Based Configuration: Uses user-defined rules to automate the configuration of new hosts, with changes propagating consistently across similar devices, saving significant time when monitoring large networks.
- Switch Port Usage: Provides real-time insights into switch port status—showing which ports are active, which are down, and their current communication speeds.
- Bandwidth Monitoring: Offers detailed usage metrics and visualizations to identify traffic patterns and spikes, with configurable thresholds for ports or port groups to trigger alerts.
Unique feature
Checkmk stands out due to its automated service discovery for infrastructure monitoring simplifying the initial setup and any ongoing management. When you connect Checkmk to a server, it automatically detects the server’s operating system and the services running on it, and then suggests appropriate checks along with predefined alerting thresholds. Continuous discovery scans ensure that changes in your infrastructure are quickly detected, with new or modified services automatically incorporated into monitoring.

Warnings are suggested through frequent discovery scanning
Why do we recommend it?
Checkmk is a monitoring and observability platform suited to mid-size and large enterprises that require more than basic network visibility. The platform detects both actual and hidden performance issues that may affect IT infrastructure performance. Topology graphs and built-in dashboards with drill-down capabilities visualize network components and their relationships, trace impact paths, and, together with AI-assisted root cause analysis, help identify the root cause quickly.
On testing, the system began by automatically scanning the network to identify all connected devices. It then compiled a comprehensive device inventory, which formed the basis for the fully configured out-of-the-box network monitoring status dashboard.
Checkmk monitors network devices such as switches, routers, and firewalls by communicating with them via SNMP, and collects data from agents installed directly on servers . The collected performance data get compiled into live reports on network health, readiness, and capacity performance.
The strong point of Checkmk is its smart alerting functionality, which cuts out most unnecessary alerts from the start. It uses predefined thresholds and logic to focus on real performance issues rather than minor fluctuations. Escalations can be automated, including ticket creation in ITSM systems, and notifications can be routed to the right team via SMS, email, Slack, or Teams.
Who is it recommended for?
Checkmk is the ideal choice for mid-size and large enterprises managing hybrid or multi-site environments. It is particularly well suited for teams that have outgrown simpler monitoring tools and need to handle increasing IT infrastructure complexity and monitoring demands.
Pros:
- Flexible Deployment Options: Checkmk can be deployed on-premises or as a SaaS solution. Commercial editions also support container-based deployment and appliances (virtual or physical).
- Broad and Deep Network Visibility: Supports monitoring of a wide range of network devices through more than 2,000 vendor-maintained integrations, as well as an API for custom extensions.
- Cost-Effective: Considered suitable for small to medium-sized businesses as well as enterprises aiming to optimize their total cost of IT monitoring
- Integrated Server and Application Performance Monitoring: This provides a unified view of the entire IT environment.
Cons:
- Derived from Nagios Core: While this might not necessarily be a disadvantage, it could be perceived as a drawback for those who have specific preferences for Nagios Core itself.
Checkmk comes in several editions to better match different infrastructure types and levels of complexity. Checkmk Community is a free and open-source IT monitoring platform for small to mid-sized infrastructures. Checkmk Pro offers scalable enterprise-wide IT monitoring, designed for medium to large enterprises seeking advanced monitoring, automation, and reporting capabilities.The more advanced Checkmk Ultimate edition is designed for hybrid and cloud-native infrastructures, delivering full-stack observability across infrastructure and applications. Service providers can use Checkmk Ultimate with multi-tenancy and data segregation to monitor their customers’ hybrid and distributed IT environments. Checkmk is priced on a sliding scale, based on the number of hosts in the monitored environment and the type of infrastructure—such as local data centers or hybrid cloud setups.There is a 30-day free trial available for Checkmk commercial editions to get started and evaluate the platform. Checkmk can be tested for free, making it easy for teams to evaluate the platform’s full capabilities before committing.
Related post: Network Configuration Management Software
4. NinjaOne RMM (FREE TRIAL)
Tested on: Cloud/SaaS
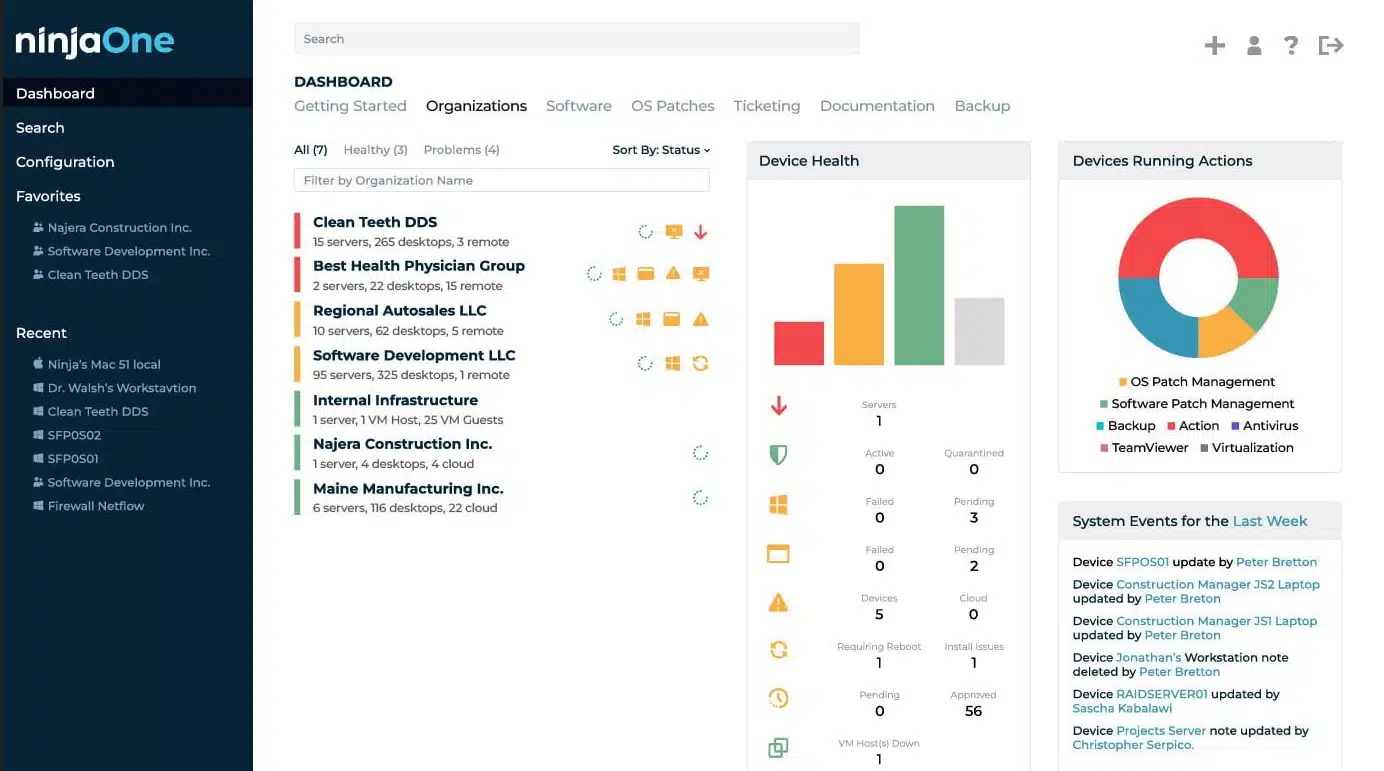
Problem areas of the network are color-coded and easy to see
NinjaOne RMM provides remote monitoring and management services from a cloud platform. This system can be accessed from anywhere through any standard Web browser, so your business doesn’t need any special equipment or even servers to administer multiple remote networks.
Key Features:
- Autodiscovery: NinjaOne auto discovery capabilities simplifies the process of identifying and adding devices to the network.
- Device Status Monitoring: NinjaOne device status monitoring offers real-time insights into the health and performance of network devices.
- Traffic Analysis: NinjaOne features traffic analysis, allowing users to analyze the throughput and patterns of network traffic.
Unique feature
The RMM is a multi-tenanted package for use by managed service providers. The MSP creates a separate sub-account for each client, keeping the data of each client’s services separate. Each client can also have several sites enrolled in the monitoring package.
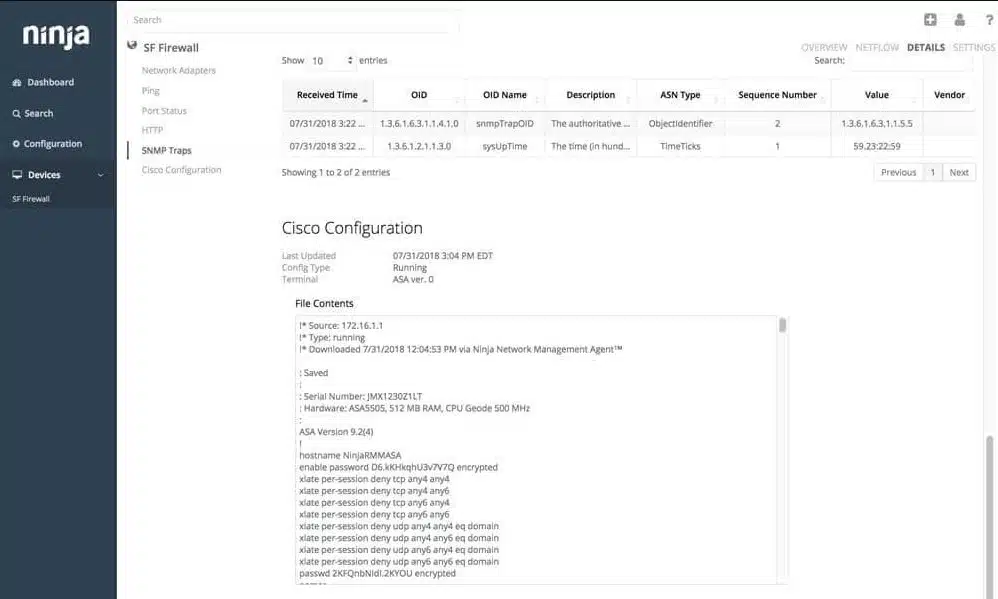
You can drill down to the device’s IP address and file level
Why do we recommend it?
NinjaOne RMM optimizes the productivity of your IT support technicians. Alerts in the package mean that no one needs to sit and watch the activity on each remote site because the technical team will be notified if a problem arises. The system checks for network device availability and tracks traffic throughput volumes.
When an MSP has a new client to monitor, a technician needs to install a NinjaOne agent on a computer connected to the remote network. This agent sends out requests for network service status reports and then forwards the received data to the NinjaOne server.
Those device reports reveal what equipment is on the network. On testing, NinjaOne RMM compiled a hardware inventory from that information. As well as reference information, the tool brought back live device activity data, which it displayed in the dashboard. Those reports contain more data sets than the console can display and we got the opportunity to customize the dashboard to choose the metrics that you believe are important.
Each of the gathered statistics can have performance thresholds placed on them and when these levels are crossed, the system triggers an alert. The RMM also collects traffic through data using the NetFlow, J-Flow, sFlow, and IPFIX protocols. These statistics can also have alert thresholds placed on them.
Who is it recommended for?
The NinjaOne RMM is designed for use by managed service providers. However, there is nothing to stop IT departments from using the platform for in-house monitoring. We found that the tool can monitor multiple sites simultaneously and it also includes endpoint monitoring and management systems, such as a patch manager.
Pros:
- Simultaneous Monitoring of Multiple Sites: NinjaOne RMM allows for the simultaneous monitoring of multiple sites, providing a centralized view of network performance across different locations.
- Sub-Accounts for Data Separation: The platform supports sub-accounts, enabling the separation of data for each client.
- Traffic Throughput Analysis: The traffic throughput analysis gives users insights into the volume and patterns of data flow within the network.
Cons:
- No Public Price List, Custom Quotes Required: While this allows for tailored pricing based on specific needs, some users may prefer transparent pricing information upfront.
G2’s 11-time consecutive acknowledgment placed NinjaOne atop in RMM, Patch Management, and Endpoint Management. You can get a custom quote for NinjaOne based on your needs. You can start by registering for a 14-day free trial.
5. Progress WhatsUp Gold (FREE TRIAL)
Tested on: Windows Server
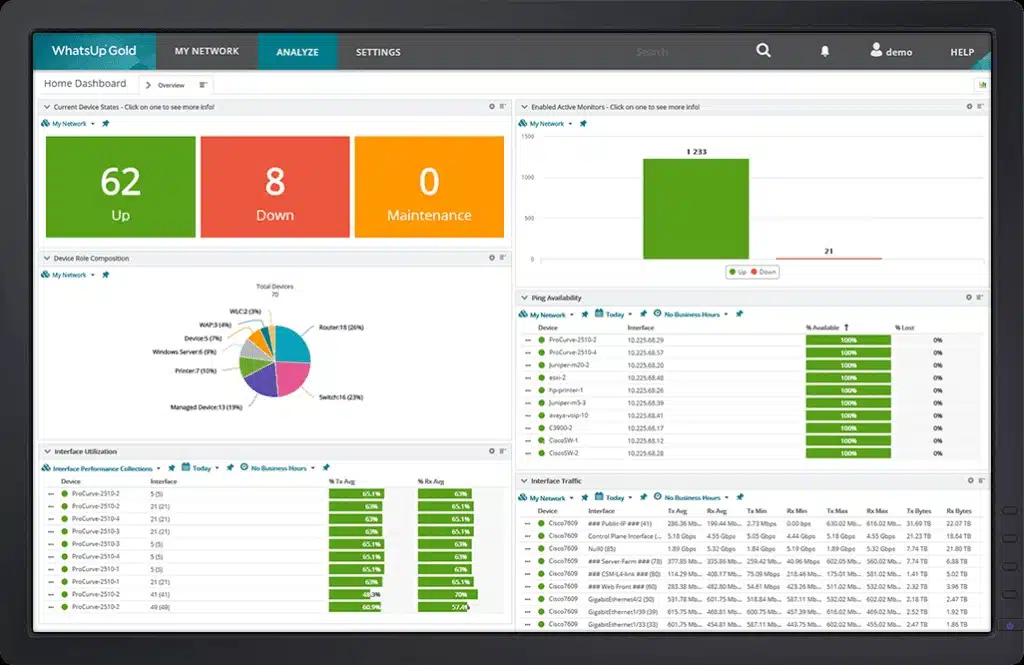
Progress WhatsUp Gold is a network monitoring system designed to give businesses clearer visibility into network infrastructure through an interface that is straightforward to work with. Using SNMP-based monitoring, it delivers live performance data on network devices and can also extend oversight to servers and applications. By keeping watch on device condition and performance, the platform helps teams maintain uptime and keep the network running properly.
Key Features:
- Real-Time Monitoring: Keeps network devices under continuous watch so performance problems can be detected immediately.
- Customizable Dashboards: Lets users build dashboards around the metrics they want to follow most closely.
- Automated Device Discovery: Finds and maps devices across the network automatically.

Why do we recommend it?
Progress WhatsUp Gold gives teams detailed dashboards that can be tailored to show the condition of the network in one view. It also provides alerts and reporting that help administrators stay ahead of outages and performance issues instead of reacting after service has already been affected.
The core package is deployed through autodiscovery, which documents the environment, maps connected devices, and then moves straight into ongoing monitoring. Much of the work is automated, so administrators do not need to sit watching the console constantly. When something needs attention, the system raises an alert and sends a notification so technicians can step in.
Once the base monitoring service is in place, buyers can extend it with other Progress modules. These plug into the same console and add monitoring for network traffic, servers, applications, and virtual environments.
Who is it recommended for?
This package is well suited to network administrators and IT teams in businesses of different sizes that need broad network monitoring, fast problem detection, and dashboards they can tailor to their environment. It is especially useful in organizations with more complex or multi-site infrastructures that need proactive alerting, detailed reporting, and integration with other IT tools.
Pros:
- Uses SNMP: The platform relies on the standard monitoring technology already present on network devices.
- Comprehensive Alerting System: Sends notifications for outages, performance degradation, and threshold breaches.
- Suitable for Mixed Media Networks: Covers wireless environments as well as traditional LANs.
Cons:
- No Cloud Version: This is an on-premises product for Windows Server.
Progress WhatsUp Gold runs on Windows Server and is straightforward to install and use. You can try the platform through a 30-day free trial.
6. AdRem NetCrunch (FREE TRIAL)
Tested on: Windows Server
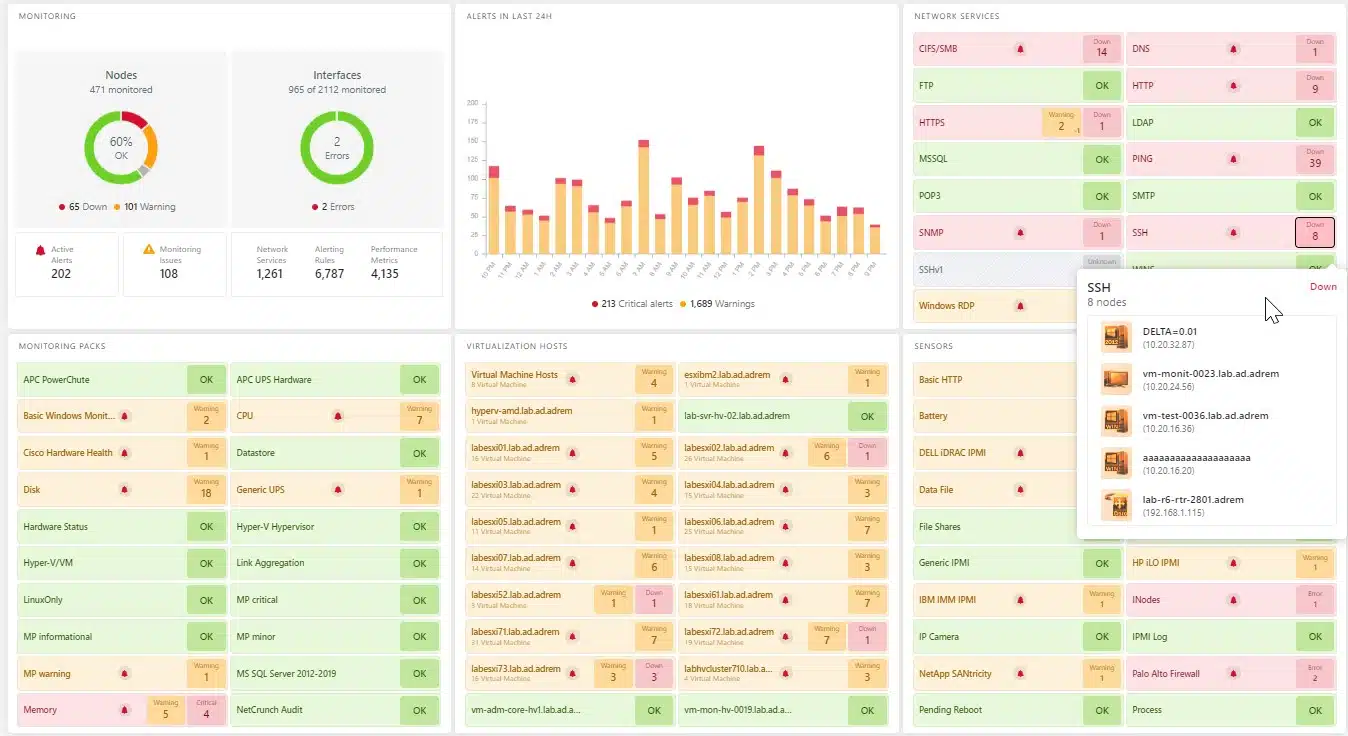
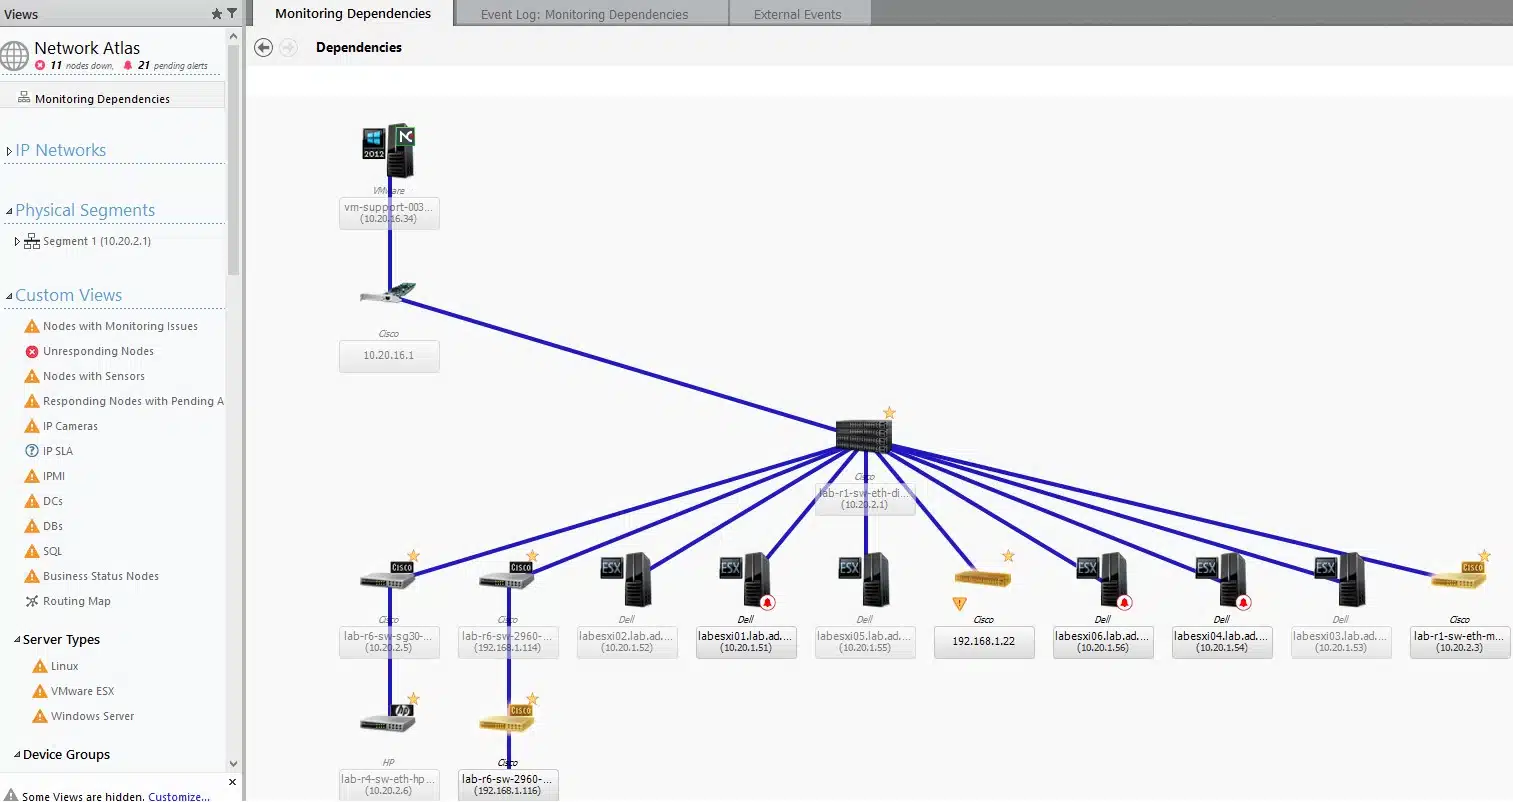
AdRem NetCrunch provides monitoring services to watch over networks, endpoints, and software. This is an on-premises software package and it is able to reach across your network to examine all endpoints, not just the host of the package. The service includes a network discovery routine that discovers all devices, writes up a hardware inventory, and generates a network topology map.
Key Features:
- System discovery: Scanning repeats and automatically updates documentation
- Network inventory and topology map: Provides a view of the network and all the devices on it
- Live performance monitoring: Examines network services as well as devices
Why do we recommend it?
One of the key selling points of AdRem NetCrunch is its ease of use. After installing the software, the user just needs to follow a simple setup guide and then the tool will search your network and populate all of its tables itself. The network map acts as an index for device detail views and alerts let you know when a system component develops a problem.
Although NetCrunch is able to monitor servers and cloud services, its main feature is its network monitoring system. The tool’s alerting mechanism comes with pre-written rules. A rule is a chain of actions that starts with data collection – this is the monitoring part of the process. Each measurement is compared to a range of acceptable values. If the statistic is outside the range, NetCrunch generates an alert.
The alerts of the NetCrunch system appear in the console and you can set up the service to forward those warnings as notifications to specific people in your team. Those messages can be sent by email, Slack, SMS, Teams, or other collaboration systems. The tool can also feed tickets into your project management system, such as Jira or Service Desk routing package, such as Trello, Zendesk, or Asana.
Alerts can also be set up to trigger actions, which creates a mechanism for automatic problem remediation. This possibility is very powerful but takes some planning and you probably won’t get into that capability until you have become an expert user of the NetCrunch system. Alerts can be customized and triggered by a series of conditions.
Who is it recommended for?
This package is suitable for any type of size of business. It is able to monitor virtual systems, such as VMware or Hyper-V and it will also watch the response times of your cloud services and the connections to them. The ease of use of this package makes it particularly appealing for small businesses and startups that might not have a big technical support team on the payroll.
Pros:
- Automated system monitoring: Alerts remove the need to actively watch system performance
- Observability for hybrid environments: Monitors cloud-based systems as well as on-premises assets
- Response automation: Feed notifications into your Service Desk tool and set up automated responses triggered by alerts
Cons:
- Only available for Windows Server: No version for Linux and no SaaS option
There are three editions of the NetCrunch package, which makes the system suitable for all sizes of businesses. There are Essentials, which provides SNMP-based device monitoring, Professional, which adds on server and VM monitoring, and Enterprise, which also gives you traffic monitoring and cloud service tracking. You can assess AdRem NetCrunch with a 30-day free trial.
7. ManageEngine OpManager (FREE TRIAL)
Tested on: Linux and Azure

This customizable dashboard allows you to focus on your unique areas of interest
ManageEngine OpManager is a network monitoring solution that can monitor the performance of network devices, servers, routers, switches, and virtual machines in real-time. Customizable dashboards provide over 200 widgets for you to create a unique monitoring experience.
Key Features:
- Automatic Discovery: The OpManager automatic discovery capabilities streamlines the process of identifying and adding new devices to the network.
- Network Mapping: The network mapping feature allows users to visualize the layout and connections within their network infrastructure.
- SNMP Monitoring: OpManager supports SNMP monitoring, enabling the collection of performance data from SNMP-enabled devices.
Unique Feature
Unlike the other on-premises network monitoring tools on this list, OpManager isn’t limited to network hardware tracking because it also monitors servers. The server monitoring facilities in the OpManager system record important resource metrics such as CPU, memory, and disk capacity and utilization.
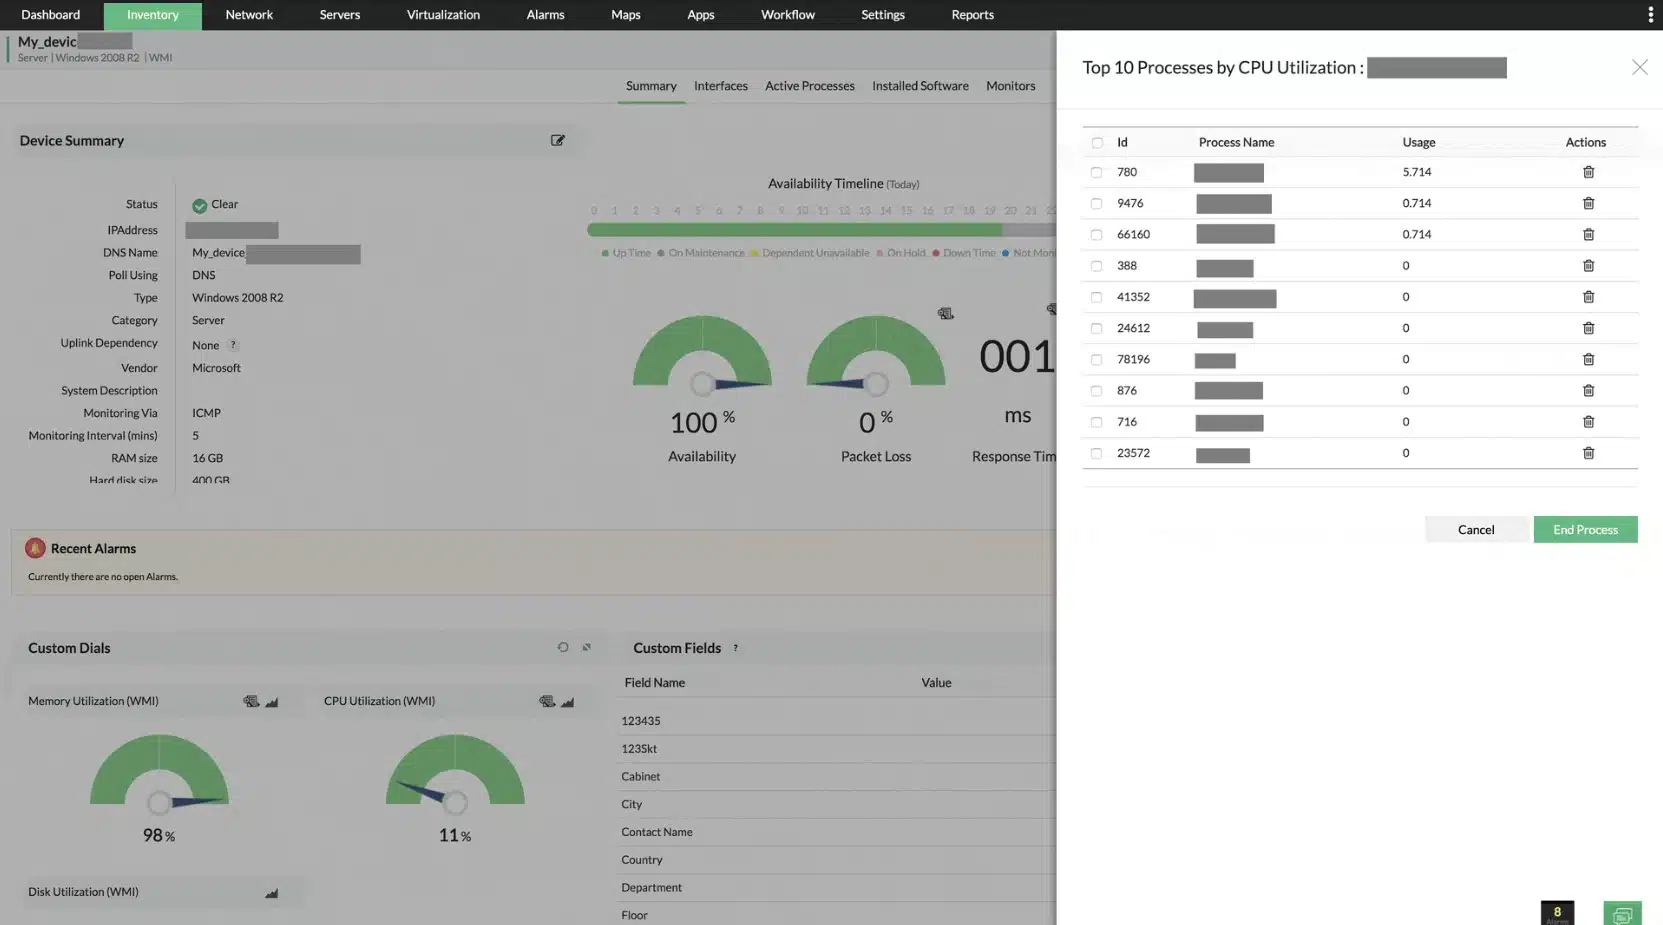
An intuitive visualization of server loads
Why do we recommend it?
The ManageEngine OpManager system is one of the few detailed network monitoring systems that offers a graphical user interface for Linux. While most Linux network monitors are command-line systems, the high-quality graphs and charts of OpManager make status recognition easy.
SNMP monitoring keeps you updated on the performance of devices within your network. For increased visibility, you can use the network mapping feature to automatically discover and map new devices. You can schedule network discovery to find new devices once they’re added to your network.
We tested the alerts system which helps you to respond to performance changes quickly. It worked flawlessly. ManageEngine OpManager correlates network events and only presents relevant alerts to the user while minimizing false positives. The program sends alerts by email and SMS to keep you updated on any emerging problems.
ManageEngine OpManager is an all-in-one network monitor that is recommended for users that want a simple infrastructure monitoring tool.
Who is it recommended for?
This software package installs on Linux, Windows Server, Azure, and AWS. Although it works well on all these platforms, of all the network monitoring systems designed to run on Linux, ManageEngine OpManager is considered to be the best option.
Pros:
- Unique Dashboards and Reports: provides over 200 customizable widgets for building unique dashboards and reports, providing flexibility to users.
- Reduced False Positives: OpManager uses intelligent alerting to reduce false positives and eliminate alert fatigue.
- Integration within the ManageEngine Ecosystem: OpManager integrates well with other products in the ManageEngine ecosystem, enhancing its functionality and compatibility with other IT management tools.
Cons:
- Learning Curve: OpManager is a feature-rich tool, which may require a time investment to properly learn and utilize all its functionalities.
ManageEngine OpManager is an all-in-one network monitor that is recommended for users that want a simple infrastructure monitoring tool. Paid versions start at $245 (~£195) for 10-1,000 devices up to $11,545 (~£9,000 for 250-10,000 devices. You can download the 30-day free trial.
Related post: ManageEngine OpManager – Full Review
8. Atera (FREE TRIAL)

Atera is a comprehensive remote monitoring and management (RMM) system designed primarily for IT service providers and managed service providers (MSPs). It combines powerful monitoring tools with remote management features to provide a holistic solution for maintaining and optimizing IT environments. With its cloud-based platform, Atera enables users to efficiently oversee their networks, detect issues, and implement solutions in real-time.
Key Features:
- Real-Time Monitoring: Provides constant visibility into network performance and device health, alerting users to issues as they arise.
- Automated Alerts: Customizable notifications for critical events ensure that users can respond promptly to network anomalies.
- Remote Management: Enables remote access to devices for troubleshooting and maintenance, reducing downtime and enhancing service efficiency.
Unique feature
Atera’s integrated billing and invoicing system allows MSPs to manage their financials alongside network monitoring, streamlining operations and ensuring accurate billing for services rendered. This feature enhances operational efficiency and helps users maintain clear financial oversight.
Why do we recommend it?
Atera’s all-in-one platform combines robust network monitoring with powerful remote management capabilities, making it ideal for IT professionals. Its user-friendly interface and integrated billing functions simplify operations, allowing teams to focus on delivering high-quality service.

Atera provides a network discovery add-on, automatically identifying devices and services within the network. This feature enables IT professionals to gain an accurate view of their infrastructure, facilitating proactive management and quick identification of unauthorized devices. The intuitive interface makes it easy to visualize the network topology, helping teams understand their environment better.
In terms of security features, Atera provides tools to monitor network vulnerabilities and ensure compliance with industry standards. Regular scans help detect potential threats, and automated alerts notify users of any security breaches or anomalies. This proactive approach empowers organizations to mitigate risks effectively and safeguard their network assets.
Atera’s capabilities extend beyond network monitoring; it integrates various IT management tools into a single platform. Users benefit from a ticketing system, customer relationship management (CRM), and automated workflows, creating a cohesive environment for IT operations. This integration not only improves efficiency but also enhances collaboration among team members, making it easier to deliver exceptional service to clients.
Who is it recommended for?
Atera is recommended for IT service providers, managed service providers (MSPs), and organizations seeking an all-in-one solution for network monitoring and management. Its powerful features cater to both small businesses and larger enterprises looking to optimize their IT operations.
Pros:
- Reporting Tools: Comprehensive reporting features allow users to analyze network performance and resource utilization over time.
- Asset Management: Automatically tracks hardware and software assets, providing insights into inventory and lifecycle management.
- Integrated Billing: Streamlines financial management alongside monitoring, improving operational efficiency.
- Workflow efficiency: Helps to streamline workflows and boost efficiency
Cons:
- Limited Customization: Certain aspects of the platform may not be customizable to the extent some users desire.
This cloud-based system includes all of the software that a managed service provider needs to operate, which includes network monitoring, and there are also plans for IT departments. Atera offers flexible subscription plans based on the number of technicians, with four plans for MSPs and four for IT departments. Plans include a variety of features, ensuring that users have access to essential tools for effective network management. Atera also provides a 30-day free trial, allowing prospective users to explore its capabilities without commitment.
9. SuperOps (FREE TRIAL)
Tested on: Cloud/SaaS
SuperOps is a cloud platform that offers system management tools, such as a remote monitoring and management package. That RMM includes a network monitoring unit that provides network discovery. The service generates a system inventory that forms the basis for automated monitoring routines.
Key Features:
- Designed for managed service providers: Has a multi-tenant architecture
- Network discovery: Identifies all devices that create the network
- Network topology map: Shows how devices connect together
Unique Feature
This package has a multi-tenant architecture, which means that MSPs can set up subaccounts on the platform. Each subaccount will hold the data of a single client of the MSP. So, the MSP can keep the data for each client completely separate.
Why do we recommend it?
The SuperOps system is a good choice to be on our list because it offers a suitable solution for managed service providers. Subscribers can opt for an RMM-only package or sign up for one of two packages that combine the RMM features with PSA functions. PSA systems provide the systems that MSP managers need to run their business.
The RMM includes a summary of all devices on the network and each entry in this list provides a link through to a details screen. The service provides automated monitoring because it will raise an alert if the network scanner identifies a problem with a network device. This means that technicians don’t have to watch the monitoring console to wait for problems.
The RMM is designed to enable one MSP technician to look after the system of multiple businesses. This efficiency is essential because it is the key feature that enables MSPs to undercut in-house IT departments and encourage companies to outsource their IT asset management.
The network monitoring service doesn’t just track switches, routers, and firewalls; it also lists endpoints, such as servers and workstations. The network monitoring service forms the basis for endpoint management features that include software license management and patching.
Who is it recommended for?
The SuperOps system is ideal for managed service providers. MSPs will be likely to take one of the combined packages that include both RMM and PSA systems. However, SuperOps also offers an RMM-only bundle. This edition is suitable for use by IT departments who need the system support tools in the RMM system but not the MSP management software that the PSA provides.
Pros:
- A cloud-based system: The console can be accessed from anywhere through any standard Web browser
- Multiple audiences: The RMM is suitable for IT departments as well as MSPs
- Full-stack observability: The RMM provides monitoring for all IT assets, not just networks
Cons:
- No on-premises package: You can’t download the software and run the RMM yourself
SuperOps is available in four editions: RMM only, PSA only, Pro Unified Basic, and Super Unified Advanced. You can try out the RMM package with its Network Monitoring unit by accessing a 14-day free trial.
10. Obkio (FREE TRIAL)
Tested on: SaaS

Operating from a cloud platform, Obkio reaches out to networks through the installation of local agents. It is able to test traffic patterns between agents, so the more agents you install, the more data points you will have. The package also implements device monitoring through the Simple Network Management Protocol (SNMP).
Key Features:
- Real-Time Network Monitoring: Continuously monitors network performance using distributed agents deployed across various network locations.
- Suitable for Hybrid Systems: Monitors (on-premise LANs, links to cloud services, and remote connections.
- Quality of Service Metrics: Insights into latency, packet loss, and jitter.

Why do we recommend it?
Obkio offers real-time, end-to-end network visibility, which is critical for businesses relying on distributed networks and cloud infrastructure. The platform’s ability to pinpoint issues across different locations makes it a highly efficient tool for network performance optimization. Additionally, its proactive alerting ensures that IT teams can address problems before they impact business operations.
The system is designed to give businesses deep insight into their network performance by using a distributed agent-based architecture. This enables continuous monitoring of network performance between different network segments, such as offices, data centers, and cloud services, ensuring that all network components are functioning optimally.
The platform is highly intuitive, making it accessible for both small IT teams and larger organizations. With features like automated alerting, historical performance tracking, and built-in diagnostic tools, Obkio offers a comprehensive solution to keep networks running smoothly and efficiently.
Who is it recommended for?
The four editions of Obkio make it accessible to all sizes of business. It can be used by managed service providers or IT departments for in-house monitoring. The system is particularly important for companies that operate VoIP and other interactive services, such as video streaming. The tool looks out for device problems and also examines links to other sites and cloud services.
Pros:
- Automated Alerts and Notifications: Sends alerts based on custom thresholds to notify administrators of potential performance issues before they escalate.
- Network Diagnostic Tools: Includes advanced diagnostic tools like traceroutes and speed tests to quickly identify and resolve network bottlenecks.
- Historical Data Analysis: Stores network performance data, for trend analysis, capacity planning, and troubleshooting.
Cons:
- No Network Management: Doesn’t include tools such as network configuration management.
Obkio provides four plan levels: Starter, Basic, Premium, and Enterprise each successively higher edition includes more services. You can get a 14-day free trial of the Premium edition.
11. Site24x7 Network Monitoring (FREE TRIAL)
Tested on: Cloud/SaaS

Network Alerts are prominently displayed and colour-coded.
The Site24x7 cloud-based network monitoring tool that covers IT infrastructure, applications, and user behavior. The network monitoring section of the tool is able to automatically discover all devices attached to the network. Site24x7 compiles an equipment inventory from the results of that search and then draws up network topology maps automatically. The inventory and maps all get updated automatically whenever equipment gets added, moved, or removed.
Key Features:
- All-in-One Solution: Comprehensive monitoring solution that covers networks, infrastructure, and real user monitoring within a single platform.
- Real-time Monitoring: Provides real-time monitoring for both applications and network devices, enabling quick identification and response to issues.
- Powerful Reporting, Analytics, and Alerts: Offers robust reporting and analytics tools for in-depth analysis of performance metrics and trends.
Unique feature
Each package of Site24x7 includes website monitoring tools that exceed basic connectivity and availability checks. The package also checks connections to cloud platforms. So, Site24x7 offers the monitoring of internet links as well as local networks.
A summary view of a device’s characteristics and status
Why do we recommend it?
The Site24x7 Network Monitoring service is bundled in with other monitors for servers, applications, and Web assets. You choose which services to track and set up performance thresholds that trigger alerts.
The autodiscovery feature of Site24x7 is driven by the Simple Network Management Protocol (SNMP). This system is built into all network devices. It just needs an SNMP manager to request status information from the agent software that is loaded onto every switch and router by their manufacturers. Site24x7 fulfills that SNMP manager.
SNMP includes a procedure that allows device agents to send a notification to the manager when it discovers a critical condition on the device that it is monitoring. This message gets converted into a warning or an alert by the Site24x7 dashboard, depending on the severity rating marked on the message from the agent.
Site24x7 monitors switches, routers, firewall appliances, power supplies, load balancers, wireless networks, cloud services, and WAN connections. It isn’t a bandwidth traffic monitor. The monitor focuses on connected hardware. A wider view of the Site24x7 package shows that the system also monitors other hardware, such as endpoints and servers. It also tracks the performance of applications. A user behavior module in the package is of particular use to businesses that run websites. It includes real user monitoring to analyze typical buyer journeys and also synthetic web transaction monitoring, which simulates access to a website.
Who is it recommended for?
The plans of Site24x7 are particularly strong on Web application monitoring and combine those services with network and connection testing services. Therefore, businesses that run websites would benefit from choosing this option.
Pros:
- Bridging Technical and Business Metrics: Real user monitoring capabilities help bridge the gap between technical issues, user behavior, and business metrics.
- Freeware Version: Provides a freeware version for testing, allowing users to explore the features and capabilities before committing to a full subscription.
Cons:
- Learning Curve: Like some other tools in its category, Site24x7 has a detailed platform that may require a significant amount of time to fully understand and utilize all features and options.
Site24x7 offers a free network monitoring service. However, this is just a straightforward Ping-based uptime monitor for up to 50 URLs or servers. The cloud platform offers a range of system monitoring and management tools and these are packaged in editions. There are five editions in total:
- Website Monitoring
- Infrastructure
- APM
- All-in-one
- MSP
All of these packages include the network monitoring service. Each of the Site24x7 plans is available on a 30-day free trial.
12. ManageEngine OpManager Nexus (FREE TRIAL)
Tested on: Windows & Linux

ManageEngine OpManager Nexus, formerly OpManager Plus, is well-suited for 360-degree visibility into your IT operations. This platform combines data from multiple sources and correlates them to provide meaningful insights about your environment. Its AI/ML algorithms help make sense of all that is happening in your environment, so you can make the right decisions and troubleshoot problems quickly.
Key Features:
- Application Performance Management: Uses distributed transaction tracing to monitor application-wide transactions and detect anomalies in your applications.
- Infrastructure Monitoring: Monitors and manages both physical and virtual servers, along with cloud providers and Kubernetes environments.
- Configuration Management: Manages the configuration of devices from 200+ vendors.
Unique Feature
OpManager Nexus gathers data from different network flow technologies and combines them with metrics from network devices to provide comprehensive views of your traffic patterns and bandwidth performance.

Why do we recommend it?
We recommend OpManager Nexus for the extensive and deep visibility it offers into every aspect of your network. Whether you want to monitor network devices, servers, bandwidth, applications, or storage devices, OpManager can handle it for you. More importantly, it combines data from all these components to provide a big picture of your environment.
All these analyzed metrics are displayed on intuitive dashboards, and you can further drill down into the specific ones to know more. As a result, you can have a better understanding of the root cause of problems, and even take proactive measures to fix issues before they cause widespread disruptions.
Who is it recommended for?
It is recommended for organizations with large and mixed environments. It is also a good choice for MSPs and organizations that have strict compliance requirements.
Pros:
- Unified Console: Offers centralized views of your environment in real-time.
- Security Coverage: Identifies any rogue devices in your network and blocks access to them.
- User Experience: Generates insights into your code, web transactions, user sessions, and AJAX calls to help improve user experience.
- AI/ML: Leverages AI and ML capabilities to improve performance and reduce downtime.
Cons:
- Learning Curve: Due to the sheer size of this tool, some users may face a learning curve.
The Professional edition costs $1,233 for 50 devices, while the Enterprise edition starts at $9,195 for 250 devices. Start a 30-day free trial.
13. Datadog Network Monitoring
Tested on: Cloud/SaaS

The network devices are color-coded for easily identifying problematic connections
Datadog Network Performance Monitoring is a cloud-based SaaS infrastructure monitoring service that examines network traffic flows. It is partnered by a Network Device Monitoring service, which focuses on the statuses of each device on the network, such as switches, routers, and appliances.
Key Features:
- Network Mapping and Protocol Analysis: This feature allows users to visualize the network structure and analyze communication protocols in real-time.
- Alerts on Performance Thresholds: The platform features alerts based on performance thresholds that are adjusted through machine learning, providing adaptive and intelligent alerting capabilities.
- Correlation with SNMP: Datadog correlates data from SNMP and other sources, providing a comprehensive view by combining information from multiple data streams.
Unique Feature
Datadog offers out-of-the-box integration with hundreds of popular services and platforms, ranging from web servers, databases, cloud services, and even specific software like Shopify and WordPress allowing teams to monitor and analyze data from different sources.
Why do we recommend it?
You can choose to subscribe to device monitoring, traffic monitoring, or both with this flexible package. The cloud location of Datadog Network Monitoring enables it to monitor any network anywhere in the world from one operations center.
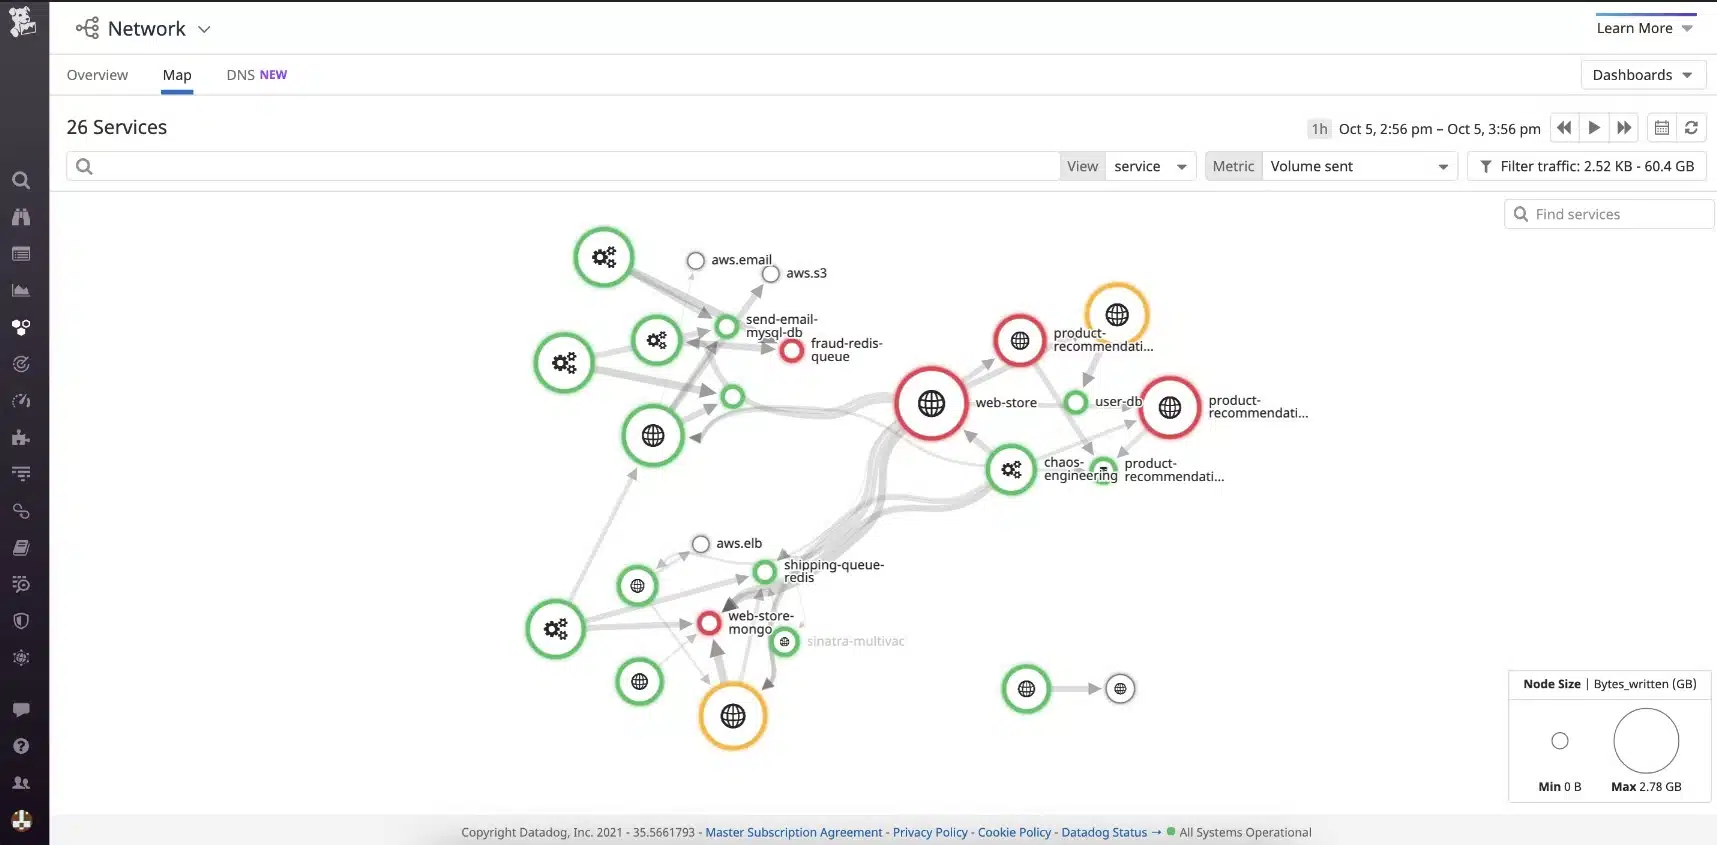
It is easy to identify the stressed connections that are adding load to the network.
The Network Performance Monitor is able to blend together the network monitoring effort for many sites and also include cloud resources. As a SaaS package, the service includes the processor to run the monitoring software and storage space for gathered statistics. As well as displaying live statuses, this network monitoring service offers packet capture and analysis utilities.
By combining both the Network Performance Monitor and the Network Device Monitor, you get complete oversight of your networks. The system implements an autodiscovery function on enrollment that identifies all of the devices connected to your network. The service creates an IT asset inventory and then generates a network topology map from that. The autodiscovery process repeats continuously, so any changes you make to your infrastructure are automatically reflected in the network inventory and the topology map.
The Network Device Monitor uses the Simple Network Management Protocol (SNMP) to query switches and routers for status reports. These reports are interpreted, providing live device health data on the screen. This system also gathers information about each device, such as make, model, age, and processor capacity.
Each network device has an SNMP agent preloaded onto it by its manufacturer and if that program spots a problem with the device it sends out a notification. The Datadog Network Device Monitoring service picks up those messages and displays them in the system console as alerts.
The alerting mechanism in Datadog Network Device Monitoring can be extended to generate an alert if any of the metrics that the system gathers passes a specified threshold. You can set up your own thresholds to get alerts on any condition that you choose. The alerting system is also available in the Network Performance Monitor so traffic limits will be highlighted when bottlenecks start to form.
You can set up an alert forwarding rule so that you can receive notifications by email, SMS, PagerDuty message or Slack message. This means that you can leave the two network monitoring systems to automatically monitor the network because you know that you will be notified if human attention is needed.
The traffic monitoring services in the Network Performance Monitoring module don’t just count packets circulating around the network. It is also able to identify data traffic within a virtualization system and it can perform activity monitoring for containers. The tool extends to cloud services, where it is able to show you the traffic in and out of each of your cloud-based accounts.
Who is it recommended for?
Centralized data centers would benefit most from the Datadog Network Monitoring service. The package can be set up remotely to monitor any network without any site visit.
Pros:
- Automatic Asset Inventory: Datadog supports autodiscovery, creating and maintaining a network asset inventory that is continuously updated as new devices are added or changes occur.
- Traffic Patterns and Virtualizations: Datadog provides monitoring capabilities for traffic patterns, including activity within virtualized environments, giving insights into network usage and performance.
- Accessible from Anywhere: As a cloud-based system, Datadog offers the advantage of accessibility from anywhere, eliminating the need for users to manage their own infrastructure.
Cons:
- Desire for a Longer Trial Period: Extending the trial period could give users more time to fully explore and evaluate the platform before making a decision.
Datadog Network Performance Monitoring and Datadog Network Device Monitoring are just two modules on the Datadog platform. These systems work well together with other Datadog monitors, which include the Synthetic Monitoring service and the Datadog APM. You can try any and all Datadog units with a 14-day free trial.
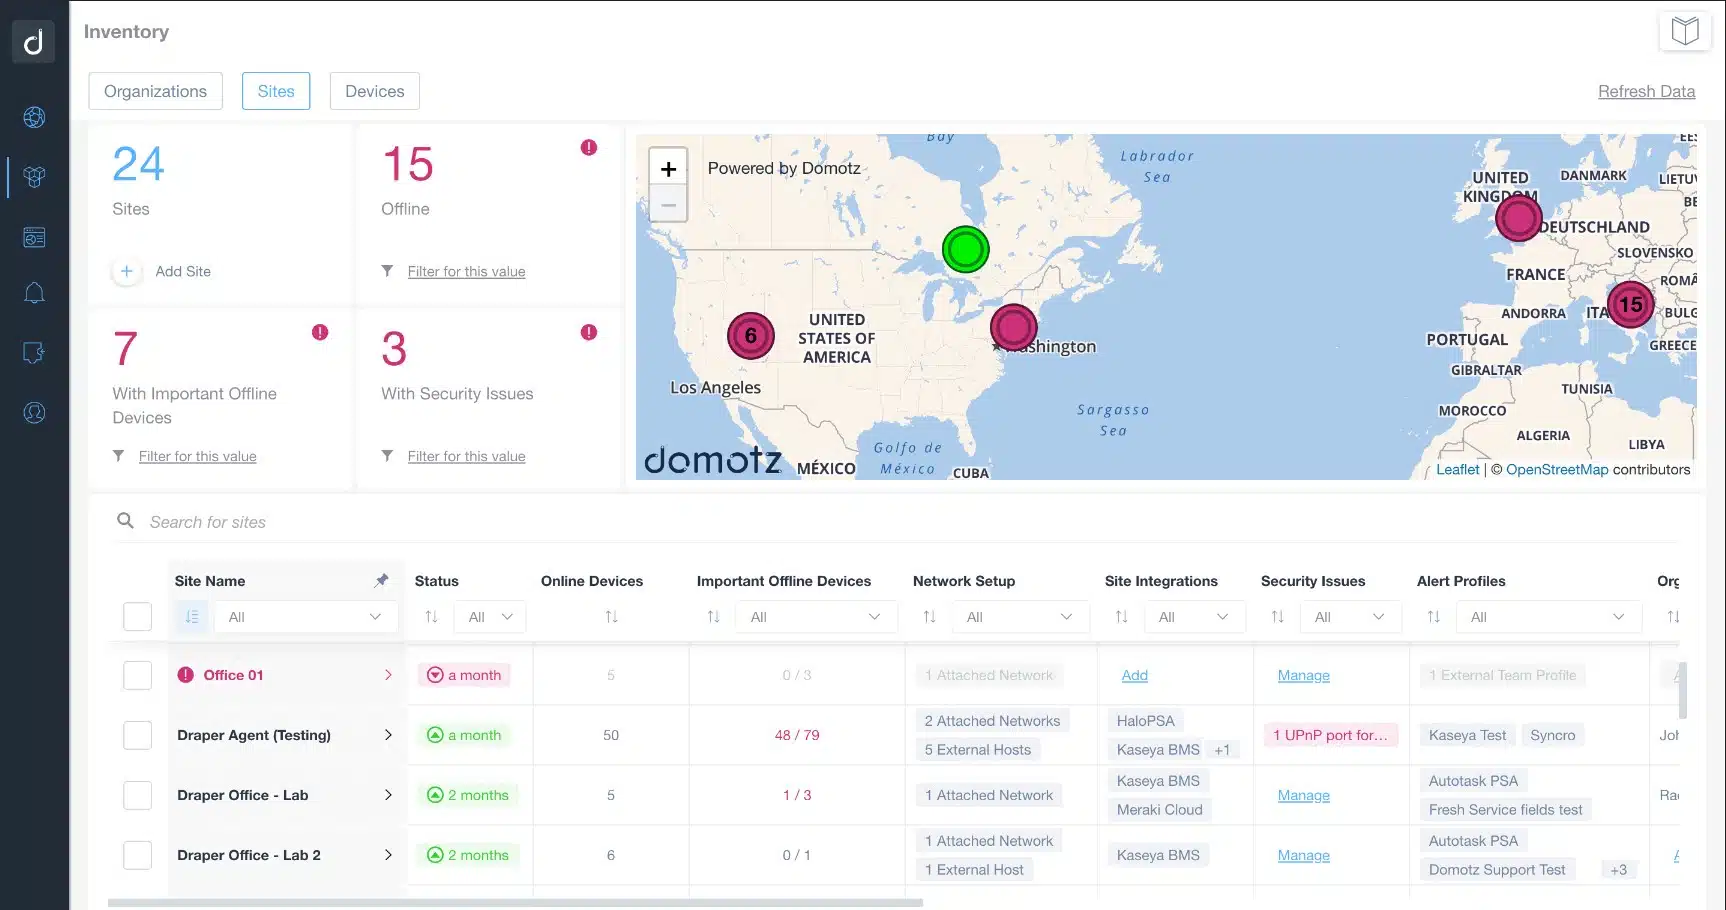
14. Domotz
Tested on: Cloud/SaaS
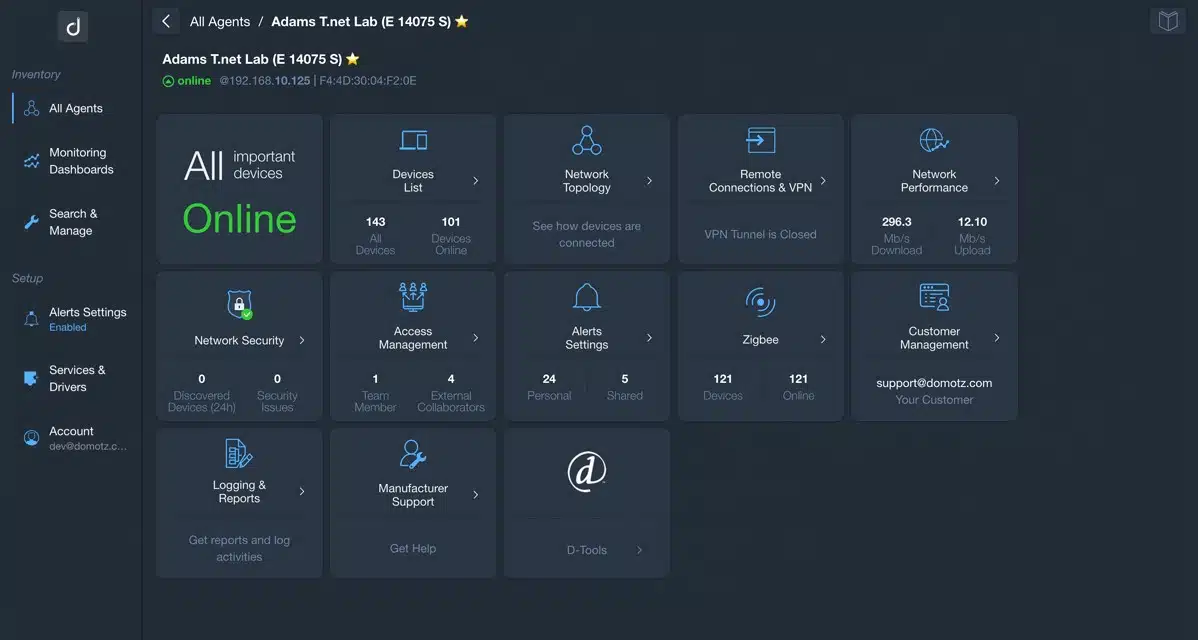
Domotz is a cloud-based system that offers network monitoring. It can unify the supervision of multiple networks and also has a multi-tenant configuration for use by managed service providers.
The system is accessed through an attractive cloud-based console with any standard Web browser. Setting up an account involves installing an agent on a host that is connected to the network that is going to be monitored. The package also includes network and endpoint management tools and workload automation facilities.
Key Features:
- Network Autodiscovery: This simplifies the process of identifying and adding devices to the network.
- Automated Network Mapping: This feature provides visual representations of the network topology.
- IT Asset Inventory: Domotz supports IT asset inventory management, helping users keep track of the devices present in the network.
- Device Monitoring: Allows for the collection of performance data from SNMP-enabled devices.
Unique Feature
Domotz’s strong emphasis on remote access and management capabilities. You can securely connect to devices on their network from anywhere in the world, facilitating remote troubleshooting and configuration – especially beneficial for MSPs and businesses with multiple locations.
Assets and network stress points are easily identified
Why do we recommend it?
This cloud-based system can be accessed through any standard Web browser and it can monitor multiple sites simultaneously. Once we were granted access to a site, the autodiscovery feature of Domotz compiled and maintained an inventory and network map.
The Domotz package has a large number of features. The tool is centered on network monitoring via SNMP and other network protocols. This includes the possibility to easily configure SNMP sensors and alerts. You can also specify your own alert conditions.
SNMP reports enable the system to compile an asset inventory and draw up a network map. These services are updated with every SNMP agent response cycle. The information attached to each node in the map and the inventory list details the make and model of each divide and its capacity.
The package also includes a switch port mapper, and management tools within the package allow the remote access and configuration management of network devices. IoT services can also be accessed and controlled remotely. The system is able to cross network platforms to access wireless networks and devices, through hundreds of integrations and the possibility of implementing customized monitoring drivers.
Who is it recommended for?
Domotz offers a multi-tenanted version that is a good fit for use by managed service providers. In-house operations teams could also use this system for multi-site monitoring.
Pros:
- Multiple User Accounts per Client: Domotz supports multiple user accounts per client, facilitating collaboration and user-specific access to the monitoring data.
- Monitoring of Multiple Sites: Domotz merges the monitoring of multiple sites, providing a centralized view of network performance across different locations.
- Encryption for enhanced Security: The platform uses encryption to protect interactions between the Domotz platform and the network, ensuring secure communication.
Cons:
- No Endpoint Agent for macOS: The absence of an endpoint agent specifically designed for macOS might affect the effectiveness of monitoring on macOS devices compared to other platforms.
There are two pricing plans for Domotz.The Device Plan costs up to $1.50 per month per device,and their Location Plan is priced at $35 or less per month, per location. You can try Domotz on a free trial.
15. ExtraHop Reveal(x)
Tested on: SaaS

Key Stats and processing times are prominently displayed numerically
ExtraHop Reveal(x) is a network security monitoring system that is able to block the threats that it identifies. This tool uses AI to spot illogical or non-standard behavior that can indicate account takeover or an insider threat. The service operates an anomaly-based detection method.
Key Features:
- User and Entity Behavior Analytics (UEBA): Incorporates UEBA capabilities to analyze patterns and behaviors, enhancing the ability to detect anomalies and potential security threats.
- Automatic Network Discovery: Utilizes automatic network discovery to streamline the initial setup process and ensure that the monitoring system stays updated as the network evolves.
- Identifies Rogue Devices: Offers features that specifically identify rogue devices, contributing to network security by addressing potential threats in real-time.

Why do we recommend it?
ExtraHop Reveal(x) provides a constantly updated network inventory and will immediately spot unauthorized devices on the network. It also uses anomaly detection to identify intrusion and insider threats. The package provides important network detection and response (NDR).
On testing, the ExtraHop service set itself up by scanning the network and creating an inventory of all connected devices. The tool then operated as a packet sniffer and protocol analyzer, categorizing all traffic on the network. User and Entity Behavior Analytics (UEBA) recorded activity metrics per user account and IP source.
Response mechanisms in Reveal(x) can be set up to run automatically. These use orchestration to shut down threats by coordinating with third-party systems. The ExtraHop platform is also available in an edition to protect cloud systems.
Who is it recommended for?
ExtraHop Reveal(x) is probably a little too complex for the needs of small businesses. However, mid-sized and large companies will benefit from using this network security monitoring system.
Pros:
- Multi-Site Operations: Supports operations across multiple sites, allowing organizations with distributed infrastructure to monitor and manage their network effectively.
Cons:
- No Price List: The absence of a publicly available price list may pose a challenge for organizations seeking transparency in pricing.
ExtraHop Reveal(x) is offered as a SaaS platform. It is also possible to get the system as a network appliance. You can examine ExtraHop by accessing a demo.
- These demos are:
- Demo
- Self Guided Demo
- Guided Live Demo
16. AKIPS
Tested on: Hyper-V and VMware over Windows
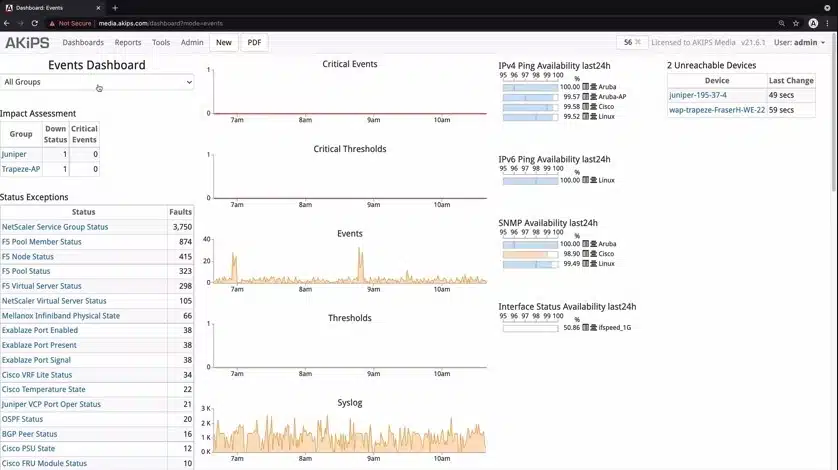
AKIPS is a network monitoring package that provides both device status checks and traffic monitoring. The system includes a discovery service that generates a network inventory. Each record in the inventory lists provides click-through access to device details. That detail screen also shows all of the recent events on the device.
Key Features:
- Network Discovery: Generates a system inventory
- Device Statuses: Continuous monitoring with SNMP
- Traffic Analysis: Extracts NetFlow data from switches
Unique feature
The AKIPS system runs on FreeBSD. You don’t need to be running that operating system to use AKIPS because the installation image for the tool installs within a VM and installs the FreeBSD operating system before the network monitoring software. You can run this tool, therefore, on any operating system that supports a VM, such as Hyper-V or VMware.
Why do we recommend it?
AKIPS combines network device monitoring and network traffic analysis. These are two functions that most monitoring systems providers split into two separate units. So, with one purchase, you get all of the monitoring facilities that you need to head off problems and keep your network running.
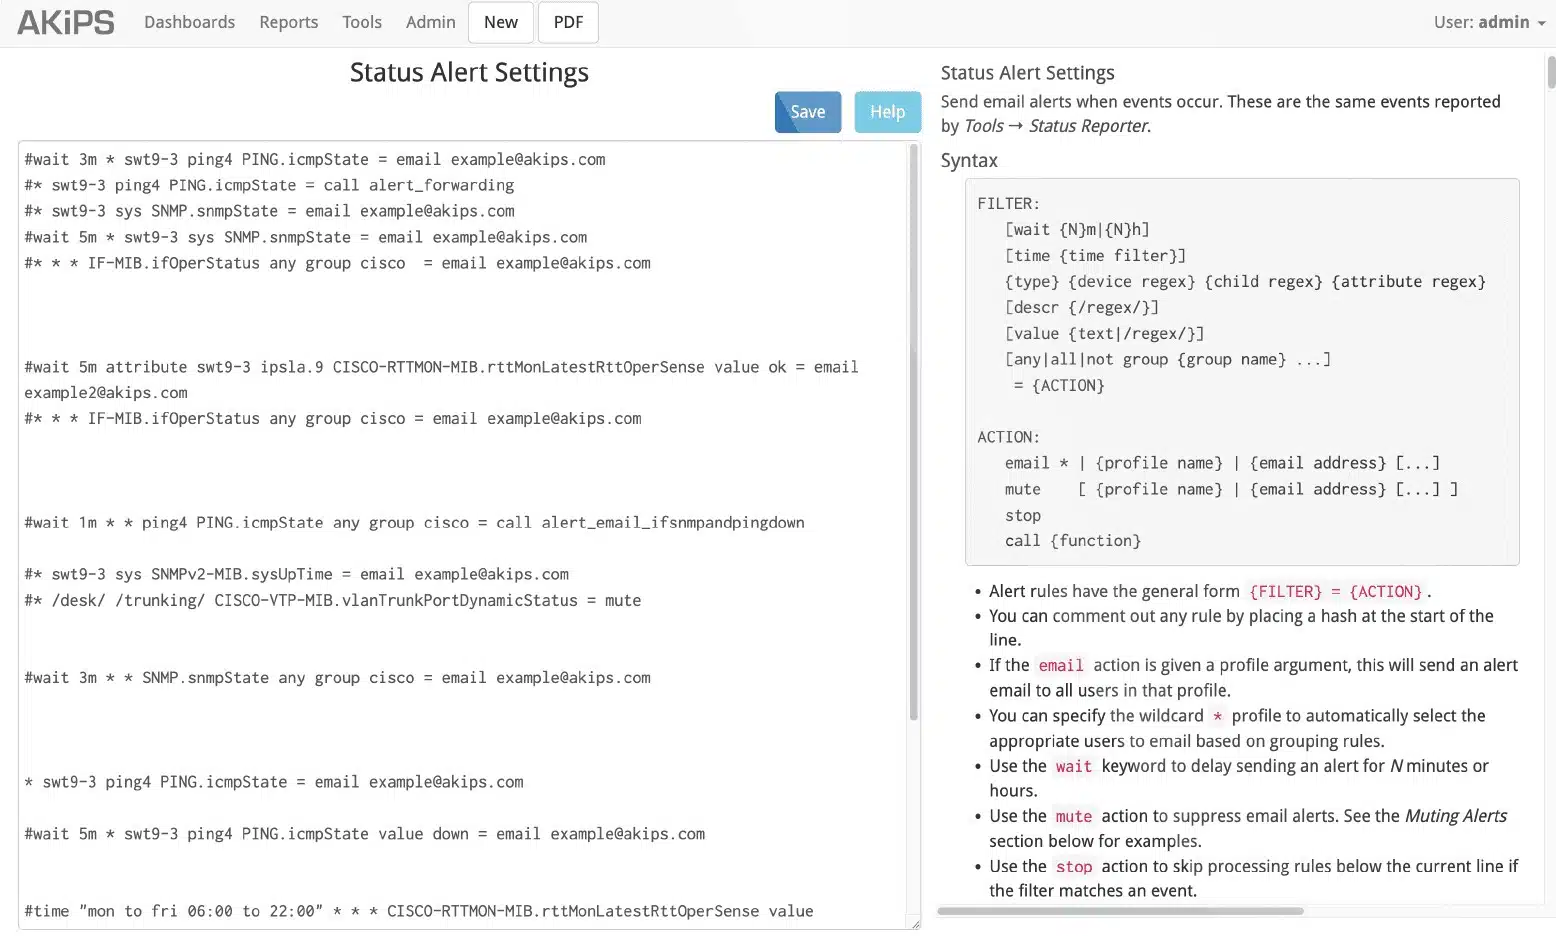
The device dashboard uses both SNMP and Ping to check on each device. This enables the system to check for availability because if a device goes offline, it will cease to exist in the SNMP system. If the device has a problem but is still running, the AKIPS console will receive an SNMP Trap message. This is interpreted into an alert. The package can forward alerts as notifications by Teams, Slack, PagerDuty, ServiceNow, or Opsgenie.
The AKIPS system also raises an alert if a previously detected device disappears. It is possible to define performance thresholds on factors such as traffic throughput. So, for example, if traffic levels on a link suddenly drop, or reach the full capacity of the switch interface to which it connects, the system will generate an alert. These conditions are detailed in the Events Dashboard of the AKIPS console.
AKIPS provides information about the network that can help with capacity. This category of data includes information on unused interfaces or traffic patterns per link over time. The system can forward its data as logs to SIEM systems for activity analysis.
Who is it recommended for?
AKIPS doesn’t publish its price list, which makes a decision on its suitability for small businesses difficult to make. The package doesn’t include system to check on internet links to cloud platforms or between sites, so this is a LAN management package. The service is ideal for monitoring a single network.
Pros:
- Full Network Visibility: Combined network device and traffic monitoring
- Alerts for Device Problems: Resource shortages and performance dips
- Log Forwarding to SIEM tools: Good for threat hunting
Cons:
- No General Price List on the Site: You need to get a customized quote
The AKIPS system installs in a VM, which means that it can run on any operating system. Within the hypervisor, the network monitoring software actually runs on FreeBSD Unix. However, that operating system is included in the installation package. You can get a demo to see how the system works and then access the package yourself with a 30-day free trial.
17. SolarWinds Network Performance Monitor
Tested on: Windows Server
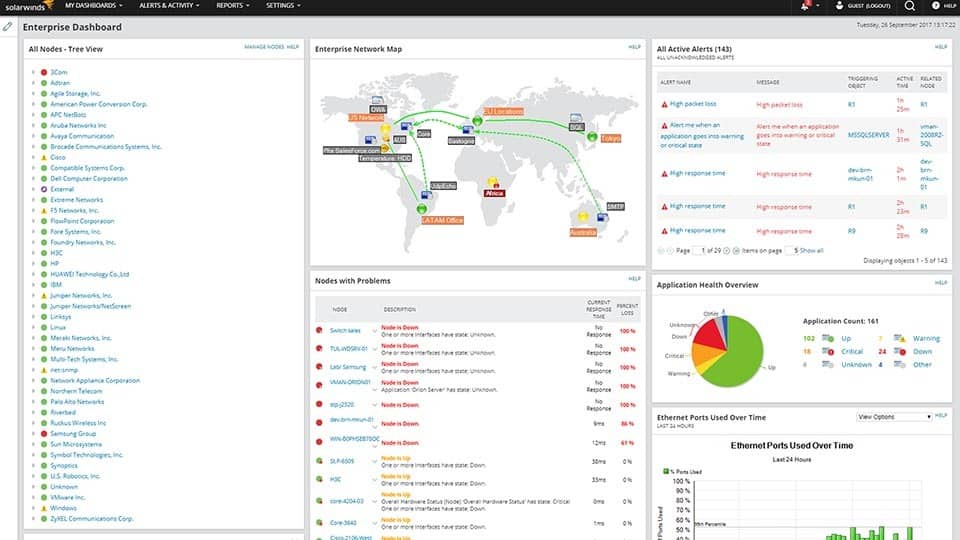
The main dashboard monitors the availability and performance of connected network devices from a holistic perspective.
SolarWinds Network Performance Monitor is a comprehensive network performance monitoring tool that can monitor the status of devices with SNMP. It can automatically discover network devices connected to your network.
When we tested Network Performance Monitor we found the following key features and a unique feature as compared to other reviews in this post.
Key Features:
- SNMP Monitoring: SNMP monitoring allows it to gather performance data from network devices that support SNMP.
- Auto-Discovery: The feature automatically discovers and identifies connected network devices, streamlining the process of adding and managing devices on the network.
- Network Packet Analysis: Network packet analysis enables users to analyze the packets flowing through the network for troubleshooting and performance optimization.
Unique Feature
A unique feature of SolarWinds is its NetPath tool. This is like the TraceRoute function that is available in other tools on this list, such as PRTG and Site24x7. However, NetPath shows the route as a visual representation.
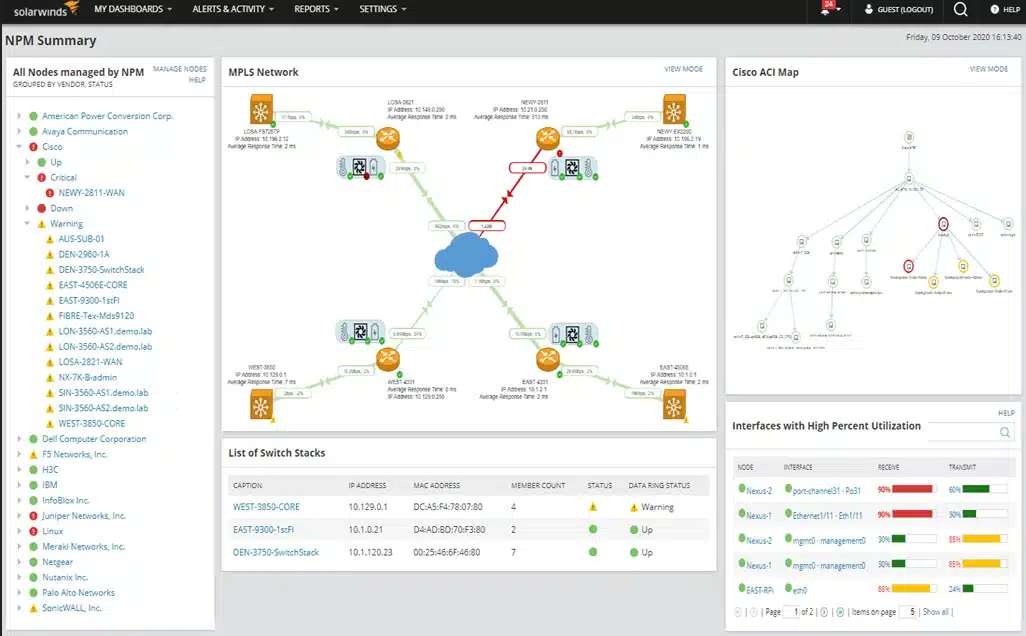
The network maps show broken connections that need attention in red.
Why do we recommend it?
The SolarWinds Network Performance Monitor is an automated tracking system that identifies all devices connected to the network, maps them, and watches out for performance issues. This system will alert you of gathering problems and send a notification. Alongside solid vulnerability scanning and advanced options to create and monitor policies, this is by far the top choice for network monitoring systems.
Any devices, applications, or services that have been discovered can also be viewed on a network topology map where you can see how your infrastructure links together. The NetPath feature allows you to trace packet transfers hop-by-hop, which can help to diagnose the origin of performance network issues more effectively.
The custom alerts system enables you to set trigger conditions for alerts. Once the trigger conditions are met the software will send you a notification by email or SMS to let you know that an event has taken place. The user can view a comprehensive list of alerts according to severity by going to the All Active Alerts page.
Who is it recommended for?
I was impressed how this tool automates network monitoring – it even sets itself up, so it is suitable for all sizes of enterprises because it doesn’t require specialized network management knowledge to operate. Alerts mean that you can assume everything is running OK unless you get a notification, so you can spend your time on other issues and let the NPM take care of the network. Our testing surfaced the following pros and cons for NPM.
Pros:
- Auto-Discovery: The support for auto-discovery enables the creation of real-time network topology maps and inventory lists as devices enter the network, simplifying network management.
- SNMP Monitoring and Packet Analysis: This provides users with comprehensive control over monitoring capabilities, making it versatile compared to similar tools.
- Customizable Dashboard: SolarWinds NPM allows users to customize the dashboard using drag and drop widgets, enabling a personalized and intuitive user interface.
Cons:
- May Be Overwhelming for Small Networks: Given its feature-rich nature and focus on enterprise-level functionality, small LANs may find it overwhelming or more than they require for their specific needs.
The price of SolarWinds Network Performance Monitor starts at $2,995 (~£2,350). You can download the free trial.
Related post: SolarWinds Network Performance Monitor – Full Review
18. Fortra’s Intermapper
Tested on: Windows Server and Linux
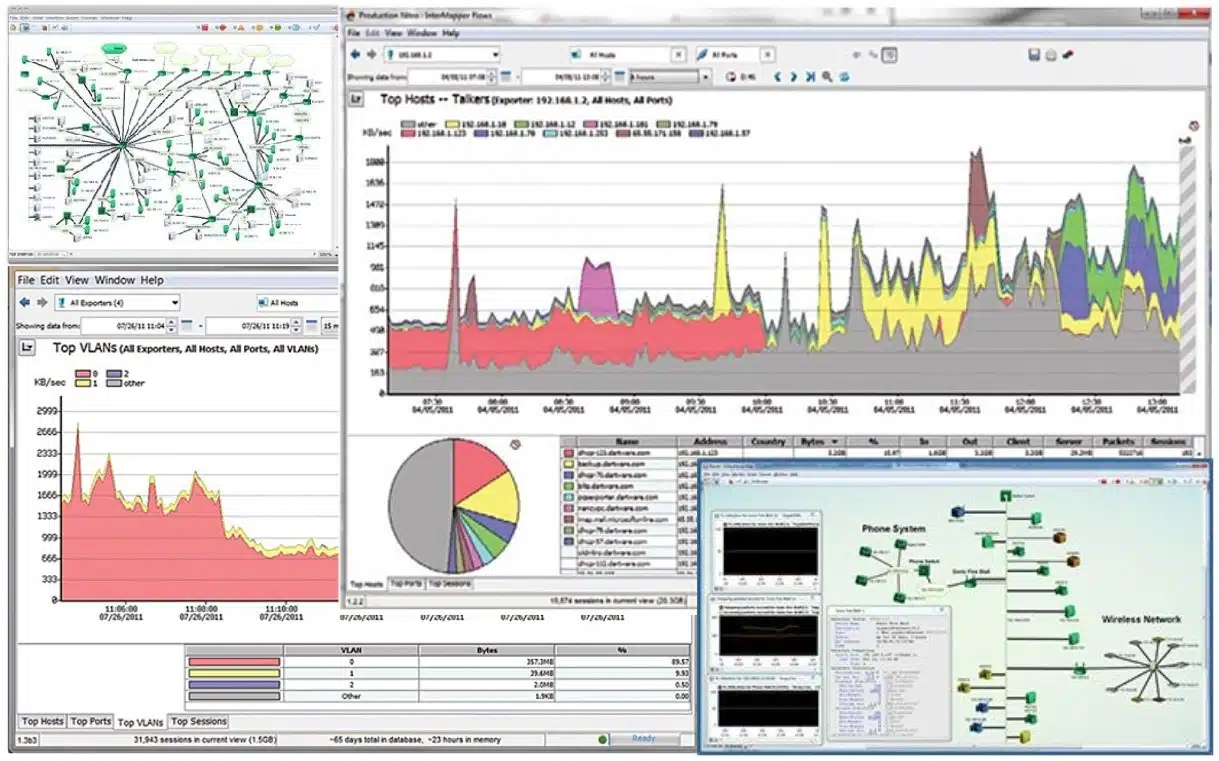
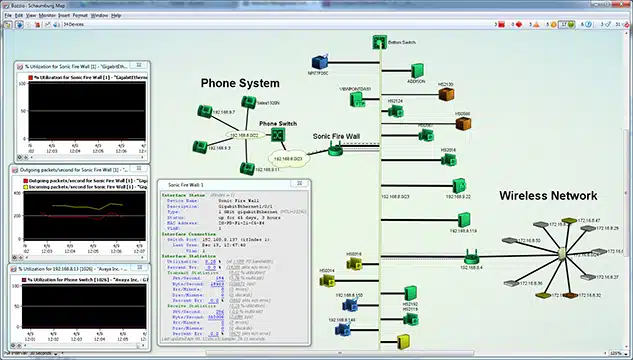
Comprehensive maps and time graphs at your fingertips
Fortra’s Intermapper offers a network map on its main screen. However, we found that this tool offers more than just a visual representation of your network. For a start, that network map is derived from an autodiscovery function. The network probe cycles around constantly and if any changes occur in the network’s layout, the network map is updated automatically. The system operates around the clock.
Key Features:
- Autodiscovery: Features automatic discovery of devices on the network, simplifying the initial setup process.
- SNMP-Based Network Monitoring: Utilizes SNMP for network monitoring, allowing for the collection of performance data from network devices.
- Performance Alerts: Offers performance alerts to notify users of any issues or deviations from normal network operation, facilitating proactive problem resolution.
- Capacity Planning Tool: Includes a capacity planning tool to help users assess and manage the resources and capabilities of their network.
Unique Feature
Real-time, visual insights on the network’s health helps identify bottlenecks, spot device failures, and give better clarity on the impact of any network changes.
Drill down to see each device’s connections and characteristics
Why do we recommend it?
Intermapper crowds a lot of information onto one screen, which saved me time looking through network performance information because I didn’t need to switch pages in the interface. The Intermapper implemented autodiscovery and created a rudimentary map to illustrate live performance status reporting.
The network map operates as a menu to details on each of the devices on the network. Click on an icon to see the activity on that particular node. You will see throughput data as well as status reports.
I was able to set performance threshold levels on each of the metrics that the monitor tracks, such as CPU capacity or interface throughout. This helped me monitor availability and other SLA-related conditions because the system will raise an alert if one of those thresholds gets tripped.
You can set up the preferences in the system so that Intermapper will send you an email or a text message if an alert occurs. That means that I didn’t have to sit and watch the network monitoring screen all of the time.
Who is it recommended for?
Fortra Intermapper is a free tool, so it is a great option for businesses that are trying to tighten spending. This is an on-premises package and it is one of the few network monitoring systems that will run on macOS – it is also available for Windows and Linux.
Pros:
- Server Not Required: Fortra doesn’t require a dedicated server for each host; a PC is sufficient, simplifying the deployment and reducing infrastructure requirements.
- Continuous Automated Monitoring: Provides continuous and automated monitoring, ensuring that the network is under constant surveillance for potential issues.
- Free Version Available: Fortra provides a free version, enabling users to experience the basic features without the need for immediate financial commitment.
Cons:
- No Cloud Version: Lacks a cloud version, which may limit flexibility for organizations that prefer or require cloud-based solutions.
- Free Edition Device Limitation: The free edition is restricted to monitoring only five devices, potentially limiting its usefulness for larger networks.
Fortra’s Intermapper is on-premises software and it will install on Windows, Linux, or macOS. There is a free version available that will monitor up to five devices. The paid version has scaleable pricing that starts with ten devices. You can choose between a subscription or a perpetual license. The paid version of Intermapper is offered on a free trial.
19. Nagios Core
Tested on: Linux/Unix, Windows VMWare
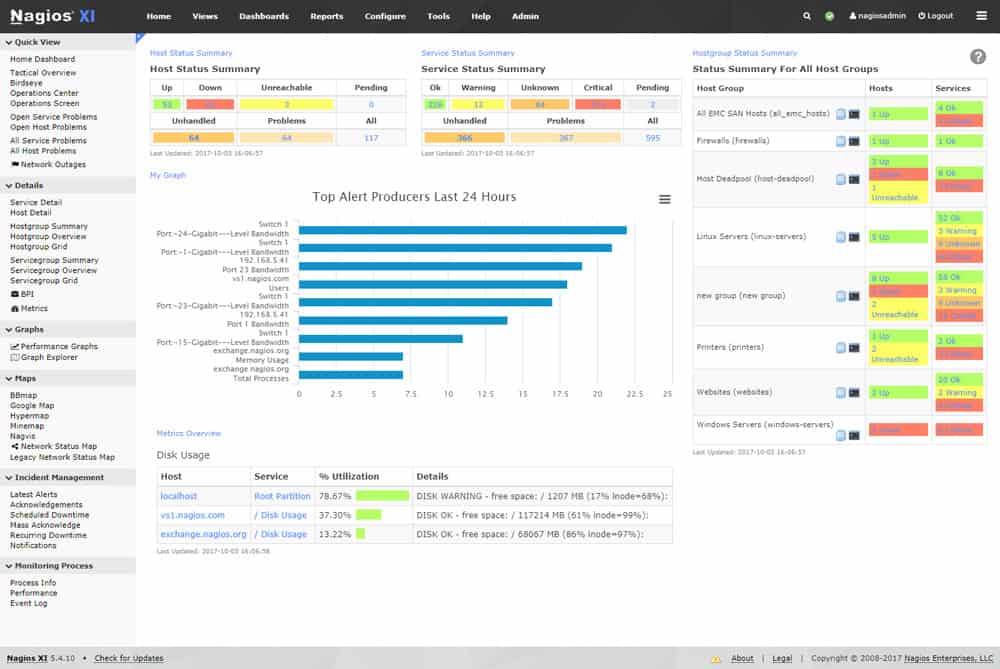
For those that prefer bar charts and color-coded device alerting Nagios Core is an open-source network monitor that has a web interface for monitoring network performance. Through the user network interface, you can monitor your Current Network Status with your Host Status Totals and Network Service Status Totals broken down at the top of the page. The GUI is color-coded so you can easily see elements that are unavailable or compromised.
Key Features:
- Performance Dashboard: Provides a performance dashboard for real-time monitoring and visualization of key metrics related to network and system performance.
- Capacity Planning: Includes capacity planning features to help users assess and manage the resources and capabilities of their IT infrastructure.
- Community-Created Plugins: Allows the use of community-created plugins, extending the functionality of Nagios Core by providing additional monitoring capabilities.

Why do we recommend it?
Nagios Core is one of the most reliable and respected open-source IT asset monitoring packages that will monitor networks, applications, and servers. This version of Nagios is free to use but you should also consider the paid Nagios XI edition.
We were able to track performance events through the alerts system, which sent out notifications by email and SMS. You can view the Alert History section to see what alerts were created and when. The list of alerts is also color-coded making it easier to prioritize critical alerts.
We were able to use APIs to integrate other network services. If you require more functions then you can also check the thousands of community plugins available on the Nagios Exchange to help you add additional functions. For example, there is a check SNMP CPU load plugin that allows you to monitor the SNMP load or CPU usage of your network device.
Who is it recommended for?
Nagios Core doesn’t have a proper user interface but it has a very flexible and powerful discovery and data-gathering engine. Therefore, it is a good option if you want to create your own monitoring application with a free data representation tool, such as Kibana or Prometheus, and feed in data from this tool.
Pros:
- Open-Source Transparent Tool: Nagios Core is an open-source tool, providing transparency and allowing users to access and modify the source code as needed.
- Robust API Backend: A robust API backend makes Nagios Core suitable for developers who want to integrate their custom applications or scripts with the monitoring system.
Cons:
- Open-Source Version Support: The open-source version may lack the level of support found in paid products, potentially requiring users to rely on community forums and resources for assistance.
- Technical and Complex Installation: Installation can be technical and complex, particularly for users without extensive experience in system administration.
Nagios Core is an excellent free network monitoring software however the setup can be slightly more hands-on than other products on this list. Download Nagios Core for free, or depending on your needs, see how it compares with Nagios XI. Both versions of the package run on RHEL, Ubuntu, CentOS, and Debian Linux. The software will run on Windows over a VMWare or Hyper-V hypervisor.
20. Catchpoint Network Experience
Tested on: Cloud/SaaS

Clear layout dashboard that is easy to drill-down
Catchpoint Network Experience is one of the four performance monitoring module on the cloud-based Catchpoint platform. The purpose of the Catchpoint system is to ensure the successful delivery of Web applications. The platform is offered as a single package rather than individual module purchases.
Key Features:
- Virtual Network Performance Monitoring: Allows monitoring of virtual network performance, ensuring visibility into the performance of virtualized infrastructure.
- BGP Assessments: Performs Border Gateway Protocol (BGP) assessments to evaluate the routing information and paths across the internet.
- Website Delivery Performance: This feature enables organizations to monitor and optimize the end-user experience.

Why do we recommend it?
Catchpoint Network Experience is intended for use as part of a suite of tools that ensures the successful delivery of Web pages and other Web applications. Therefore, this tool is excellent for checking on the successful delivery of Web systems. It forms part of a monitoring chain that can quickly identify the root cause of performance issues.
The other modules in the Catchpoint platform are an application monitor and real user and synthetic monitoring tools for Web applications. The network service checks on the performance of connections to the different servers that contribute to the successful delivery of a Web page and its contents. These other servers include content delivery networks (CDNs), DNS servers, and serverless hosts of the microservices that get triggered by user interactions within a Web page.
The Network Experience system also analyzes the activities of virtual networks, such as Secured Access Service Edge (SASE) and SD-WANs. It will identify performance issues with remote access and site-to-site VPNs and then trace through a LAN to the Web servers that hold the company’s websites.
Who is it recommended for?
The full Catchpoint platform is specifically designed to track the performance of websites, so it isn’t a good choice for businesses that need a LAN monitoring service. Businesses that host their own sites will be the most suitable customers for the Catchpoint system. However, those companies that use hosting services and CDNs to optimize delivery can also benefit from the Catchpoint service.
Pros:
- Root Cause Analysis: Offers root cause analysis capabilities to identify and address the underlying issues causing performance problems.
- Assesses ISP Performance: ISPs and other services to assess their performance and reliability.
Cons:
- Not Suitable for LAN Monitoring: Catchpoint may not be suitable for LAN monitoring, which could limit its applicability for organizations primarily focused on internal network performance.
Although Catchpoint is a SaaS package, it does have an onsite element, which is called the Enterprise Node. This installs on one of your servers and manages the monitoring of your Web host and the network links between it and the outside world. This agent runs on RHEL and CentOS Linux. It can also be run as a virtual appliance over Hyper-V or VMware. Catchpoint is available for a 14-day free trial.
21. Icinga
Tested on: Windows and various Linux Distros
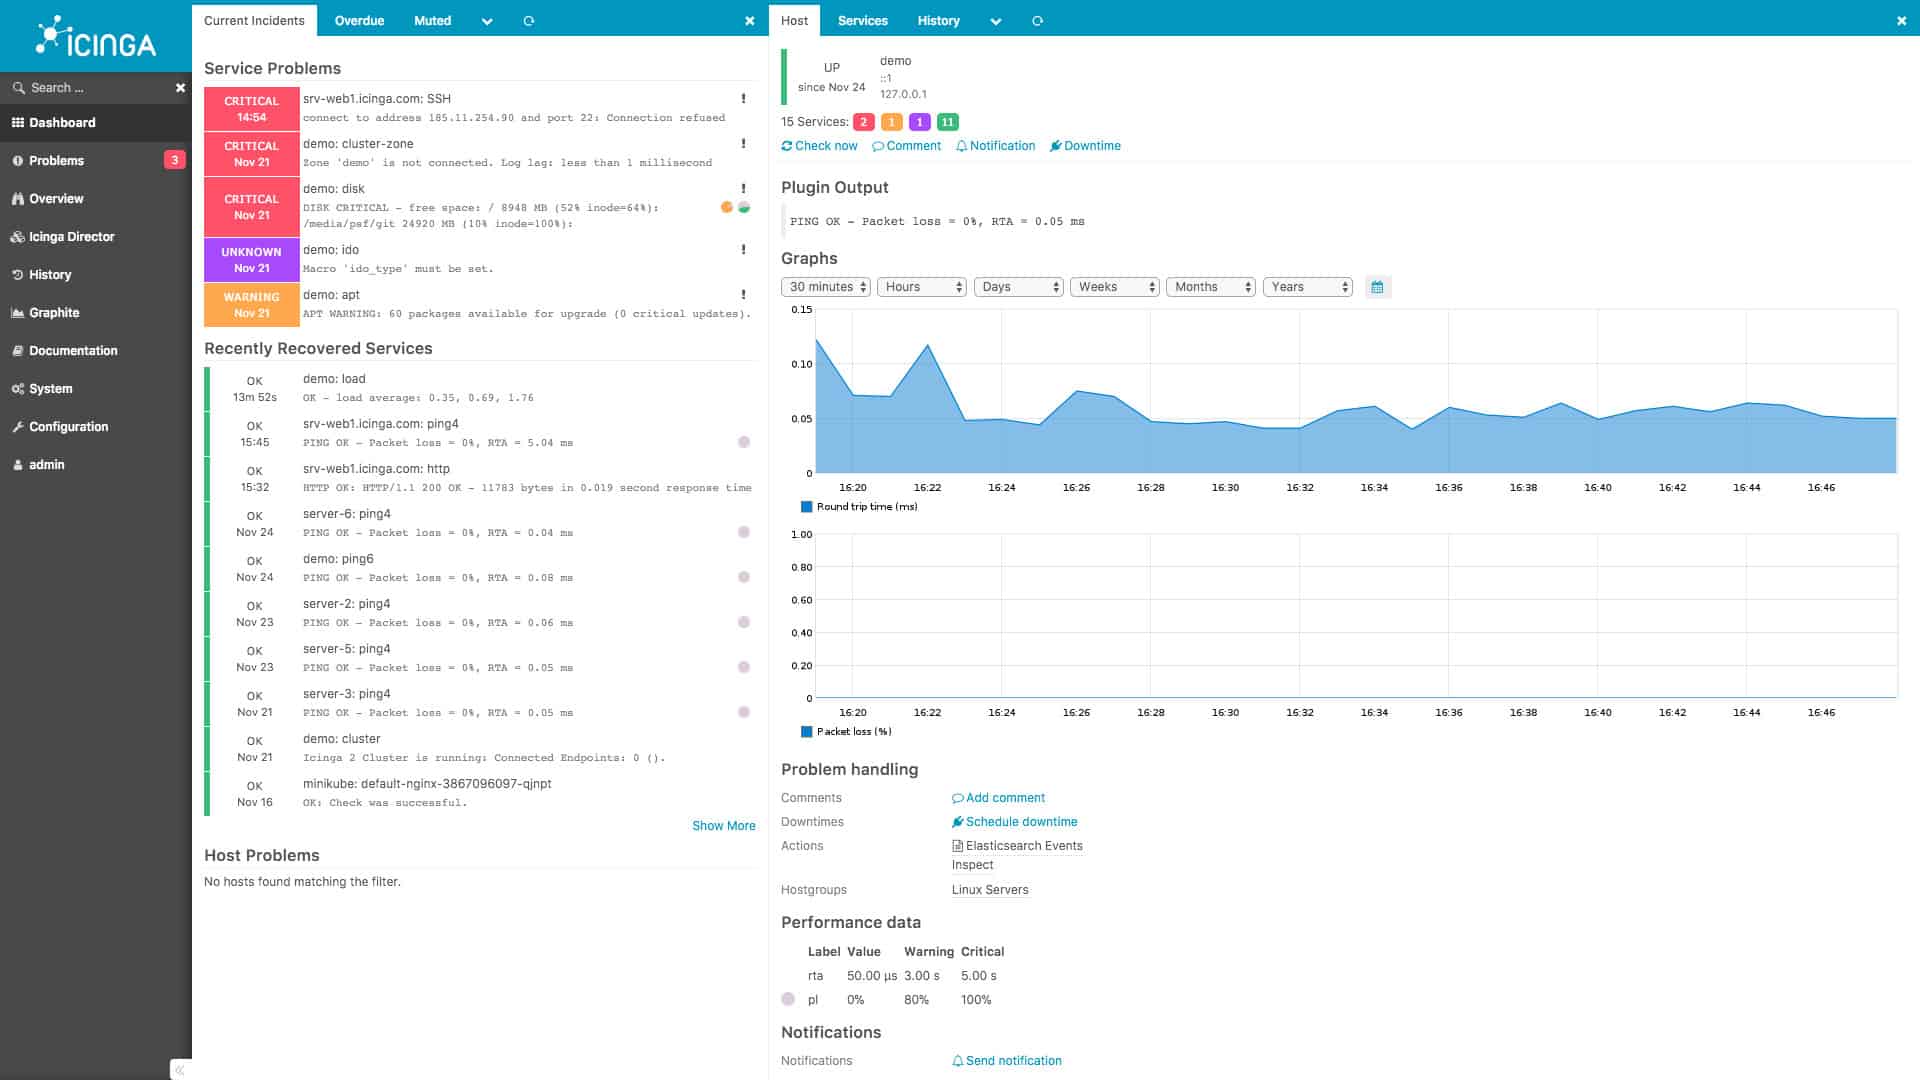
Network alerts and stressed devices are prominently displayed Icinga is an open-source network monitoring tool that monitors the performance of your network, cloud-service, and data center. The software is web-based and can be configured through the GUI or with the Domain Specific Language (DSL). Having the choice between the two gives you the power to monitor however you want.
Key Features:
- Web-Based GUI: Provides a web-based graphical user interface (GUI) for convenient configuration and monitoring.
- DSL Configuration Available: Offers Domain-Specific Language (DSL) configuration options, allowing users to configure Icinga using a specialized scripting language.
- Icinga Modules/Extensions: Supports modules and extensions, extending the functionality of the base installation to accommodate different monitoring needs.
- Built-In Visual Reporting: Includes built-in visual reporting features, enhancing the ability to analyze and interpret monitoring data.

Icinga was developed as an improvement to Nagios and that background gives this system a big advantage over many of the other tools on this list. It is completely free to use, just like Nagios Core but, like Nagios XI, it has a useful graphical user interface that is delivered with pre-written screens but is also customizable. Icinga is still compatible with Nagios plug-ins, so users of this system can enhance the monitoring tool from Nagios Exchange as well as with plug-ins from the much smaller Icinga Exchange.
Why do we recommend it?
We love that Icinga is a free, open-source monitoring package for networks, applications, and servers. It was developed by a team of Nagios creators who were unhappy with the direction of that system’s evolution.
You can log in to the GUI and use the dashboard to view an overview of performance management. The dashboard displays whether there are any problems with performance or availability and color-codes them according to severity. Critical or Down network devices are marked in red.
Extensions or Icinga Modules, allow you to add more functions to the program. For example, the Icinga Module for vSphere allows you to monitor virtual machines and host systems. There is a range of community-created plugins you can download for free from the Icinga Exchange.
Who is it recommended for?
As it is open source, Icinga can be rewritten and its compatibility with Nagios means that it can be extended by the free plug-in library of that rival system. These features make it great for network engineers with programming skills who want to create a bespoke network monitoring tool.
Pros:
- Modules for Different Functionality: Utilizes modules to add different functionalities, keeping the base installation lightweight while allowing users to customize their monitoring environment.
- Cross-Platform Compatibility: Can run on both Linux and Windows operating systems, providing flexibility in deployment.
Cons:
- Reliance on Open-Source Community: Relies on the open-source community for support and updates, which may lead to variations in the level of support and response time.
- Designed for Technical Users: This may require a steeper learning curve for those less familiar with advanced monitoring concepts. Other options might offer better out-of-the-box features for less technical users.
Overall, Icinga is a scalable solution that gives you control over how you manage your environment. Icinga is available for Debian, Red Hat, SUSE, Ubuntu, Fedora, OpenSUSE, Raspbian, and Windows. You can download the free trial version.
22. Zabbix
Tested on: Linux/Unix
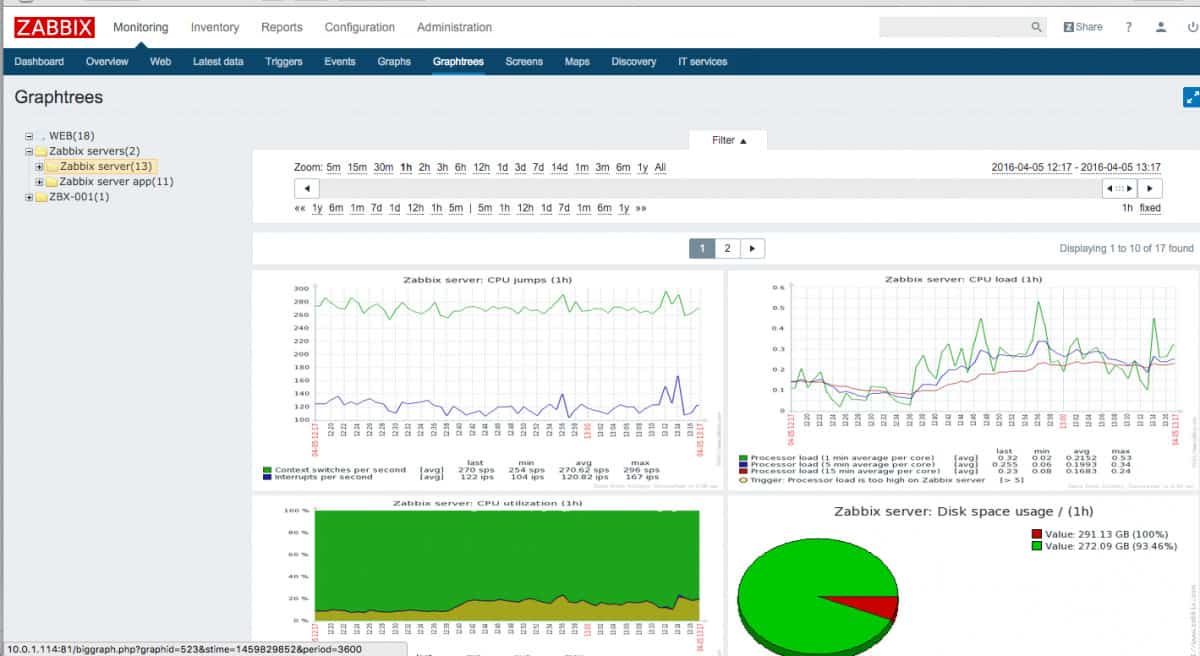
More generic visuals and less customizable than other tools in this list, Zabbix is an open-source free network monitoring tool that combines network, server, cloud, application, and services monitoring into one unified solution. Zabbix uses SNMP and IPMP to monitor your network. The autodiscovery feature automatically locates network devices and adds them to be monitored. The tool can also detect configuration changes automatically so you can tell if a network device has been updated.
Key Features:
- Auto Discovery Feature: Includes an auto discovery feature that automatically identifies and adds new devices to the monitoring system.
- SNMP and IPMP Monitoring: Supports both SNMP and IPMP (Internet Protocol Multipathing) for comprehensive network monitoring.
- Application/Server Monitoring: Provides application and server monitoring capabilities, allowing users to monitor the performance and availability of applications.
- Network Monitoring Templates: Utilizes network monitoring templates for efficient and standardized monitoring setup.
- Alerts System: Implements an alerts system to notify administrators of issues or events, facilitating timely response.

Why do we recommend it?
Zabbix is a free tool that can be expanded by templates. This service can monitor networks, servers, and applications and it uses SNMP to discover and monitor network devices.
Network monitoring templates make it easy to configure the program for monitoring. For example, there are preconfigured templates for vendors such as Cisco, Hewlett Packard Enterprise, Dell, Intel, Netgear, and more. If you require more variety then you can access even more community templates form the Zabbix community site.
To ensure that you can respond to alerts in time, Zabbix has a notification system. Alerts are sent by email, SMS, messenger, jabber, or custom scripts to update you on evolving network security events. The notification content can be customized according to the recipient to make sure that the point of contact has everything they need to reopen intelligently.
Who is it recommended for?
Zabbix is a Linux-based on-premises package and its competitive edge against many of the tools on this list is that it is free to use. The screens for this system contain great data visualization features and they can be customized, which makes this one of the easiest tools to tailor without the need for technical abilities.
Pros:
- Open-Source Transparent Tool: Zabbix is an open-source tool, providing transparency in its codebase and allowing users to customize and extend its functionality.
- Immediate Detection of Devices and Changes: Can detect new devices and configuration changes immediately, ensuring accurate and up-to-date monitoring.
- Useful Templates for Quick Insights: Offers pre-built templates for quick setup and insights, streamlining the monitoring configuration process.
Cons:
- Interface Not as Intuitive: The interface may not be as intuitive as some other solutions, potentially requiring users to spend more time learning the system.
- Desire for Better Alerting Features: Some users have expressed a desire for improved alerting features, specifically related to reducing false positives.
Zabbix is one of the top Linux network monitoring tools on the market. Autodiscovery and templates make the program straightforward to deploy. The software for the package is installed on Linux, macOS, and Unix. Although the main server for Zabbix isn’t available for Windows, there is an agent program that enables it to monitor Windows endpoints over a network. You can download the software for free.
Related networking posts:
- Best Packet Sniffers (Packet Analyzers Reviewed)
- Server Management & Monitoring Tools
- A guide to Router Traffic Monitoring
- The Best VM monitoring Tools and Software
- The best Network-based intrusion Detection Systems (NIDs) tools
- NetFlow – Ultimate Guide to NetFlow and NetFlow Analyzers
- Best System Monitoring Software
- Best Open Source Network Monitoring Software
- Nagios vs Zabbix
Network monitoring tools FAQs
What is the difference between network monitoring and application performance monitoring?
Network monitoring is concerned with the performance of the devices that operate the network, such as switches and routers. This activity is called network performance monitoring. The other main task of network monitoring examines traffic flow, this is called network traffic analysis. While some network traffic analysis tasks involve identifying the applications that generate or receive traffic, those monitoring functions are not concerned with whether the applications are running properly. Application performance monitoring watches whether applications are able to get all of the resources they need in order to function properly. One of those resources is access to the network.
What are the types of network monitoring software?
There are two types of network monitors: packet sniffers, which sample network traffic, and network performance monitors, which collect network device reports. There are seven types of network monitoring systems:
- Performance monitors – Processors of Simple Network Management Protocol (SNMP) status messages.
- Performance testers – Issue commands, such as Ping and Traceroute to gather statistics.
- Protocol analyzers – Based on packet sniffers for LANs.
- Wireless sniffers – Based on packet sniffers for wireless networks.
- Firewalls – Read packets traveling through the network boundary.
- Intrusion detection systems – Identify standard and anomalous traffic patterns.
- SIEM tools – Examine log files for signs of security breaches.
How do I monitor all network traffic?
Traffic monitoring tools are called traffic analyzers or NetFlow monitors. While network performance monitors query network device statuses, traffic analyzers examine throughput data from network devices and also extract the headers of passing packets to quantify traffic by protocol, source, and destination.
How does a network monitoring tool work?
Most network monitoring tools use the Simple Network Management Protocol (SNMP). This is an industry-standard for networking and requires an SNMP manager to collect data from SNMP agents. An SNMP agent needs to be resident on each device. All network device manufacturers ship their products with an SNMP agent already installed. All that is lacking is the SNMP manager and this is the role that the network performance monitoring tool provides.


Can I get your recommendations for free version. Which one will be the best option.
It depends on your needs. PRTG Network Monitor is worth taking a look at if you need less than 100 sensors.
Unless I misunderstood, SpiceWorks Network Monitoring has not been under development for several years. This was from a support person at SpiceWorks. However, I will also say that I’ve not re-inquired since then and it could have changed. We have been pretty happy with it but are looking for something else due to the lack of development. For us, and for free, it’s hard to beat.
Hi Jack,
Thank you for your comment. We’ve updated the article with Spiceworks Connectivity Dashboard – this might be worth looking at if you liked Spiceworks network monitoring.
Thanks Tim, good list of tools. We’ve been trialing Solarwinds Network Performance Monitor and are impressed so far.
This is a very good and UPDATED review of the most common NMS available. I do agree with the reviews, though i have not tested many of them (have tested PRTG, NetCrunch, ManageEngine OpManager, SolarWinds Flow Bundle, Spiceworks Network Monitor, Axence nVision and Wireshark).
I thought Splunk was a log management/SIEM product, not a NMS? I agree that Axence nVision is underrated: while it is a NMS, it also features a Help Desk, user/device management/monitoring module; I believe that inteface needs to improve but it is quite good. While NetCrunch is coming up strong, PRTG and it’s extensive data/sensors model, is one of the best currently and it gets updated quite frequently, meaning development is around the clock.
Valuable review.
Thank you, Tim. It is the most complete list I saw. We actually tried many of the above. Some of them are pretty hard to use. Some become too expensive when
your network grows… Some do not have important features we needed. Finally we found CloudView NMS – universal monitoring system http://www.cloudviewnms.com .
This one had all the features we needed out-of-box, also was easy to use. Yes, they have real-time monitoring, visualization and user defined alerts. It works on any platform including Linux/Windows/mac. We started using it as simple desktop application for small size network and the same installation gradually grew into multi-user distributed system monitoring thousands of nodes including secure monitoring of our remote sites. Network monitoring (SNMP, SSH, TL1, ping…); server monitoring: they have both agent-less (via standard protocols SSH and SNMP) and agent for servers, which provides even more visibility. Alerts via e-mail/SMS, northbound interfaces , historical statistics – they have everything. The most cost effective solution They have free version as well.