
Bandwidth monitoring provides network managers with a method to record and assess the amount of data transmitted over a network, particularly with respect to total hardware capacity. It provides visibility into how network resources are being utilized, identifying the volume of traffic, its sources, and destinations. This monitoring can be performed in real-time or through historical analysis, using specialized tools to generate reports and alerts.
Here’s our list of the best bandwidth monitoring tools:
- Progress WhatsUp Gold EDITOR’S CHOICE A dedicated network monitoring platform that collects and analyzes data from devices to provide insights about network usage and traffic patterns. Start a 30-day free trial.
- AdRem NetCrunch (FREE TRIAL) This tool tracks and checks bandwidth usage through flow technologies, like SNMP, NetFlow, IPFix, sFlow, and jFlow. Download a 30-day free trial.
- ManageEngine NetFlow Analyzer (FREE TRIAL) This package checks on the capacity and utilization of each interface of each switch and router, building up a record of the maximum capacity of every possible path. Access a 30-day free trial.
- ManageEngine OpManager (FREE TRIAL) Excels in providing detailed insights into network bandwidth usage with robust alerting and reporting features. Access a 30-day free trial.
- Site24x7 Network Bandwidth Monitoring (FREE TRIAL) This SaaS service monitors network traffic through the use of flow protocols. Start a 30-day free trial.
- Paessler PRTG Network Monitor (FREE TRIAL) A bundle of monitoring tools for networks, servers, and applications that includes traffic sampling sensors for traffic management. Installs on Windows Server. Download a 30-day free trial.
- Datadog Network Performance Monitoring A cloud-based package that tracks network traffic patterns.
- ManageEngine Network Bandwith Monitor This traffic analysis system uses a range of protocols to communicate with network devices from a number of manufacturers. Available for Windows Server, Linux and AWS.
- SolarWinds NetFlow Traffic Analyzer A bandwidth analysis package that communicates with network devices to extract traffic data with capabilities to manage multi-vendor networks. Runs on Windows Server.
- ntopng With a free community edition, this open-source network monitor uses nProbe to gather traffic flow information. Available for Windows, Linux, Unix, macOS, and RaspbianOS.
- Nagios A monitoring package for networks, servers, and applications that is available in free and paid versions. Runs on Linux or over a VM for Windows.
What is bandwidth monitoring and why is it important?
The importance of bandwidth monitoring lies in its role in maintaining network health and efficiency. First, it helps identify bottlenecks and overutilized resources, which can lead to slow performance or outages. By pinpointing high-traffic periods or devices consuming excessive bandwidth, administrators can optimize usage and allocate resources more effectively.
Second, bandwidth monitoring enhances security. Abnormal spikes in traffic can indicate cyber threats such as Distributed Denial of Service (DDoS) attacks, data breaches, or unauthorized access. Early detection through monitoring allows IT teams to respond swiftly, mitigating potential damage.
Additionally, bandwidth monitoring supports capacity planning. Organizations can use the data to predict future network needs, ensuring they scale their infrastructure appropriately to meet demand. This proactive approach prevents unexpected downtime and keeps operational costs in check.
Finally, bandwidth monitoring is crucial for enforcing usage policies. By tracking specific applications or user activities, businesses can ensure compliance with company policies or regulatory requirements and maintain fair usage among users.
In sum, bandwidth monitoring provides critical insights for optimizing performance, enhancing security, and planning for growth, making it a cornerstone of effective network management.
Why monitor internet bandwidth?
If you run a WAN with a lot of interaction between sites, if you integrate Cloud services into your IT infrastructure, or if your main business outlet is your website, your bandwidth monitoring needs to cover internet performance as well as network bandwidth utilization.
You no doubt have a service plan with an internet provider to connect your business together across the world and to communicate with suppliers and customers. You may have chosen a plan that does not provide you enough bandwidth. You will only discover that situation when you monitor bandwidth consumption on your internet connections.
Related post: The difference between Throughput and Bandwidth
Why use a network traffic monitor tool?
Your ISP promises to provide you with a reliable pipe to the Internet of a certain volume; your chosen network hardware install is designed to provide a particular level of service within your facility. Are you getting your expected bandwidth and availability, or is something failing to deliver? Is unexpected traffic consuming the bandwidth that you are getting?
Related post: Best Bandwidth manager software list
Network traffic monitoring tools and bandwidth such as data usage meters can leverage various technologies. A host can observe all the data packets passing by a particular network interface (that is, packet capture). Most managed network devices – and hosts – support SNMP, and so they can be queried to get performance statistics.
Bandwidth monitoring focuses on the available capacity of network equipment and the amount of that capacity that is occupied by traffic. You can extend that visibility further by getting a breakdown of traffic volumes by application or by source and destination to spot where the real bandwidth hoggers are.
Network traffic statistics
You need to watch the bandwidth consumption of each link in your network, not just the overall bandwidth availability. One link can get congested, while others retain spare capacity. Adding on extra bandwidth to alleviate overloading on one link can cause extra throughput to get through and overload other links. That congested link may be hiding the under-provision of bandwidth in other areas of the network.
If your network devices support a traffic monitoring protocol like NetFlow or sFlow, they can publish traffic data to your monitoring tool. For more on these technologies, see Intro to traffic analysis in The best free NetFlow analyzers and collectors for Windows, and NetFlow vs sFlow: What’s the difference and which is better?
Network bandwidth monitoring tools
Which network bandwidth testing tools are right for you? There are several considerations when performing a network monitoring applications comparison. One factor is what monitoring technologies your installed hardware supports (e.g., do they support SNMP? NetFlow? sFlow?). One is the size and complexity of your network; a simple tool that’s a great fit for a small office is completely inadequate for a large sophisticated network. Here we’ll look at the most popular and feature-rich free bandwidth monitoring software that can give you real-time data on your network and internet connection bandwidth utilization.
Monitoring tools that enable you to perform a network bandwidth test on-demand provide analytical functions. Troubleshooting bandwidth problems is impossible without the ability to collect and store network traffic.
Related post: How to Monitor Traffic on your Network
Bandwidth monitoring requirements
You need a tool that can monitor your network for you while you are busy with other tasks. To get that level of service from your bandwidth monitor, make sure you choose a tool that is able to monitor router traffic levels approaching your full bandwidth availability and send you alerts. Reports that can be scheduled at all hours of the day will also help you keep watch on your bandwidth utilization 24/7.
Analytical features in tools help you plan your capacity requirements both to meet current demand, to account for trend traffic increases, and to provision for extra services when demanded.
If your chosen bandwidth tool can save collected traffic to a file, open files, and traffic data into a viewer, then you can begin to observe traffic patterns over time. Viewers that include filtering, sorting, and tagging capabilities will allow you to identify the sources of bandwidth capacity problems. Analytical tools that have sophisticated graphical representations for network data and comprehensive reporting formats will enable you to communicate problems and solutions to stakeholders in your organization and arrive at collaborative decisions.
The best bandwidth monitoring software
We have taken all of the above requirements into account and compiled recommendations on the software that you should consider when you are in the market for bandwidth monitoring software. There are many great monitors available at the moment, but you won’t have enough time to check all of them out. So, we wrote this guide in order to cut down the time you have to spend investigating new software for your enterprise.
Our methodology for selecting free bandwidth monitoring tools
We reviewed the available free bandwidth monitoring software and analyzed the options based on the following criteria:
- The capability to use traffic sampling protocols, such as NetFlow
- Time-series maps showing traffic volumes
- Traffic monitoring per link and point-to-point
- Alerts for devices reaching full capacity
- Traffic shaping measures
- Traffic analysis tools to aid capacity planning
- An option to upgrade to a comprehensive paid system
1. Progress WhatsUp Gold (FREE TRIAL)

WhatsUp Gold is a network bandwidth monitoring tool that uses NetFlow, jFlow, and sFlow protocols to gather data from different devices and analyze it for insights about network traffic patterns. Based on this analysis, WhatsUp Gold provides detailed information on which applications, users, and devices are consuming bandwidth. Using this information, you can make appropriate decisions to ensure the availability of bandwidth for your critical applications.
Key Features:
- Multiple Devices: Communicates with all devices using NetFlow, jFlow, and sFlow protocols.
- Historical Trends: Analyzes historical data to help with capacity planning.
- Real-time Monitoring: Monitors usage in real-time to help you make timely decisions.
- Abnormal Bandwidth: Identifies abnormal bandwidth usage that could indicate a DDoS attack, unauthorized device, etc.
Why do we recommend it?
Progress WhatsUp Gold uses multiple protocols to communicate with almost any device on your network, including routers and switches. When required, it even automatically configures routers and switches to send data using NetFlow. WhatsUp Gold analyzes this data to identify insights on traffic patterns. It even generates top lists reports that help you better understand who is consuming your bandwidth. Such a structured approach can help you make better decisions.
Who is it recommended for?
WhatsUp Gold is a good choice for IT administrators and network engineers who are responsible for maintaining the security and performance of networks. It also works well for MSPs who have to manage devices on behalf of their clients.
Pros:
- Bandwidth Monitoring: Ensures critical applications run smoothly.
- Unauthorized Traffic: Prevents unauthorized applications from consuming your bandwidth.
- DDoS Attacks: Sends alerts in case of abnormal traffic usage, which could indicate potential DDoS attacks.
- Capacity Planning: Its historical trends support capacity planning.
Cons:
- Complex Setup: The initial configuration can be complex.
WhatsUp Gold offers two plans – Premium and Total Plus. While Premium is ideal for SMBs with a growing infrastructure, Total Plus works well for large organizations that need a comprehensive network monitoring solution. Start a 30-day free trial.
EDITOR'S CHOICE
WhatsUp Gold wins the editor’s choice award for the best bandwidth monitoring tool because it provides all the information you need about network traffic usage and patterns. Armed with this data, you can implement appropriate QoS policies that will ensure your critical applications, like VoIP and voice conferencing, have enough bandwidth. More importantly, you can understand which devices, users, and applications are hogging bandwidth with its Top Lists reports for capacity planning and making informed decisions. It can also monitor networks in real-time to detect abnormal traffic patterns. Since all this information can improve your bandwidth usage, WhatsUp Gold is our top pick.
Download: Get a 30-day FREE trial
Official Site: https://www.whatsupgold.com/
OS: Windows Server 2012 or later
2. AdRem NetCrunch (FREE TRIAL)

AdRem NetCrunch offers bandwidth monitoring using all popular flow technologies. A core pillar of this tool is SNMP, and this means it can collect data from any SNMP-based device and analyze it for insights. Using this information, it can identify information like the top talkers to know who is hogging your bandwidth.
Key Features:
- Traffic Patterns: Analyzes traffic patterns to help understand how much data flows through your network.
- Top Users: Determines the top users, so you can allocate bandwidth accordingly.
- Extensive Coverage: Gathers and analyzes data from any SNMP-based device.
- Detects Issues: Makes it easy to detect issues like misconfigurations.
Why do we recommend it?
We recommend NetCrunch for bandwidth monitoring because it supports all popular flow technologies. What this means is you can get data from almost any device in your network to analyze it for traffic patterns. Also, it works well with most routers and switches.
Another reason to recommend NetCrunch is its automatic layer 2 mapping that provides a visual representation of traffic on each port. It also displays top charts and other information related to bandwidth usage on real-time dashboards.

Who is it recommended for?
NetCrunch is a good choice for MSPs and system administrators who are responsible for monitoring traffic flows and ensuring the availability of bandwidth for critical applications.
Pros:
- Visibility: Helps identify congestion and the top users.
- Traffic Analysis: Uses different patterns to identify malicious or rogue traffic.
- Visualization: Displays all data in clean dashboards
- Automated Mapping: Creates a map of layer 2 devices and their relationships.
Cons:
- Windows Environments: Runs best on Windows environments
NetCrunch starts at $3,200/year for the Professional edition and $5,450 for the Enterprise edition. Download a 30-day free trial.
3. ManageEngine NetFlow Analyzer (FREE TRIAL)

ManageEngine NetFlow Analyzer scans a network and documents all of its switches and routers. The tool notes each interface on each device and records whether it is in use. It also notes the total capacity of each. This inventory forms the basis of the package’s monitoring system.
When we tested ManageEngine NetFlow Analyzer we found the following key features.
Key Features:
- Communicates with switches and routers: Uses NetFlow, IPFIX, sFlow, and J-Flow
- Noted the capacity of each interface: Maintains a record of which are in use
- Rechecks switch data periodically: Updates records if a switch’s status changes
- Compares current traffic volume to potential capacity: Alerts if full utilization is approaching
Why do we recommend it?
ManageEngine NetFlow Analyzer implements traffic volume tracking. The purpose of the tool is to head off overloading, which will result in lost packets. The system also examines the regularity and speed of packet movements around the network. These are factors that are particularly important for VoIP and video streaming.

The inventory shows the live activity on each interface. This details the current traffic volume passing through the interface in each direction and also its speed. Any of the statistics that the monitoring tool gathers can have thresholds placed on them. These will trigger alerts if crossed. Alerts will trigger if, for example, the traffic volume arriving at an interface is a certain percentage of total capacity, such as 80 percent.
If you receive an alert that traffic is surging, you don’t really have much time to do much about it other than, perhaps kill off any batch jobs that might be running so you can laugh it at a less busy time. Over time, you can use the logs of the bandwidth monitoring tool to plan traffic-shaping strategies to prevent overloading from happening again.
Who is it recommended for?
This package is suitable for any business that operates a LAN. It can also measure traffic volumes over wireless networks, however, its main purpose is to record events on wired networks. The top plan, which is called the Enterprise plan, is designed to monitor multiple sites that form a WAN. The other plans do include some internet connection testing services.
Pros:
- Constant monitoring: Shows live traffic volumes per interface
- Connection quality measurements: Quality of Service (QoS) measurements for VoIP
- Protocol analysis: Traffic patterns per application
- Traffic shaping implementation support: Implement queuing to prioritize time-sensitive applications
Cons:
- Not so strong at measuring wireless networks: Extracts statistics from an Access Point (AP) but doesn’t provide signal sampling
The software for the NetFlow Analyzer will run on Windows Server or Linux. It is also available as a service on the AWS Marketplace. ManageEngine provides a Free edition of the NetFlow Analyzer but that is limited to monitoring two interfaces. The 30-day free trial of NetFlow Analyzer provides access to an unlimited version of the tool that models the paid edition for a single site.
4. ManageEngine OpManager (FREE TRIAL)

ManageEngine OpManager’s bandwidth monitoring capabilities offer detailed insights into network bandwidth usage, allowing IT administrators to identify and address bottlenecks efficiently. It provides real-time data on traffic patterns, helping to optimize network performance and prevent congestion.
Key Features:
- Bandwidth Monitoring: Provides detailed insights into network bandwidth usage, helping to identify bottlenecks.
- Network Performance Reports: Generates comprehensive reports on network performance metrics.
- Alerting System: Customizable alerts for various network issues.
- Device Discovery: Automatically discovers and maps network devices.
- Integration Capabilities: Seamlessly integrates with other IT management tools.
Why do we recommend it?
We recommend ManageEngine OpManager for its robust bandwidth monitoring capabilities, which provide critical insights into network performance. Its comprehensive alerting system also helps IT teams respond swiftly to issues.

The tool also generates comprehensive reports on bandwidth consumption, enabling better resource allocation and network planning. Additionally, customizable alerts ensure that administrators are promptly notified of any significant changes or issues in bandwidth usage.
Who is it recommended for?
ManageEngine OpManager is ideal for IT administrators and network managers who need detailed monitoring and reporting on network bandwidth and performance. It’s particularly useful for organizations with complex network infrastructures.
Pros:
- Detailed Bandwidth Insights: Provides in-depth analysis of bandwidth usage across the network.
- Comprehensive Reports: Generates detailed reports on various network performance metrics, aiding in performance assessment.
- Custom Alerts: Offers customizable alerts to quickly address network issues.
- Automatic Device Discovery: Simplifies network management by automatically discovering and mapping devices.
- Integration-Friendly: Easily integrates with other IT management tools for enhanced functionality.
Cons:
- Complex Setup: Initial setup and configuration can be time-consuming and complex.
Get started by registering for a 30-day free trial.
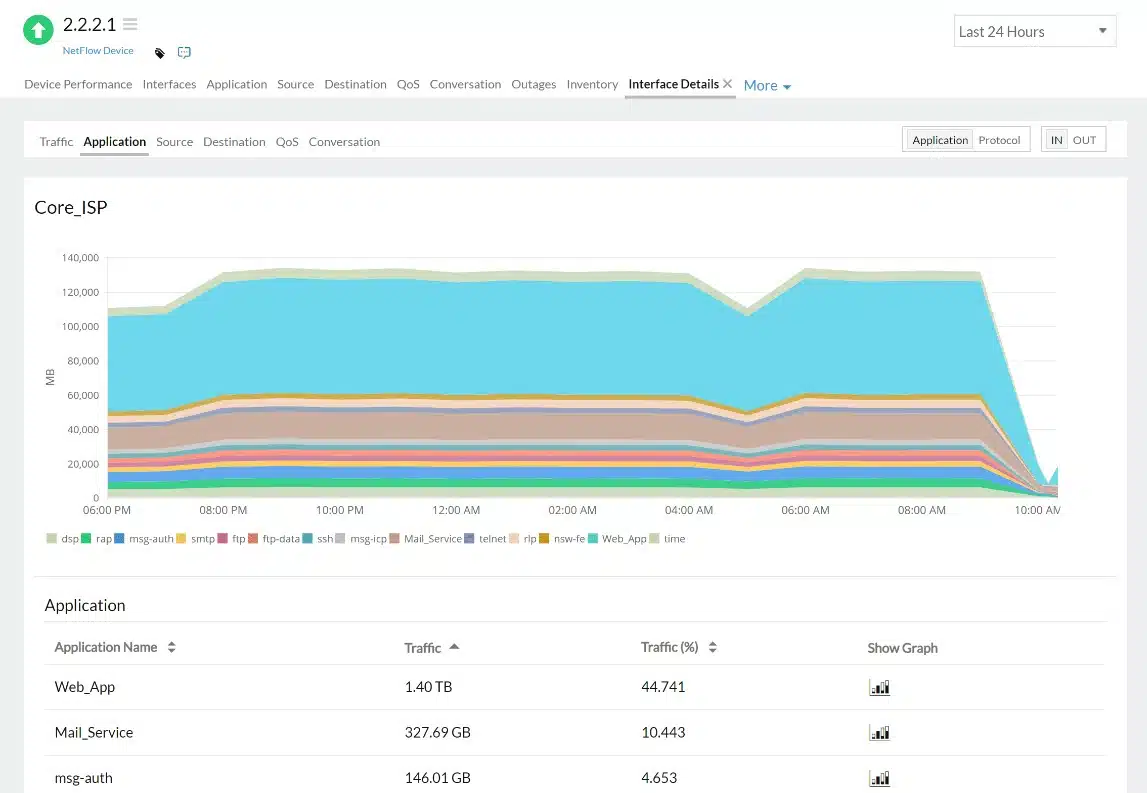
5. Site24x7 Network Bandwidth Monitoring (FREE TRIAL)
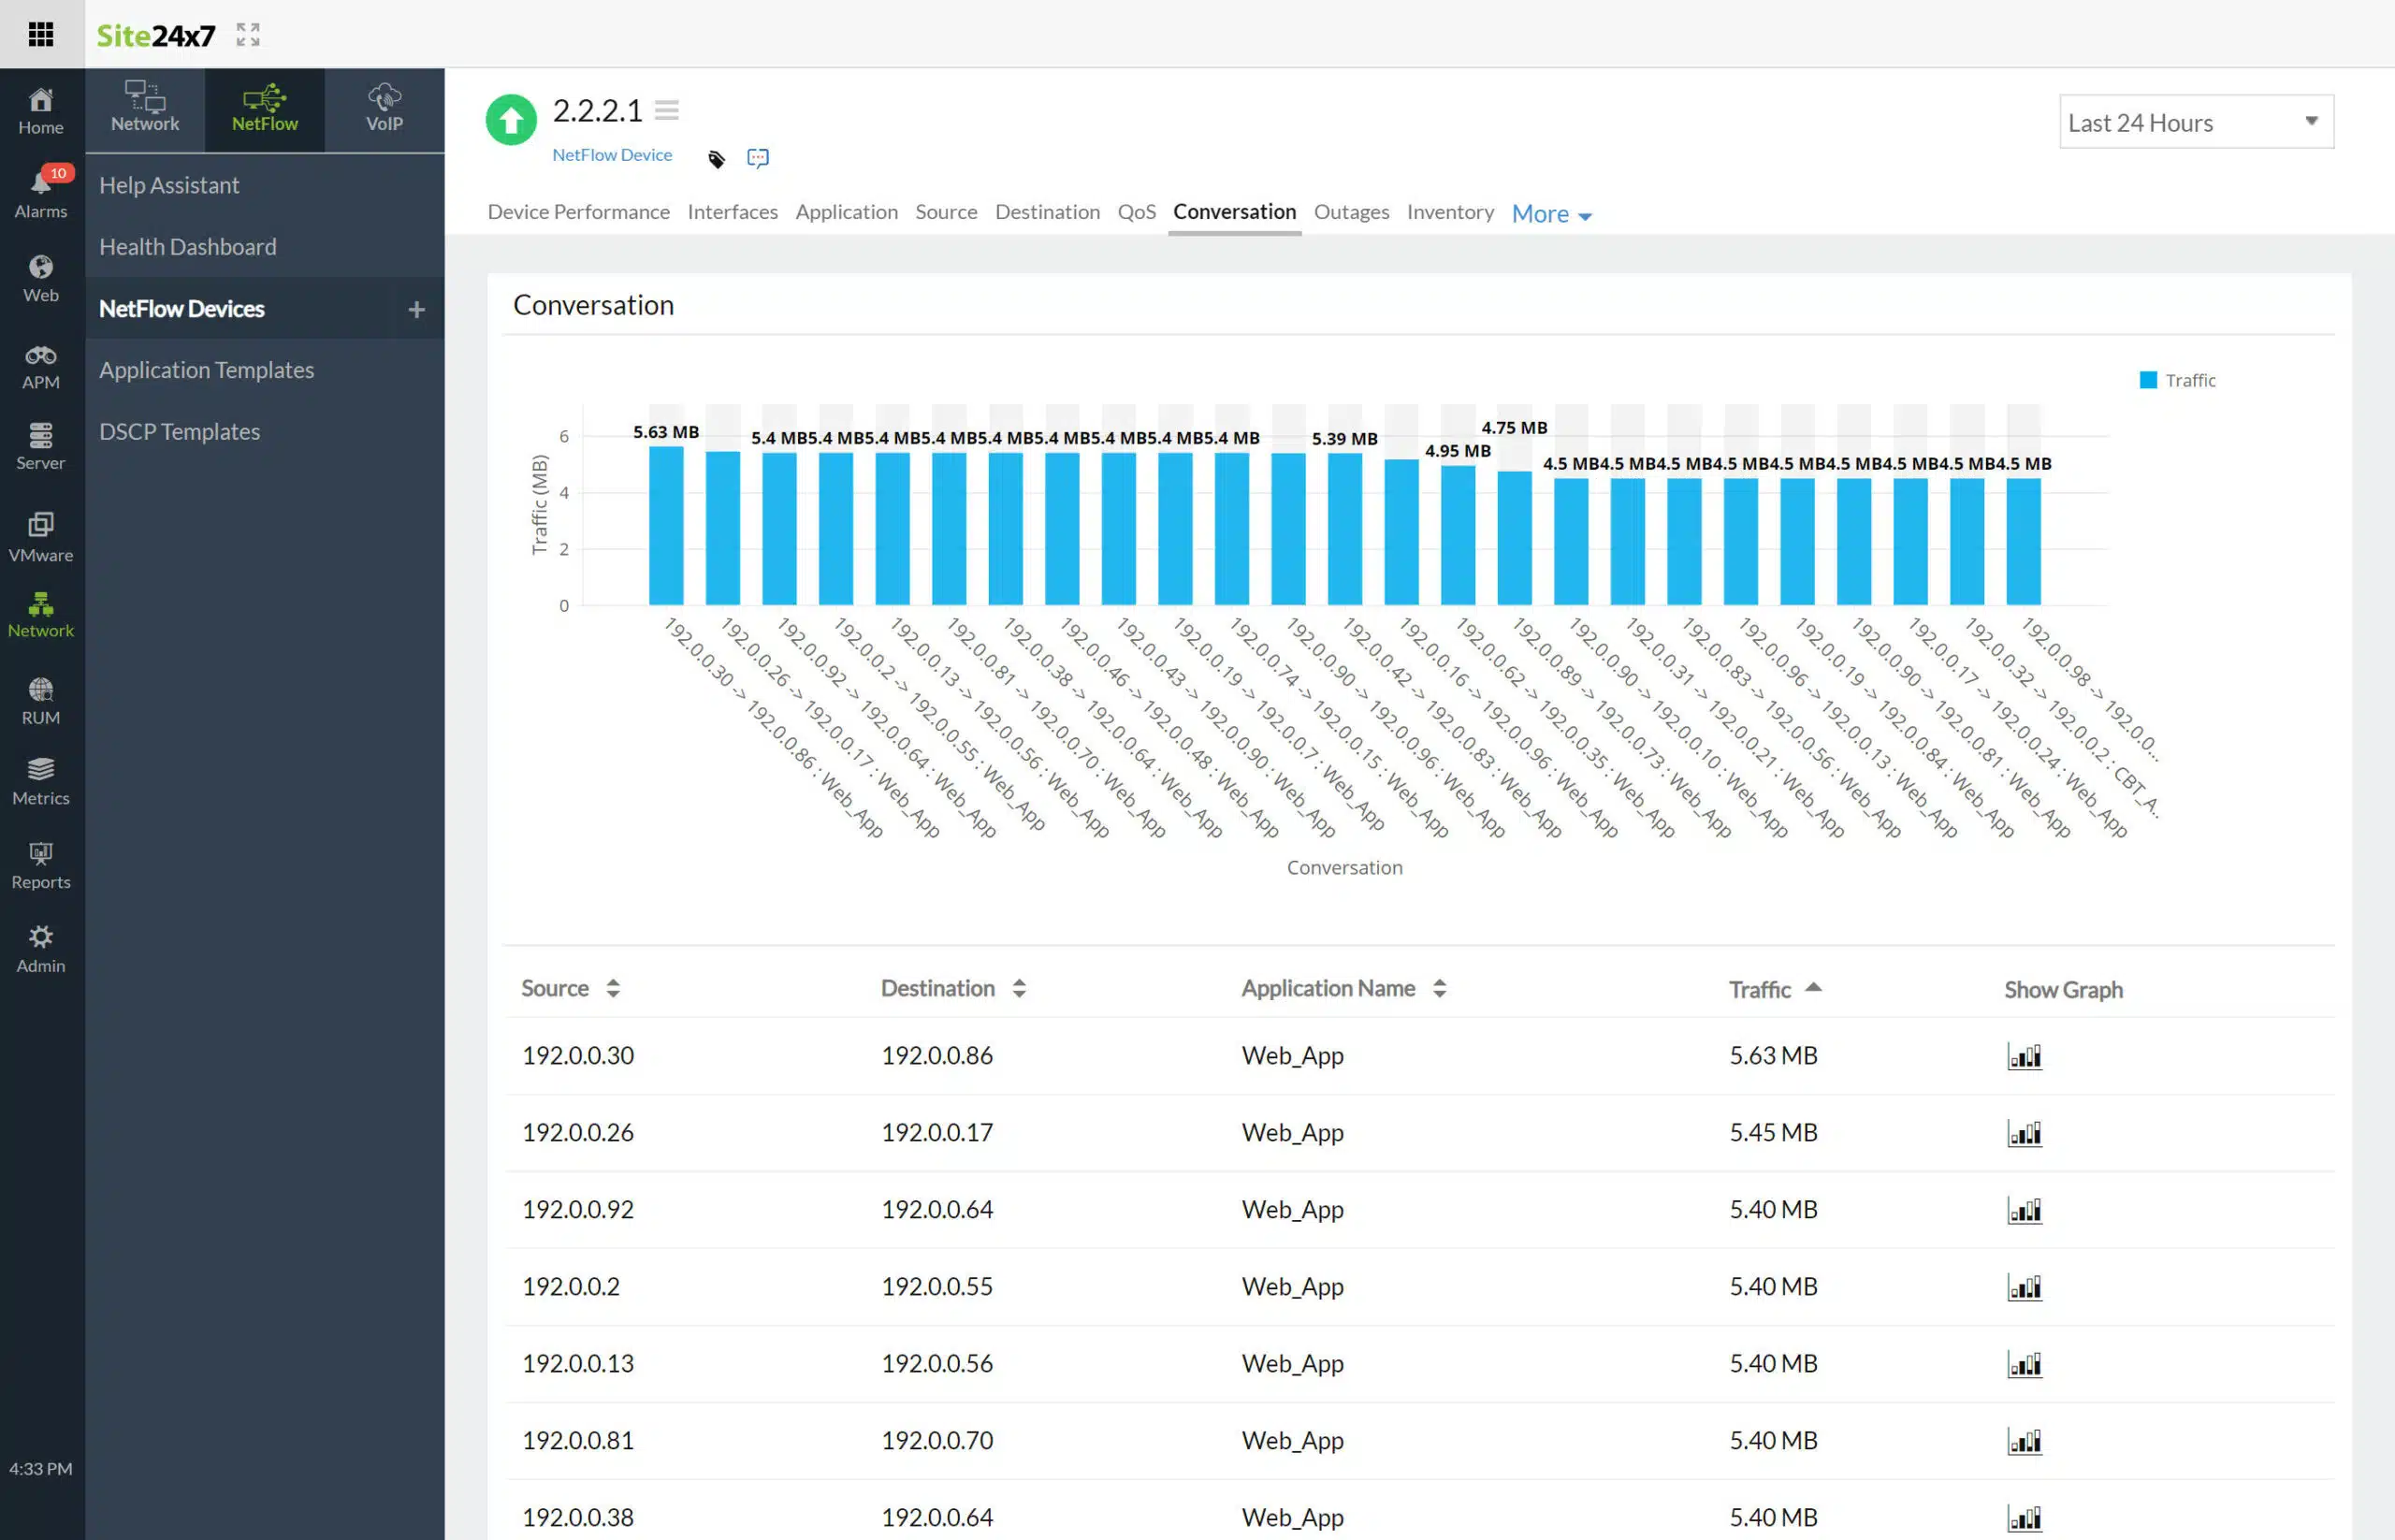
The Site24x7 Network Bandwidth Monitoring package is delivered from the cloud as part of a full-stack observability bundle that also provides network device monitoring and application and server monitoring. This system uses an on-premises collector that uploads data to the Site24x7 cloud server for processing.
When we tested Network Bandwidth Monitoring we found the following key features.
Key Features:
- Capacity Utilization Tracking: Monitors and reports on traffic capacity utilization for effective bandwidth management.
- Overload Alert System: Detects potential overloads, ensuring timely interventions to prevent network issues.
- Protocol-Specific Analysis: Offers detailed insights into network traffic based on different protocols.
The cloud-based console is accessed through any standard browser and it shows traffic data per switch interface. Data is presented in both tables and charts and it is stored for historical analysis as well as being shown live in the dashboard. As well as traffic throughput per link, the tool will slice metrics to show the top traffic generators per source, destination, and protocol.
Why do we recommend it?
The Site24x7 Network Bandwidth Monitoring service is a live throughput monitor and a capacity planning tool. The system compares current traffic volume with interface capacity to look out for approaching overloading. If an interface can’t process packets fast enough, those packets get dropped. This will cause retransmission, generating even more traffic.
This package can operate on a multi-vendor site because it is able to communicate with switches through the NetFlow, IPFIX, sFlow, J-Flow, cFlow, NetStream, and AppFlow protocols – not all manufacturers have the same protocol loaded on their devices.
The Network Bandwidth Monitoring system examines each link and you can also test traffic performance end-to-end across the network with Ping.
The system compares current throughput to interface capacity and will raise an alert if a utilization threshold gets crossed. You can adjust threshold levels and also specify that alerts are forwarded as notifications by email, SMS, voice message, or Slack post.
Who is it recommended for?
This package is part of a bundle of network monitoring and management tools and its plans are sized to be suitable for small businesses. Larger companies pay for capacity expansions, so all sizes and types of businesses that have networks are catered to.
During our testing, we identified the following pros and cons related to Site24x7.
Bundled Tool Dependency: Only available as part of a larger package, limiting its standalone utility.
Complex Plan Structure: Offers numerous plans, which can be overwhelming and confusing for potential users.
Pros:
- Effective Capacity Planning: Utilizes historical data for insightful capacity planning and management.
- Comprehensive Overload Alerts: Provides timely alerts for approaching switch capacity exhaustion, enhancing network reliability.
- Network Path Testing Feature: Includes Ping for end-to-end network performance testing, adding an extra layer of network diagnostics.
Cons:
- Bundled Tool Dependency: Only available as part of a larger package, limiting its standalone utility.
- Complex Plan Structure: Offers numerous plans, which can be overwhelming and confusing for potential users.
Site24x7 offers a large number of plans and just about all of them include the Network Bandwidth Monitoring service. You can try any package with a 30-day free trial.
6. Paessler PRTG Network Monitor (FREE TRIAL)
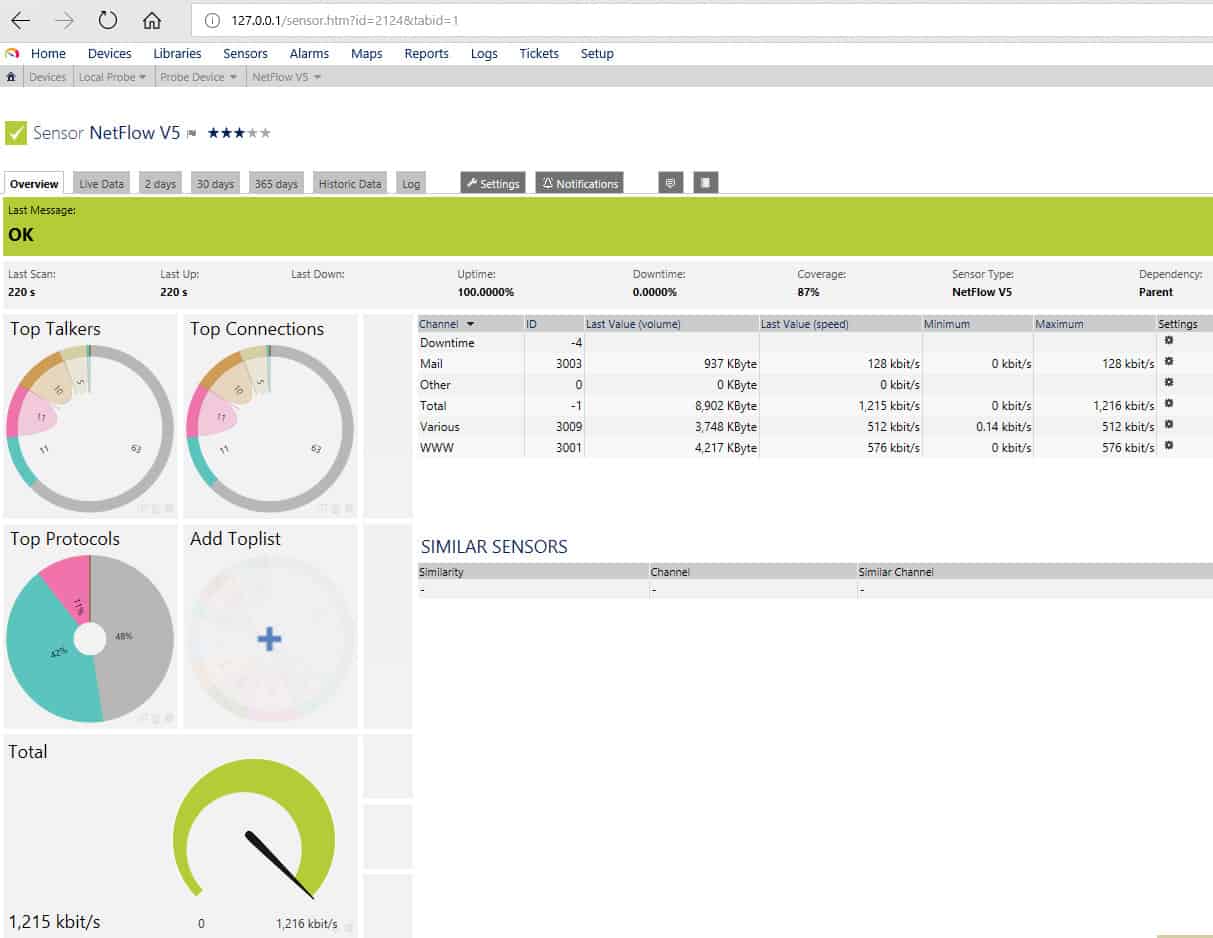
The Paessler PRTG Network Monitor is a “batteries included” solution that monitors bandwidth utilization, the health of devices on your network, and more. The free version is limited to 100 sensors after the first month; since a sensor is an individual data stream, each device will typically require several sensors.
When we tested PRTG Network Monitor we found the following key features.
Key Features:
- Diverse Protocol Support: Includes NetFlow and sFlow among others, for comprehensive network monitoring.
- Packet Capture Functionality: Enables detailed traffic analysis through packet capture.
- Real-Time Traffic Visualization: Offers live traffic flow graphics for immediate understanding of network status.
- Link Overload Identification: Helps identify overloaded network links to prevent traffic bottlenecks.
Why do we recommend it?
Paessler PRTG Network Monitor is a bundle of monitoring systems, each of which is called a “sensor.” Every user of PRTG gets the same big software package and then customizes the system by deciding which of those sensors to activate. The system automatically scans all devices, creates a network inventory, and draws up a topology map. If you turn on device sampling sensors, you get a traffic analyzer. These sensors include a Ping monitor, a packet capture tool, and NetFlow, sFlow, J-Flow, and IPFIX systems. The combination of these live monitoring and research tools creates an excellent system for network traffic monitoring and analysis.
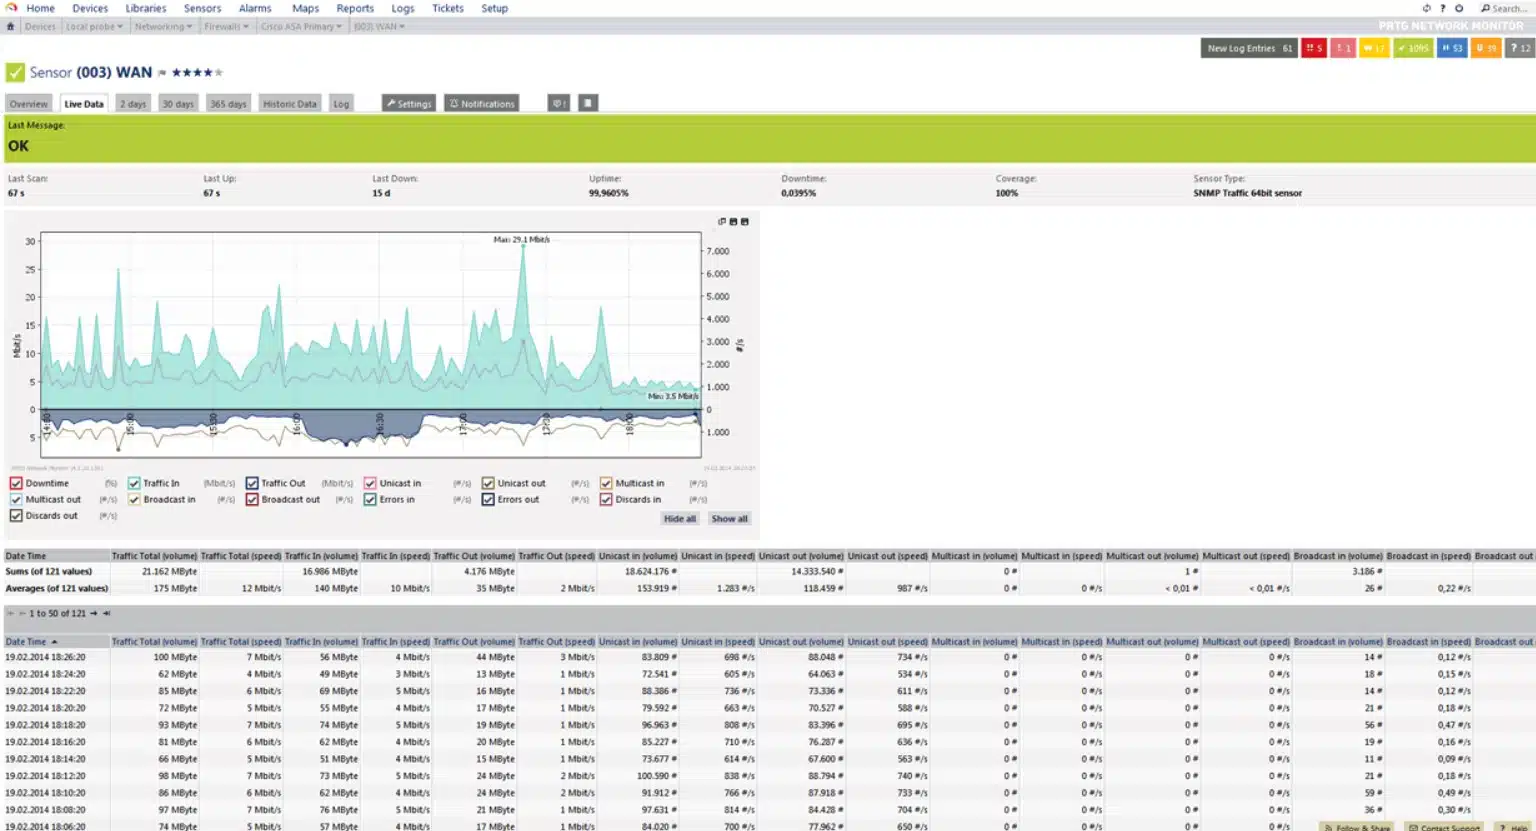
The PRTG Network Monitor runs on Windows. It uses SNMP, WMI, NetFlow, sFlow, and packet sniffing. Setting up the tool is a bit complex but a setup wizard and how-to video are provided.
Who is it recommended for?
PRTG is a close competitor to SolarWinds Network Performance Monitor and the NetFlow Traffic Analyzer. This system has a couple of advantages over SolarWinds systems when appealing to potential buyers. Both companies produce their tools for Windows Server. However, PRTG is also offered as a SaaS platform. The PRTG Tool is proxied according to the number of sensors that you want to activate and if you only activate 100 of them, you never have to pay for the system – this is appealing to small businesses.
Pros:
- Versatile Free Version: Offers a free trial that converts to a freeware version, suitable for small-scale networks.
- Custom Sensor Support: Allows creation of custom sensors for tailored monitoring, especially beneficial for unique network setups.
- Comprehensive Ecosystem Integration: Integrates well within the broader PRTG ecosystem, offering a holistic monitoring solution.
Cons:
- Complex Interface: The feature-rich interface may be overwhelming for new users, requiring a learning curve.
- Limitations in Free Version: The freeware version has sensor limitations, potentially restricting its utility for larger networks.
The free version of PRTG Network Monitor provides a well-stocked toolbox for monitoring a small network, download the 30-day free trial. For more details, see The best free NetFlow analyzers and collectors for Windows.
7. Datadog Network Performance Monitoring
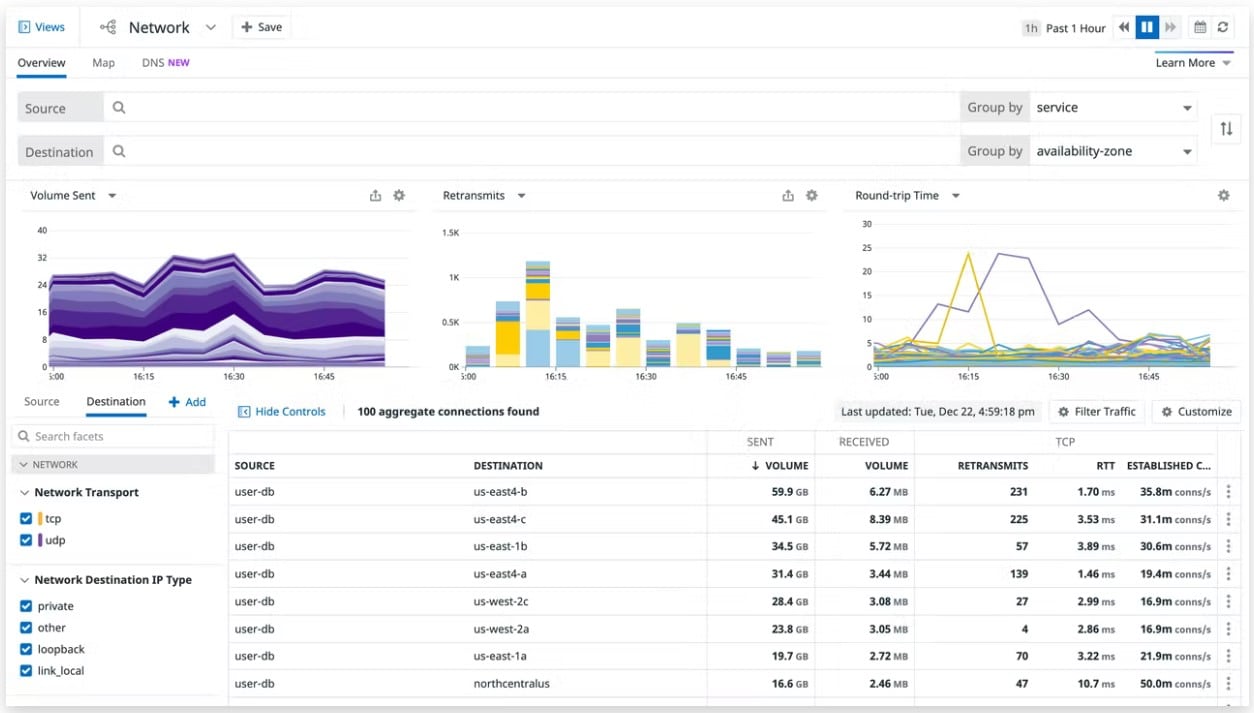
Datadog Network Performance Monitoring watches over traffic across a network and also out on the internet to remote sites and cloud resources.
This package creates a network map and shows you traffic flows on each stretch in a live readout. Click on a device to get a detailed view of traffic volumes. This feature is called Flow Analytics. The system also generates graphs of traffic throughput at each device.
The visual data representations make traffic activity very easy to comprehend. This service can give more detailed data if you access traffic tagging features.
The information given by the Network Performance Monitoring system gives you data on packet loss, latency, and jitter on each connection over time.
When we tested Network Performance Monitoring we found the following key features.
Key Features:
- Comprehensive Traffic Monitoring: Tracks network traffic volume across various links for in-depth analysis.
- Internet Connection Analysis: Examines performance metrics of internet connections, essential for cloud-centric operations.
- Performance Alerts: Automated alerts for network issues, enhancing proactive network management.
Why do we recommend it?
Datadog Network Performance Monitoring is the only package on this list that is purely delivered as a SaaS system. This competes with the SaaS version of PRTG but it doesn’t have an on-premises version. The Datadog system provides traffic sampling and analysis – this is a little unusual because the “Network Performance Monitor” title is used by other providers to denote an SNMP-based device status monitor. Datadog offers a Network Device Monitoring package as a separate module. You don’t have to subscribe to both units – it is possible to just use the Network Performance Monitoring tool.
Analytical features in the dashboard allow you to categorize traffic and get reports on volumes to, from, or between IP addresses. You can also see traffic per application or port.

Other features in this traffic monitoring system include DNS performance and cloud platform traffic activity for systems such as load balancers.
Any of the metrics that Datadog Network Performance Monitoring can have expectation thresholds placed on them. When crossed, these levels trip alerts. You can get these alerts forwarded to you by email or SMS, so you don’t need to watch the monitor all of the time – this feature automates network bandwidth monitoring.
Who is it recommended for?
Many businesses now prefer to use cloud-based services and the Datadog system is ideal for those companies. The Datadog platform is very large with a lot of system monitoring and management tools and the provider has also expanded into cybersecurity tools. The Datadog Network Performance Monitoring system is priced per month per device. You get all of the utilities of the package no matter how few devices you have, which makes this system suitable for businesses of all sizes.
During our testing, we identified the following pros and cons related to Network Performance Monitoring.
Pros:
- Detailed Traffic Insights: Provides granular data on traffic flows per link, application, or port number, facilitating precise network management.
- Cloud-First Approach: Ideal for businesses focused on cloud-based solutions, offering extensive support for cloud network monitoring.
- Graphical Data Representations: Intuitive graphs for easy comprehension of network performance and internet connection quality.
Cons:
- Extra Setup for NetFlow: Requires additional setup for NetFlow integration, potentially complicating the deployment process for some network environments.
Datadog Network Performance is a subscription service with a rate per host per month. Datadog also offers a Network Device Monitoring system. Both of these tools can be experienced on a 14-day free trial.
8. ManageEngine Bandwidth Monitoring Tool
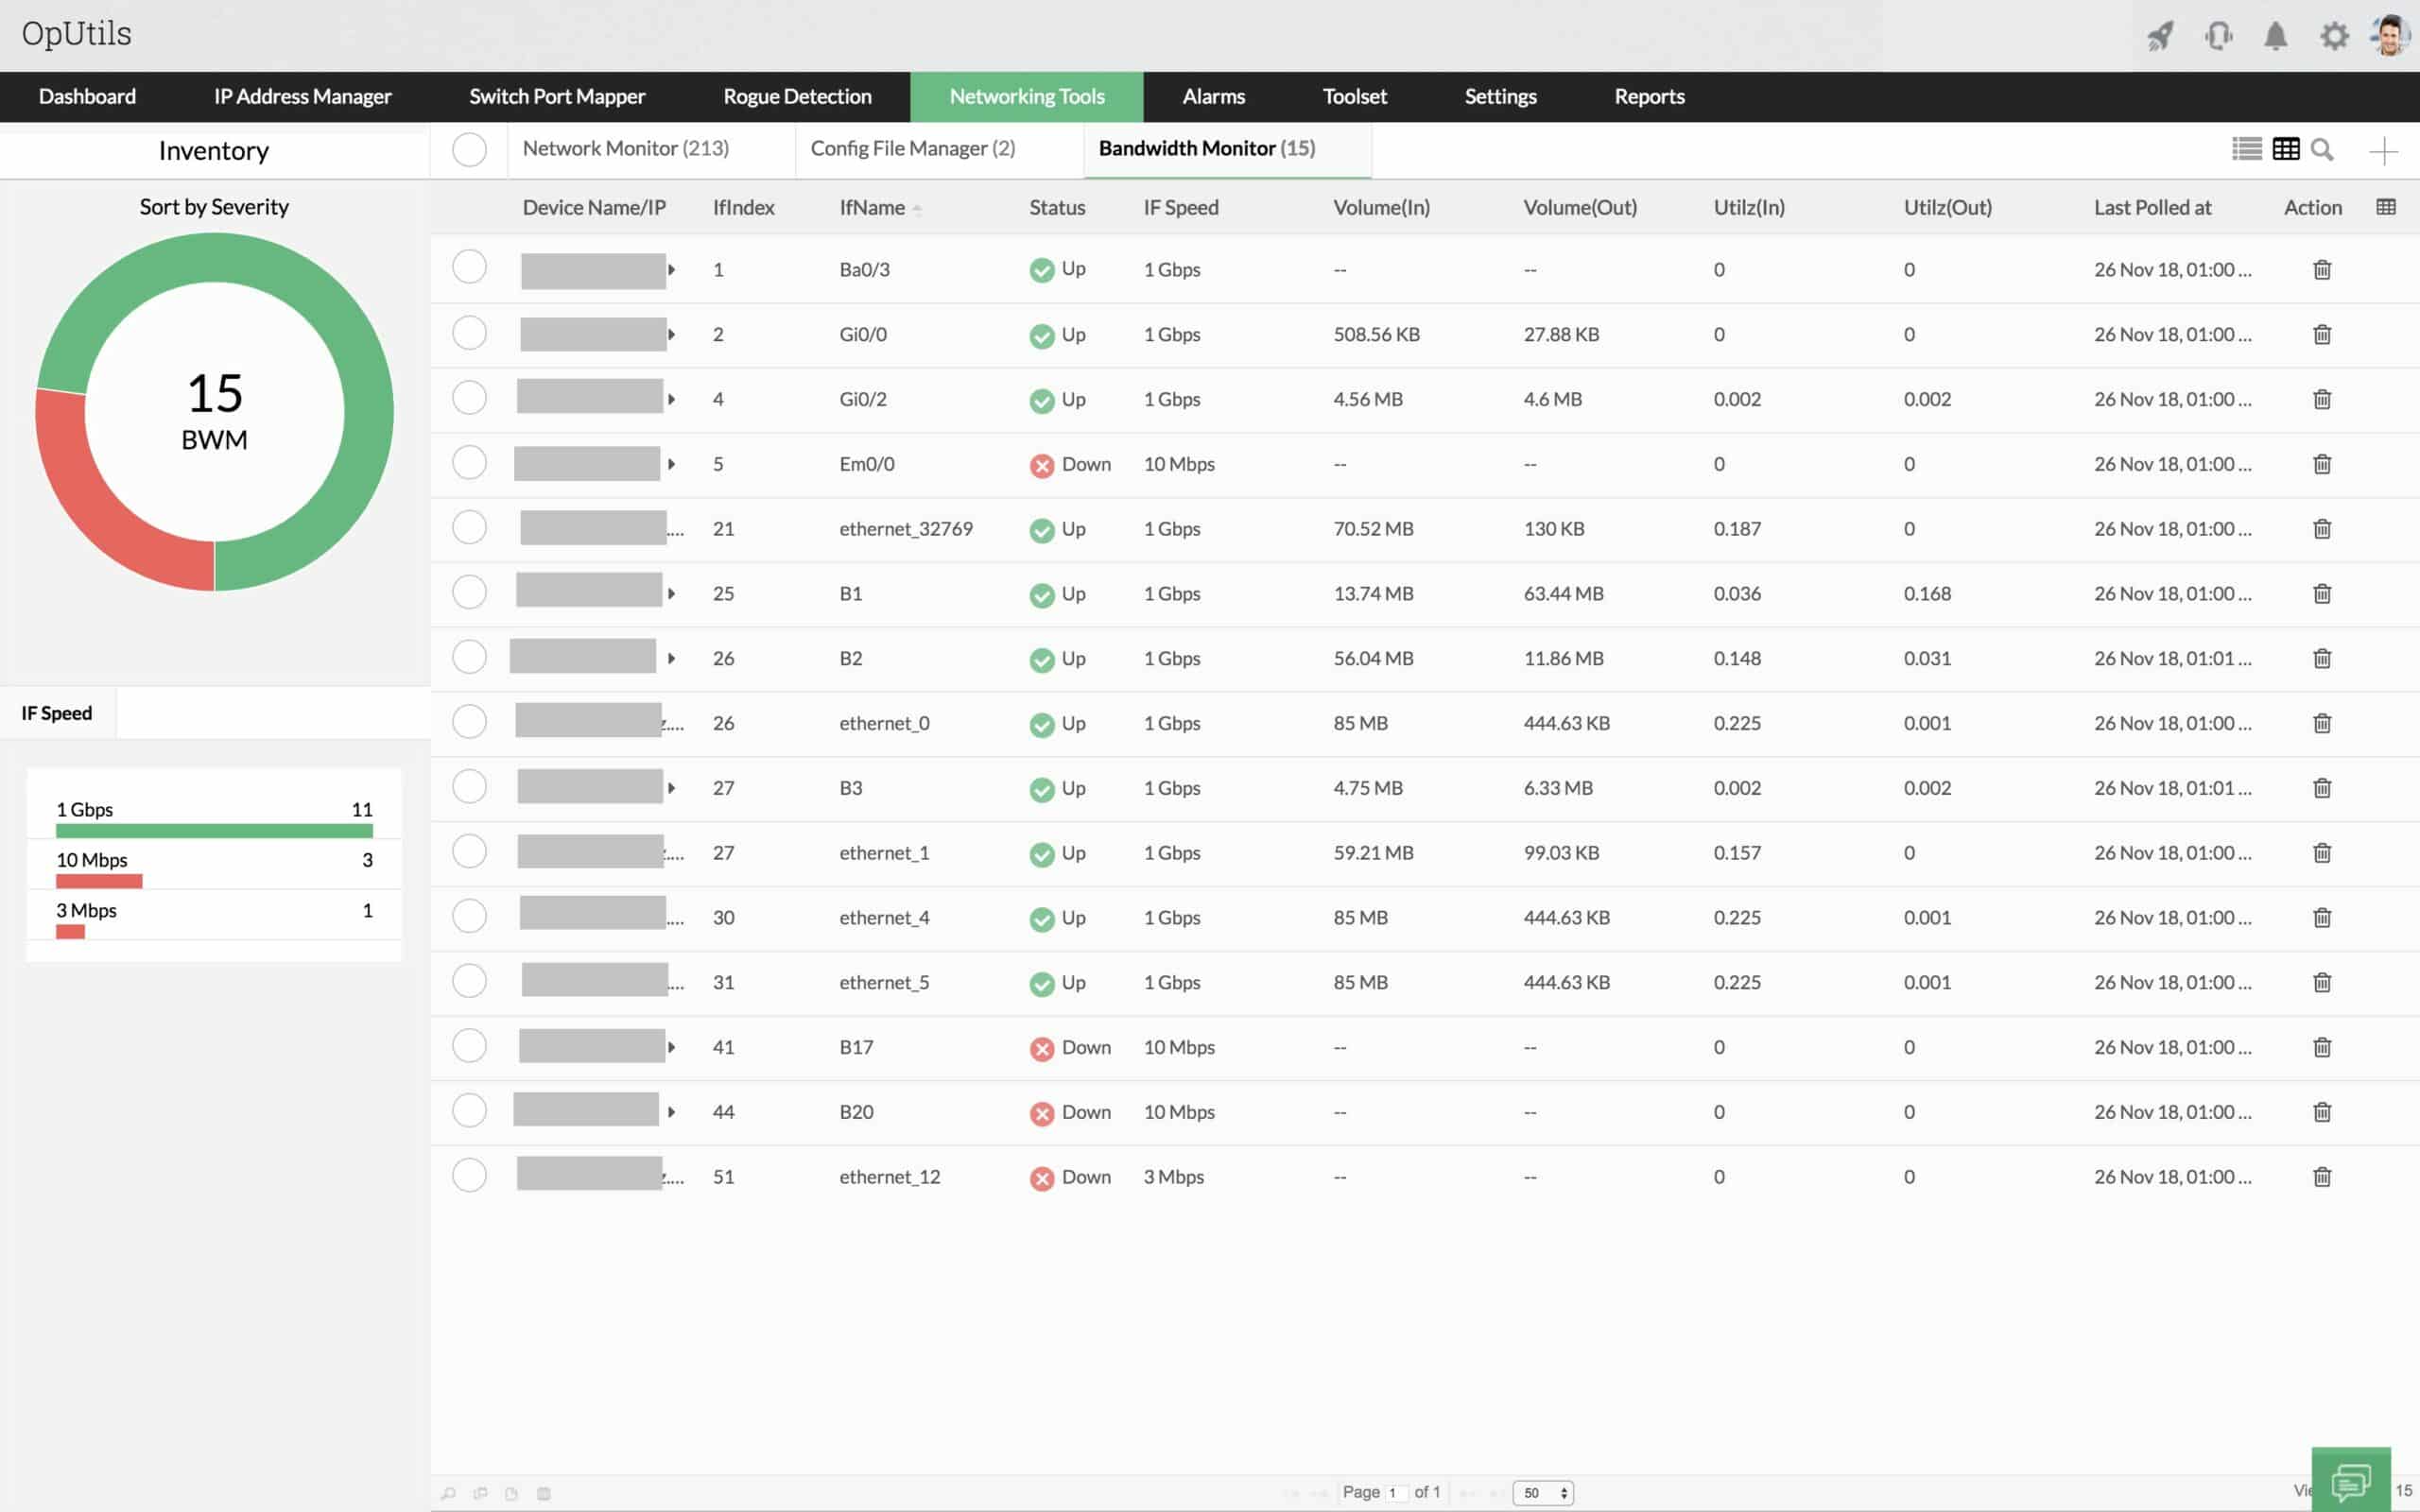
ManageEngine produces a full network management suite and offers free versions of some of their tools. In our article on the best free NetFlow analyzers and collectors for Windows, we looked at the ManageEngine NetFlow Analyzer which provides real-time visibility into network bandwidth and traffic patterns, when you have devices that support NetFlow. The NetFlow Analyzer displays traffic by applications, conversations, protocols, etc; it can alert you to problems and has a range of report-generation options. Here we will focus on the Bandwidth Monitoring tool that is part of the free edition of ManageEngine OpUtils.
When we tested Bandwidth Monitoring we found the following key features.
Key Features:
- SNMP-Based Monitoring: Utilizes SNMP for efficient and reliable network monitoring.
- Interface-Level Statistics: Offers detailed insights at the interface level, aiding in precise bandwidth management.
- Traffic Analysis Per Link: Enables focused monitoring and analysis of traffic on specific network links.

The Network Bandwidth Monitoring tool leverages SNMP. It runs on Windows or Linux, and it is also available as a service on AWS.
Setting up the OpManager is a multi-step process but not overly complex. Once you provide the subnet and SNMP parameters, OpManager will scan your subnets and discover your devices. Then, from the inventory tab, you can check the status of devices’ interfaces. You can view graphs and tables of network usage, speed, and bandwidth, as well as device hardware metrics, either rolled up at the device level or drilling down to a particular interface.
At the interface level, you can generate reports showing bandwidth from the past 12 hours up to the past month. You can also set thresholds to receive automated alert email or SMS messages. By monitoring the gateway to your ISP, you can check your internet traffic usage and how much bandwidth you actually receive.
Why do we recommend it?
ManageEngine Network Bandwidth Monitor is a small utility that comes as a surprise added extra in the OpUtils package. The OpUtils system is concerned with IP address management and switch port mapping. The bandwidth monitoring service fits with the switch port mapping system because it details activity per interface – which means per port. This system isn’t the most detailed network bandwidth monitoring system offered by ManageEngine — that is the NetFlow Analyzer.
The Bandwidth Monitoring tool combines with the other features of the free version of ManageEngine OpManager. This provides you with a well-rounded suite of capabilities for monitoring three devices or less on a small network.
Who is it recommended for?
Large businesses that want detailed bandwidth analysis that utilizes the NetFlow system and related protocols should opt for ManageEngine NetFlow Analyzer. That is much more like the SolarWinds NetFlow Traffic Analyzer. This tool is a cost saver for those businesses that don’t want to pay for a full bandwidth analyzer because it is essentially free when you buy the IP address manager. OpUtils has a free edition but the Network Bandwidth Monitor isn’t included in that package.
During our testing, we identified the following pros and cons related to Bandwidth Monitoring.
Pros:
- Comprehensive Network Management Suite: Part of a larger set of network management tools, offering a holistic approach to network monitoring.
- User-Friendly Interface: Combines visualizations with real-time logs for an intuitive user experience.
- Flexible Visualization Tools: Facilitates easy identification of traffic patterns and peak usage times, enhancing network planning.
Cons:
- Limited Inventory Management: The inventory management feature could be improved for better usability and efficiency.
9. SolarWinds NetFlow Traffic Analyzer
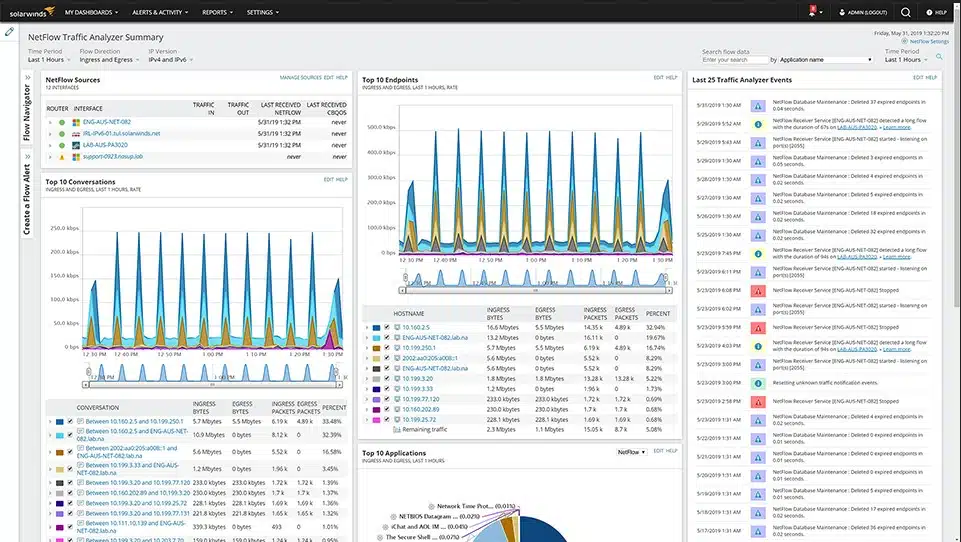
The SolarWinds NetFlow Traffic Analyzer offers full bandwidth monitoring and management features. The tool communicates with switches and routers through a series of communication protocols that were created by device manufacturers. These are NetFlow, J-Flow, sFlow, NetStream, and IPFIX. This range of capabilities enables the system to monitor a multi-vendor network.
When we tested NetFlow Traffic Analyzer we found the following key features.
Key Features:
- Multi-Protocol Support: Supports NetFlow, sFlow, J-Flow, IPFIX, and NetStream for versatile network monitoring.
- Comprehensive Traffic Analysis: Offers detailed insights into traffic patterns for effective network management.
- Link-Specific Views: Allows monitoring of individual network links for targeted troubleshooting.
- Application/IP Address Data: Provides granular traffic data per application or IP address.
- Traffic Shaping Capabilities: Enables implementation of traffic shaping strategies to optimize network performance.
Why do we recommend it?
SolarWinds NetFlow Traffic Analyzer offers more than just NetFlow sampling. While NetFlow is a proprietary system for Cisco network devices, there are some other manufacturers that put NetFlow functionality into their appliances. However, to get a full network analysis service in a multi-provider network, you need wider capabilities and the SolarWinds system has that with its sFlow, NetStream, J-Flow, and IPFIX communication abilities. This system provides methods to analyze traffic patterns end-to-end across a network or just look at one link. You can use the tool for capacity planning and traffic shaping to avoid circumstances where packets are lost due to the equipment being overloaded.
As well as having the availability to use many different data sampling protocols, this service can operate with both IPv4 and IPv6 addresses. It is a flexible package that can adapt to all of the hardware used on your network.
The monitor can examine traffic flow rates on each link of your network. Taking this information in conjunction with switch and cable capacity will tell you when links get overloaded and where bottlenecks occur.
Once problems are noticed, you can use the traffic data segmentation features in the SolarWinds package to look for the main sources of all of that traffic.
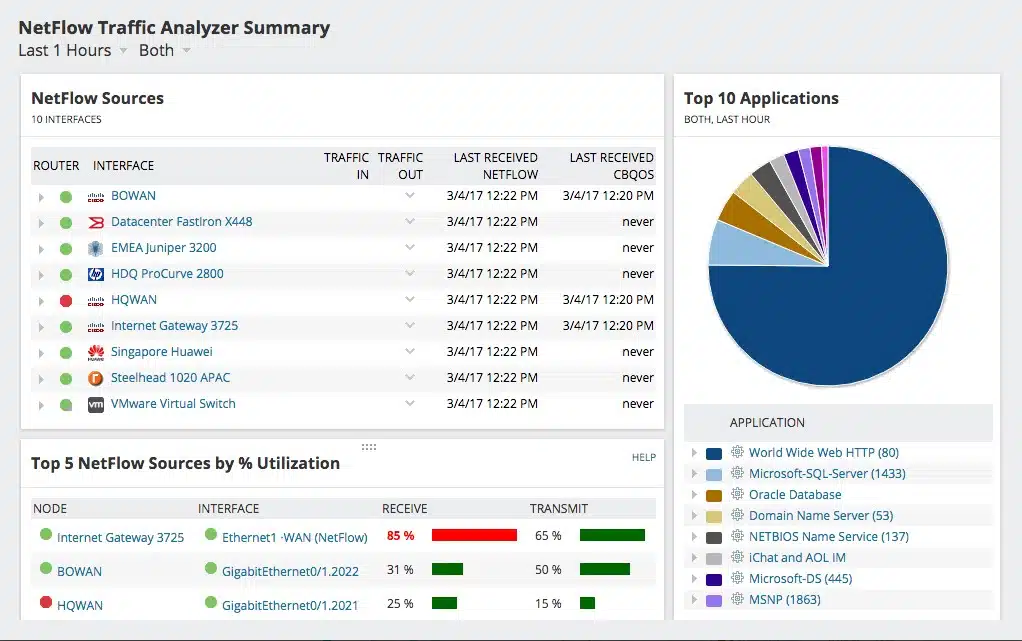
See traffic by endpoint, by source IP address, and by application, and then you can try to mitigate the demand on the network or plan for greater capacity.
The NetFlow Traffic Analyzer includes a series of thresholds that you can activate. These trigger alerts when crossed, so you can assume that all is well with the network unless you receive a notification by email or SMS.
If you implement queuing to prioritize specific applications, such as VoIP, you can take performance snapshots of application traffic at a switch, make adjustments to your queuing system, take another snapshot, and then compare the results.
The analysis features in this tool include a system called PerfStack, which allows you to specify conditions to monitor, get a time-series graph of that activity and then set up another graph of related activity and place that just below the first. With this tool you can view the synchronicity between different conditions on the network and work out how to improve traffic management.
The NetFlow Traffic Analyzer is part of a suite of tools produced by SolarWinds on a common platform, called Orion. This means that separate modules can combine and produce cross-over services. A good combination with the NetFlow Traffic Analyzer is the SolarWinds Network Performance Manager. The two modules can be bought in a bundle, called the Network Bandwidth Analyzer Pack.
Who is it recommended for?
SolarWinds NetFlow Traffic Analyzer is a great tool for network management because it incorporates an alerting mechanism that is triggered by irregular traffic patterns, such as packet loss or device overloading. This is an on-premises package that runs on Windows Server. Another requirement to use this tool is that you also need to have the SolarWinds Network Performance Monitor installed. This requirement reduces the target audience for the NetFlow Traffic Analyzer because it creates a bundle that is considerably more expensive than many other tools on this list. However, large corporations that have the budget for these two tools get a combination of device status checks and traffic assessments.
During our testing, we identified the following pros and cons related to NetFlow Traffic Analyzer.
Pros:
- Extensive Protocol Compatibility: Accommodates various communication protocols, enhancing its utility in multi-vendor environments.
- End-to-End Traffic Analysis: Allows for comprehensive analysis of traffic patterns across the entire network.
- Effective Capacity Planning: Aids in planning for network capacity and avoiding packet loss due to overloading.
- PerfStack Analysis Tool: Includes PerfStack for comparative analysis of network conditions and traffic management improvements.
Cons:
- Windows Server Dependency: Limited to Windows Server environments, restricting its deployment in diverse IT infrastructures.
- Requirement for Additional SolarWinds Tool: Necessitates SolarWinds Network Performance Monitor for full functionality, potentially increasing overall costs.
SolarWinds NetFlow Traffic Analyzer runs on Windows Server. You can appraise the package on a 30-day free trial.
10. ntopng
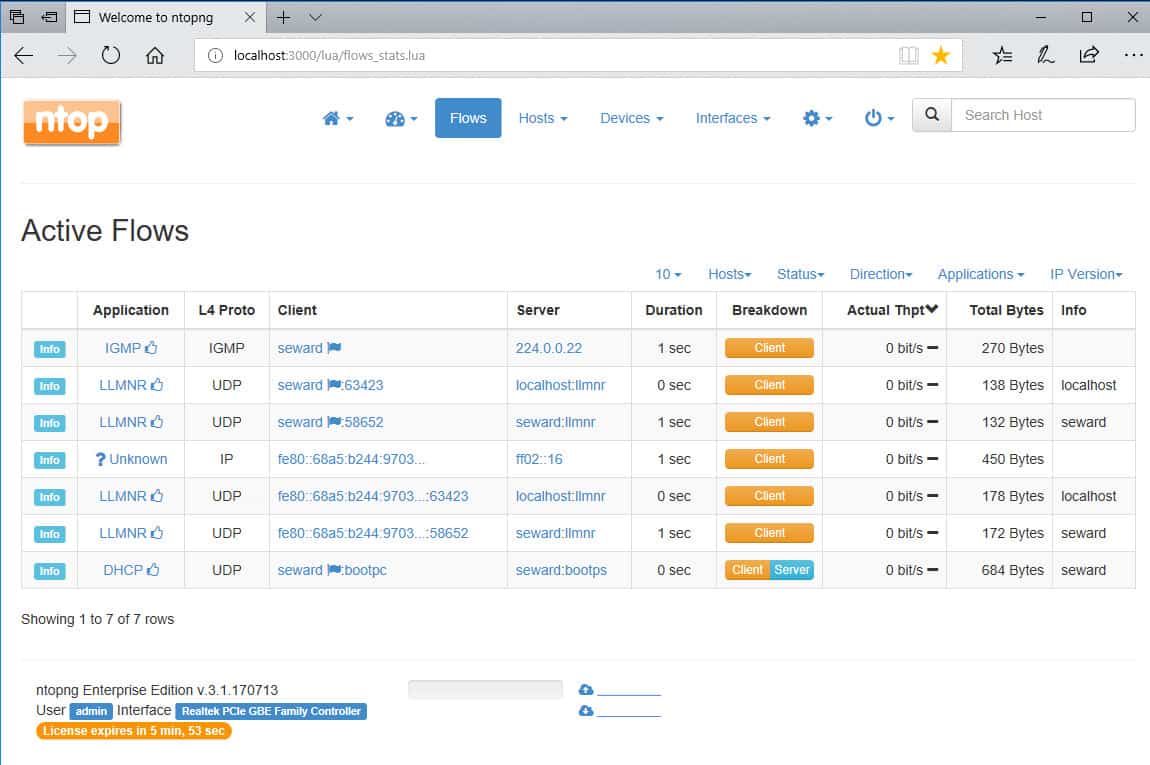
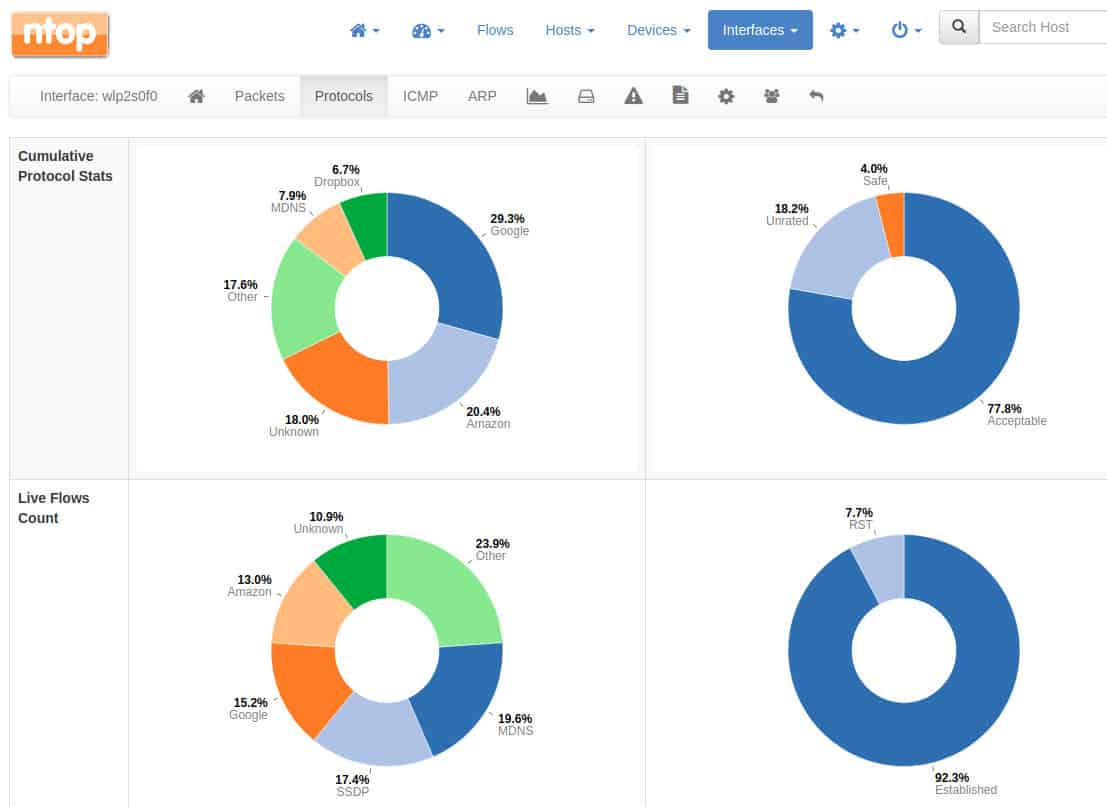
ntopng is an open-source web-based traffic analysis tool. The community version of ntopng is free; the professional (small business) and enterprise versions require buying a license. All versions do packet capture; the enterprise version also uses SNMP. To receive flow data, ntopng depends on nProbe; a fully-functioning version of nProbe requires a paid license. Licenses are free to educational and nonprofit organizations.
When we tested ntopng we found the following key features.
Key Features:
- Packet Capture Capabilities: Provides detailed network analysis through packet capture.
- Flow Statistics Monitoring: Offers insights into traffic flow for comprehensive network oversight.
- Free Community Edition: Available as a free version for small-scale or budget-conscious deployments.
ntopng’s web-based user interface rolls up data into traffic (e.g., top talkers), flows, hosts, devices, and interfaces.
Why do we recommend it?
The ntopng system is a similar service to the ManageEngine Bandwidth Monitor because it doesn’t use NetFlow or related traffic statistics systems but gets information from SNMP. The tool also implements a form of packet sniffing that counts packets passing on the network and categorizes their numbers down to protocol level. The system also uses systems such as ICMP Ping to test network performance. In a sense, ntopng is reinventing the wheel because all of the packet statistics recording that it performs through packet sniffing is exactly the type of information that routers compile with NetFlow.
ntopng is a richly-featured open-source traffic and bandwidth monitoring tool. All editions are available for installation on Windows, Linux, Unix, macOS, and RaspbianOS.
Who is it recommended for?
The Community Edition of ntopng is limited to monitoring eight interfaces. That is a small number for any network and so only the smallest of businesses would be able to use that version. The full paid version has some attractive graphics and it also provides alerts. However, most network managers would get better service from the Datadog Network Performance Monitor at a reasonable price.
During our testing, we identified the following pros and cons related to ntopng.
Limited Suitability for Large Networks: Not the best fit for larger, multi-site networks due to its scale limitations.
Basic Packet Capture Features: Packet capture capabilities may not meet the needs of more complex network environments.
User Interface Needs Improvement: While user-friendly, the interface could benefit from enhancements for better user experience.
Pros:
- Open-Source Transparency: Offers full transparency, being an open-source project.
- Flexible Licensing for Nonprofits/Education: Special licensing options make it accessible for educational institutions and nonprofits.
- Free Version for Small Networks: Suitable for small networks with a limited number of interfaces.
Cons:
- Limited Suitability for Large Networks: Not the best fit for larger, multi-site networks due to its scale limitations.
- Basic Packet Capture Features: Packet capture capabilities may not meet the needs of more complex network environments.
- User Interface Needs Improvement: While user-friendly, the interface could benefit from enhancements for better user experience.
11. Nagios
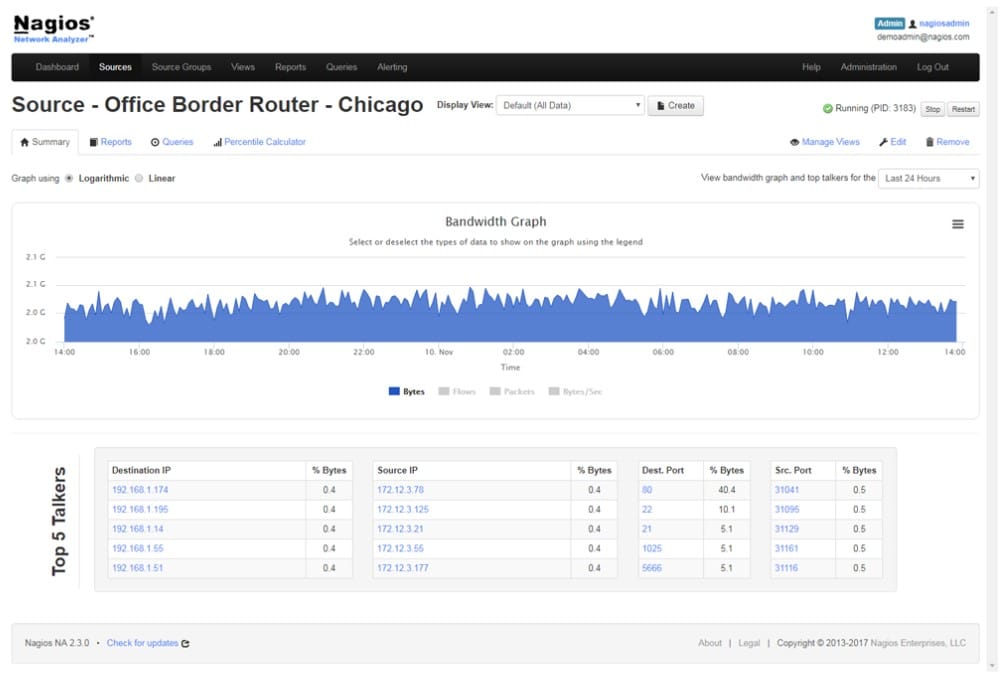
Nagios is a package of network monitoring services for networks, servers, and applications. The system is available in two versions: Nagios Core and Nagios XI. Nagios Core is the original system and it is an open source project. You can use Nagios Core for free. The Nagios XI system is a paid tool that is built on top of the services underlying the Nagios Core version.
Check out more open source network monitoring software.
When we tested Nagios we found the following key features.
Key Features:
- SNMP-Based Traffic Monitoring: Utilizes SNMP for real-time network traffic data collection and analysis.
- Comprehensive Network Traffic Data: Offers detailed insights into switch port activity and network bandwidth.
- Versatile Network Monitoring: Capable of monitoring both physical and virtual network environments.
Both Nagios Core and Nagios XI have had their traffic analysis functions removed to create a separate paid tool, called the Nagios Network Analyzer.
Why do we recommend it?
Nagios is a great package because it monitors networks, endpoints, and applications. That means you can get all of your monitoring needs served by one console. The free version, called Nagios Core has all of the functionality you need but its interface is no use. You would need to team that system up with a free frontend, such as Kibana to get a useful network monitor out of that package. Nagios XI is an excellent package but it is actually quite expensive.

Nagios uses the Simple Network Management Protocol (SNMP) to gather traffic data instead of the NetFlow system. SNMP defines device agents that make regular reports to an SNMP Manager. The reports include details about the device, such as its memory and CPU capacity. Each message shows the current utilization of both of those elements plus the traffic throughput on each port.
As the report also shows which device is connected to each port, the Nagios system is able to compile a live display of the traffic levels on each link and it also creates a network topology map showering those connections.
The Nagios system doesn’t just present network traffic information. You can also use the tool to monitor servers and applications. It is possible to extend the Nagios monitor with plug-ins that add on the capability to monitor specific products and applications.
Who is it recommended for?
A big problem with the Nagios family of products is that the provider removed all bandwidth monitoring capabilities and created a new package called the Nagios Network Analyzer. Again, this unit is not cheap and if you decide to go for both Nagios XI for general system monitoring plus Nagios Network Analyzer for bandwidth monitoring, you will be paying out a lot of money. So, Nagios is no longer as interesting for small businesses as it used to be. When vying for big business buyers, Nagios is in open competition with SolarWinds, Paessler, Datadog, and ManageEngine.
During our testing, we identified the following pros and cons related to Nagios.
Pros:
- Extensive Network Coverage: Provides wide-ranging capabilities for monitoring bandwidth and network throughput.
- Detailed Traffic Visualization: Offers clear traffic throughput displays and network mapping for easy network management.
- Plugin Extensibility: Supports a wide range of plugins, enhancing its functionality and adaptability to specific needs.
Cons:
- Limited Windows Compatibility: Not natively compatible with Windows, requiring additional setup for Windows-based environments.
- Separated Bandwidth Monitoring Tool: Bandwidth monitoring capabilities are part of a separate tool, potentially increasing overall costs and complexity.
You can download Nagios Core for free. All of the plug-ins that are available for Nagios XI also work with Nagios Core. Both editions of Nagios run on Linux. You can get them running on Windows over a hypervisor. Nagios Network Analyzer is offered on a 30-day free trial.
Choosing bandwidth monitoring tools
Several good free options are available to monitor the bandwidth of your network. Picking the appropriate one will depend on your installed network hardware, the size and sophistication of your network, and how you expect it to grow.
Network Bandwidth Monitoring FAQs
How to analyze network traffic remotely?
Many network monitoring tools are able to cover WANs, allowing one central network management team to monitor the networks at many sites. Cloud-based network monitoring tools all operate a remote monitoring system. In order to get around network security, these remote monitoring tools usually require an agent service to be installed on the remote network.
How can I view the bandwidth of my critical applications?
A typical network traffic monitor is able to identify traffic by application. This is possible because specific applications communicate on specific ports. The source and destination port numbers are always written in the packet headers that carry network traffic. If you don’t have a traffic monitor but use a packet sniffer, you can identify each application’s traffic by de-referencing the port numbers in the packets that you capture.
What is the best way to identify traffic flow on an existing network?
Networks are made up of a series of links. In order to get a useful overview of the entire network, it is necessary to examine traffic flows on each link. This can be done by measuring the traffic throughput on each router per destination. Creating your own map of the network and identifying traffic throughput on each link is complicated, so it is better to perform this task with a specialized traffic monitoring tool.
For a smaller network (like a residential network), you can consider Darkstat.