Global cybercrime damages are predicted to cost up to $10.5 trillion annually by 2025 (Cybersecurity Ventures). Not getting caught in the landslide is a matter of taking in the right information and acting on it quickly.
We collected and organized over 300 up-to-date cybercrime statistics that highlight:
- The magnitude of cybercrime operations and impact
- The attack tactics bad actors used most frequently in the past year
- How user behavior is changing… and how it isn’t
- What cybersecurity professionals are doing to counteract these threats
- How different countries fare in terms of fighting off attackers, including other nation-states
- What can be done to keep data and assets safe from scams and attacks.
Dig into these surprising (and sometimes mind-boggling) cybercrime statistics to understand what’s going on globally and discover how several countries fare in protecting themselves.
The article includes plenty of visual representations of the most important facts and figures in information security today.
Headline cybercrime statistics for 2019-2024
With the threat landscape always changing, it’s important to understand how cyber attacks are evolving and which security controls and types of training work.
- There were 30 million new malware samples detected in 2023 (AV-Test). This actually represents a two-third reduction since the year prior.
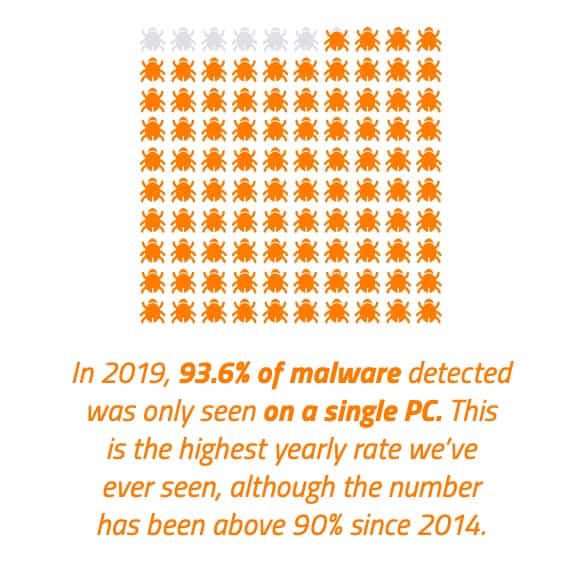
- In 2019, 93.6% of malware observed was polymorphic, meaning it has the ability to constantly change its code to evade detection (2020 Webroot Threat Report). However, we’re beginning to see the adoption of machine-learning powered tools that can detect commonalities between any given app and known malware families (Webroot’s Nastiest Malware 2023 Report).
- 45% of business PCs and 53% of consumer PCs that got infected once were re-infected within the same year (2022 Webroot Threat Report)
- A 2007 study from the University of Maryland found that malicious hackers were previously attacking computers and networks at a rate of one attack every 39 seconds. The Internet Crime Complaint Center’s 2022 report found that there were 800,944 reports that year. This works out at one successful attack every 0.65 seconds. Notably, this doesn’t account for attempted attacks or those that went unreported.
- 84.7% of surveyed organizations were affected by a successful cyberattack. That’s down from 85.3 percent in 2022 and 86.2 percent in 2021. (CyberEdge Group 2023 Cyberthreat Defense Report)

Almost three-quarters of IT security professionals believe their organization is “more likely… than not” to be compromised by a cyberattack in the next year.
- Mexican businesses were the most likely to fall victim to multiple attacks in 2023, followed by Australia, Germany, and the USA. (CyberEdge 2023 Cyberthreat Defense Report)
Naturally, these facts and figures are just the tip of the iceberg. The deeper we dive into the wealth of information cybersecurity reports now offer, the clearer and more unnerving the picture becomes.
Ransomware statistics 2024
Ransomware infection rates have skyrocketed in recent years, largely due to the increased importance of online learning and teleworking platforms.
- US ransomware attacks cost an estimated $449 million in the first half of 2023 alone. (Emsisoft)
- 493.3 million ransomware attacks occurred in 2022, down slightly from the previous year. (SonicWall)
- The Cybersecurity and Infrastructure Security Agency reported in February 2022 that ransomware incidents happened in 14 out of 16 critical US infrastructure sectors. (CISA)
- Emsisoft reports that 141 hospitals, 108 school districts, and 95 government entities were impacted by ransomware in 2023.
- According to a 2023 report, 93% of ransomware attacks specifically targeted backup repositories and 75% of those attempts were successful. (Veeam)
- Over 37,700 ransomware attacks happen every hour globally. That is about 578 ransomware attacks each minute. (Matthew Woodward)
- The State of Maine suffered a data breach in 2023 that led to the loss of over a million citizen’s data.
- In 2022, American educational establishments lost approximately $9.45 billion to downtime following ransomware attacks.
- In 2023, 66 individual ransomware attacks cost US healthcare organizations an estimated $14.7 billion. (Comparitech)
- One out of five Americans has dealt with a ransomware attack. (The Harris Poll)
- Ransomware is involved in around 24% of malware security incidents, up from 17 percent in 2022 but still down from 27% in 2021. (Verizon 2023 Data Breach Investigations Report)
- Ransomware payments have hit a new high. The average payout in Q2 2023 was $1.54 million, up almost 100 percent year-on-year. (Coveware)
- The average downtime due to a ransomware attack was 22 days in Q3 of 2021 compared to 19 days in Q3 2020. (Coveware’s Q3 2021 Ransomware Marketplace report)

Downtime is still the most dangerous aspect of a ransomware attack, and one of the reasons data exfiltration should not present as much of a challenge to victims as business interruption.
Coveware’s Q3 2020 Ransomware Marketplace report
- Ransomware attacks can be extremely costly. For example, an attack involving the NotPetya ransomware cost shipping firm Maersk more than $200 million.
- In 2023, the average global cost to remediate a ransomware attack rose to $1.82 million, more than double 2021’s average ($761,106). (Sophos The State of Ransomware 2023)
- Organizations in Singapore, South Africa, Spain, and Switzerland are most likely to be hit by ransomware attacks. In India, the prevalence is especially high with 84% of organizations dealing with ransomware. South Africa has the next highest incidence, at 78%. (Sophos The State of Ransomware 2023)
- Kaspersky detected over 1,800 new mobile ransomware Trojans in Q3 2023. (Kaspersky Labs)
- In 2023, Yemen, Bangladesh, and South Korea top the list of countries attacked by ransomware in terms of share of users. (Kaspersky Labs)
What makes the ransomware problem worse is that nation-states are involved. Investigations proved that the WannaCry and NotPetya ransomware attack campaigns were orchestrated by nation-state actors. They may have started in 2017, but their effect continued into 2020. The objective was to destroy information or cause distractions rather than to derive financial benefits.
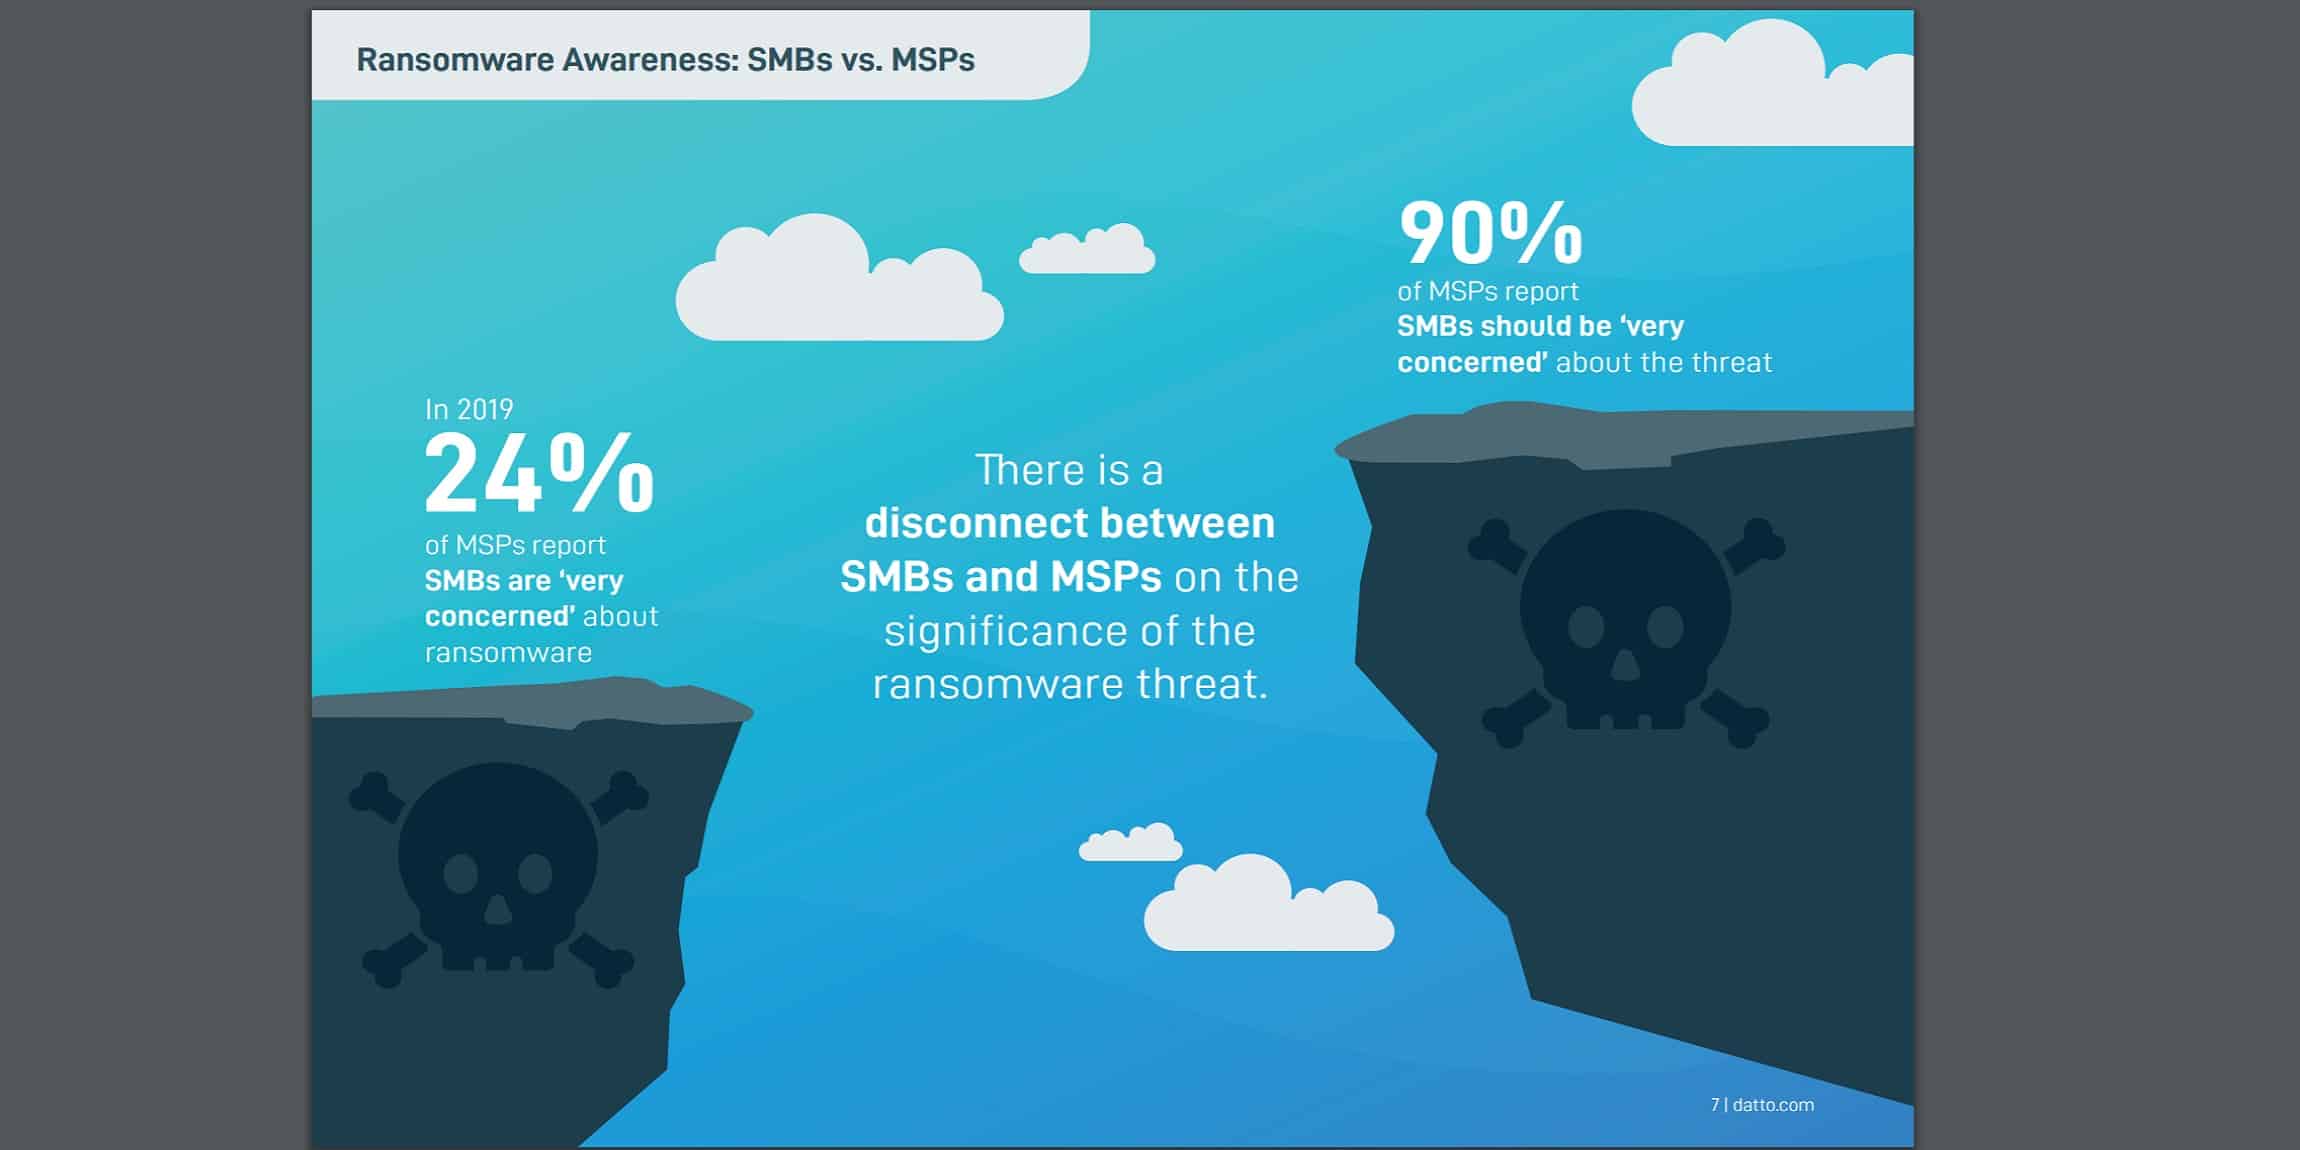
Datto’s Global State of the Channel Ransomware Report 2020 shows that ransomware is still a huge cause for concern for any type of organization, particularly SMBs. Datto surveyed more than 200 Managed Service Providers (MSPs), partners, and clients across the globe. Here are some of the key findings:
- 89% of MSPs state that ransomware is the most common threat to SMBs.
- 64% reported attacks against clients in the first half of 2019, representing an 8% increase year-on-year. However, only 5% report multiple attacks in one day, down from 15% in 2018.
- Two out of five SMBs have fallen victim to a ransomware attack.
One somewhat alarming disconnect was revealed in the report:
90% of MSPs are “very concerned” about the ransomware threat and 24% report their SMB clients feel the same.
Datto’s Global State of the Channel Ransomware Report 2020
Datto’s Global State of the Channel Ransomware Report 2020
- Phishing emails, lack of training, and weak passwords are some of the top causes of ransomware attacks.
- Downtime costs increased by 75% year-over-year.
- The average cost of downtime is 24 times higher than the average ransom amount.
- On the bright side, having Business Continuity and Disaster Recovery (BCDR) solutions in place is a huge plus. Three out of four MSPs said that clients with BCDR solutions recovered from an attack within 24 hours.
- The vast majority of MSPs (75%) admitted that they too are increasingly targeted in cyberattacks involving ransomware.
According to Kaspersky, 694 million ransomware attacks were blocked in Q3 2023. This was a 30% reduction from the number blocked in Q3 2022.
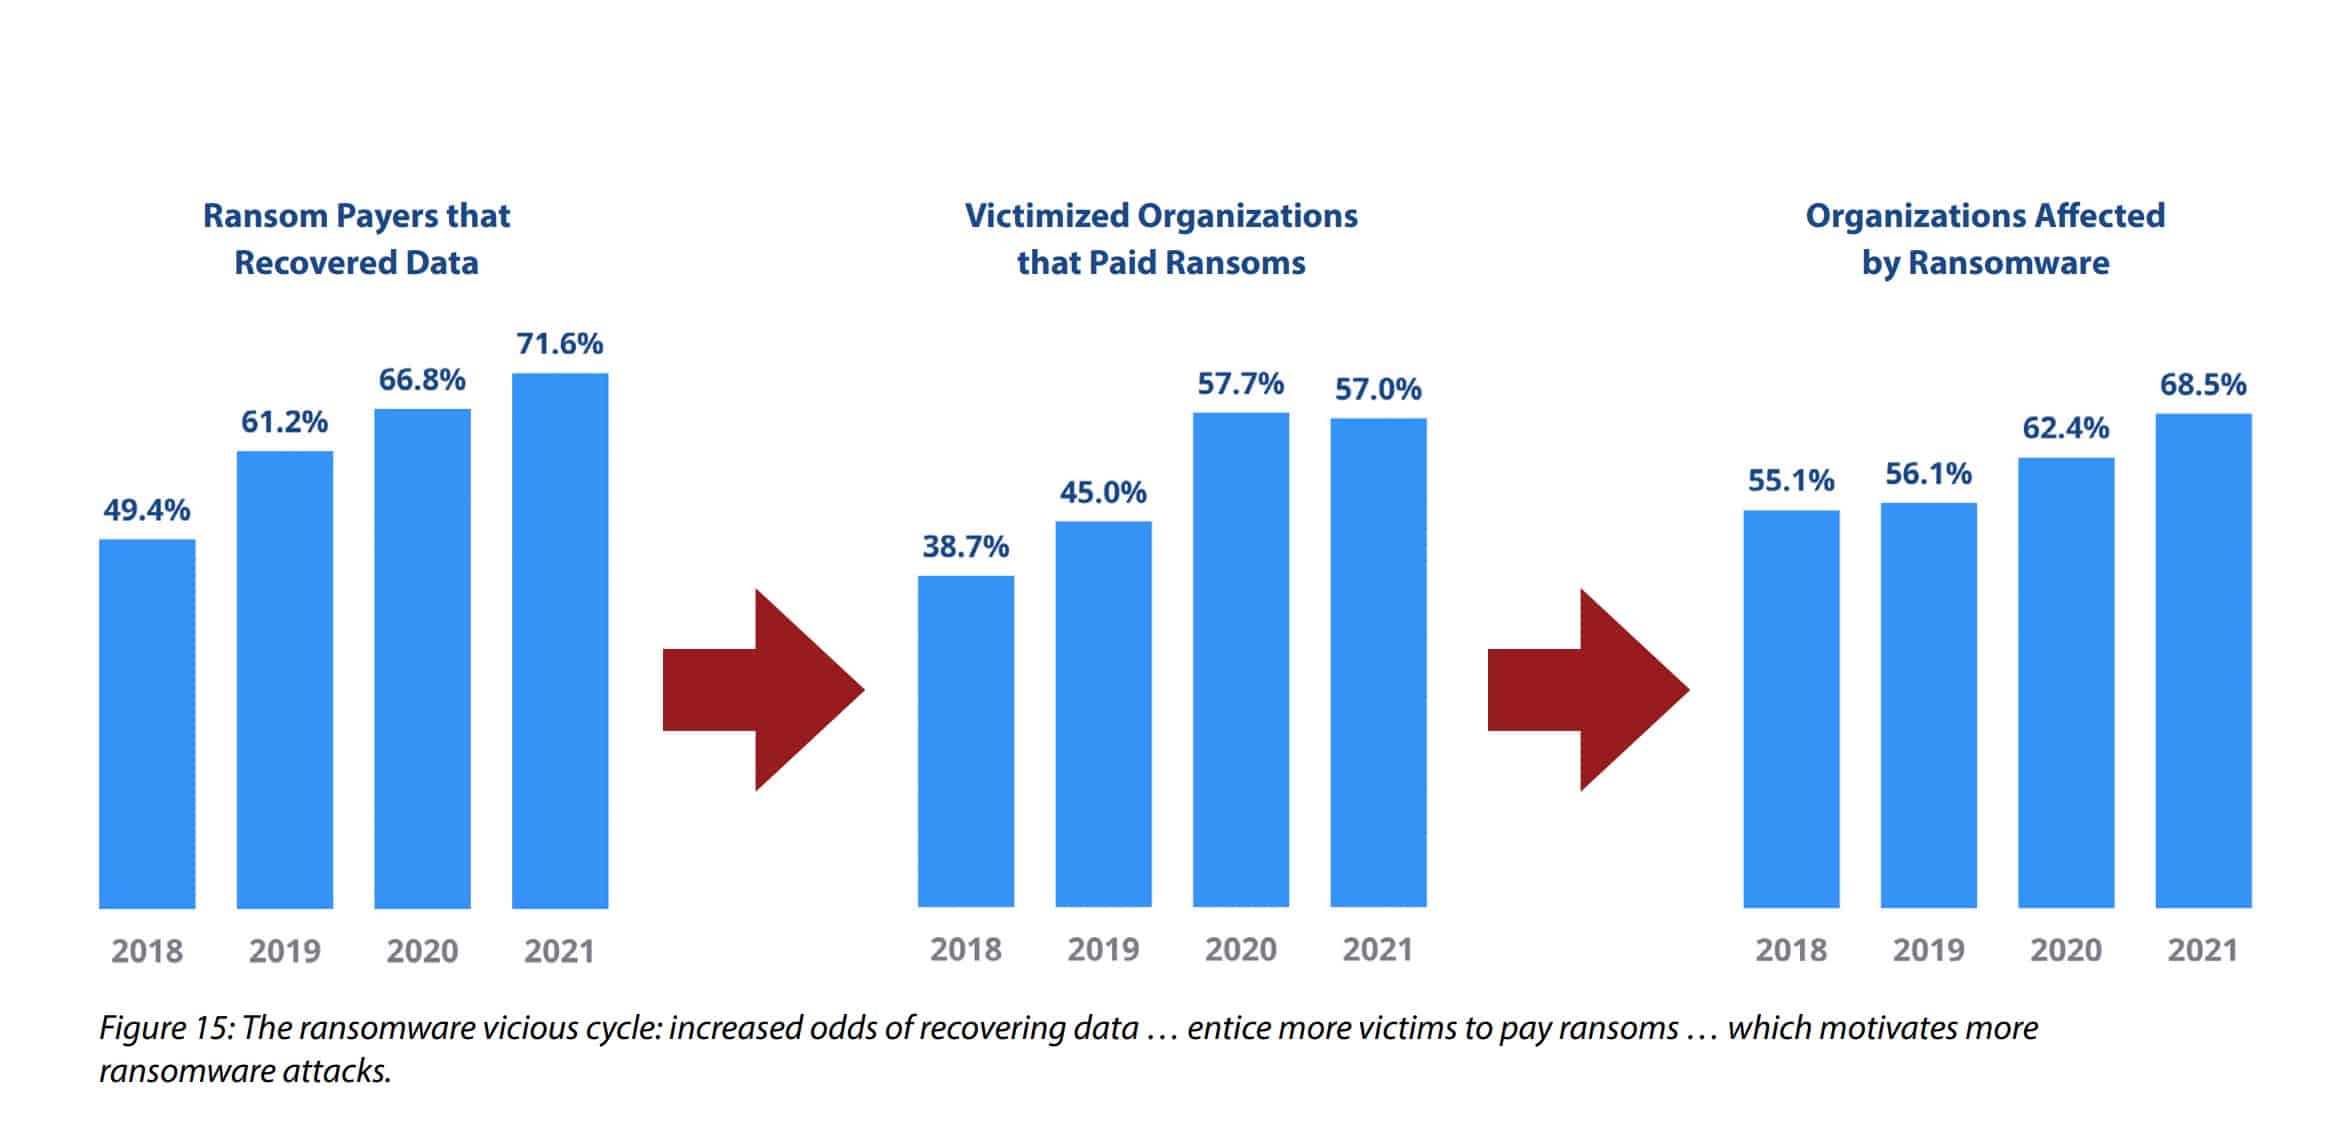
While ransomware infection rates are declining, companies are continuously choosing to pay the ransom. The 2023 CyberEdge Cyberthreat Defense Report revealed that 59.7% of organizations hit by ransomware pay to get their data unlocked, further fueling cyber criminal activities.
“The more confident organizations are that they will recover their data upon paying ransoms, the more likely they’ll be to actually pay the ransoms”
CyberEdge 2021 Cyberthreat Defense Report
CyberEdge 2021 Cyberthreat Defense Report
In terms of geographical distribution, ransomware hit businesses in Germany, Saudio Arabia, and China the hardest in 2023.

Because cybersecurity is a discipline with widespread implications and interdependencies, we’re going to dive into the most prominent attack tactics next. Recent reports overflow with data that both concerns companies across industries and addresses particular issues.
Other common cyber attack tactics
Ransomware is not the only concern. Over the next sections, we’ll take a look at other common attack vectors.
Favored cyber attack tactics include cryptojacking and encrypted communication
Cryptojacking attacks made a comeback in 2023 after seeing huge declines in the latter half of 2019. All in all, there was an rise of around 40 million year on year. (2023 SonicWall Cyber Threat Report)
Cybercriminals now spread malware that infects victims’ computers and unlawfully uses their processing power to mine cryptocurrency, such as Bitcoin or Monero.
The dropping value of cryptocurrencies may have weakened interest in ransomware but mining for virtual currencies is still hugely relevant. That said, the landscape is shifting:
Due to its high availability and ease of use, XMRig was once again the cryptominer of choice. In 2022, 89.4% of all
cryptojacking attempts recorded by SonicWall were based on XMRig, up from 67.4% in 2021.
2023 SonicWall Cyber Threat Report
In the ENISA Threat Landscape 2021 report, ENISA Notes that in Q1 2021, the volume of infections reached a record high compared to the last few years. Indeed, cryptomining malware increased 117%.
But cryptojacking is not the only attack giving CISOs, CIOs, and IT managers more trouble than they can handle. Statistics show that several threat vectors are cause for concern.
- Cybercriminals are quick to find ways to get around strengthened security including searching for the presence of a virtual machine before trying to run malware. (2023 State of the Software Supply Chain)
- Malicious documents are also a well-known infection vector that hasn’t lost its popularity: in its 2018 Annual Cybersecurity Report, Cisco found that, globally, 38% of malicious email attachments were Microsoft Office formats such as Word, PowerPoint, and Excel. (Cisco)
- Archive files, the likes of .zip and .jar, represent around 37% of all malicious file extensions Cisco observed, with malicious PDF files accounting for 14% of the total. (Cisco)
- The dangerous RedLine Stealer trojan is being sold on hacking forums and the Dark Web for as little as $150. In 2022, cybersecurity experts discovered the trojan being spread in fake Windows 11 upgrades. It allows hackers to steal passwords, credit card information, and other sensitive personal data.
Besides the already classic attack vectors, cybercriminals are also looking to piggyback on the boom in ecommerce and online shopping:
While attacks on household names make headlines, Symantec’s telemetry shows that it is often small and medium sized retailers, selling goods ranging from clothing to gardening equipment to medical supplies, that have had formjacking code injected onto their websites. This is a global problem with the potential to affect any business that accepts payments from customers online.
2019 Internet Security Threat Report by Symantec
The increasing adoption of cloud-based platforms is still leaving cybersecurity professionals playing catch-up:
- 93% of companies deal with rogue cloud apps usage (Imperva 2019 Cyberthreat Defense Report)
- 82% of cloud users have experienced security events caused by confusion over who is responsible to secure the implementations (Oracle and KPMG Cloud Threat Report 2019)
Imperva 2019 Cyberthreat Defense Report
Here are some key statistics that highlight the diversity in malicious tactics and strategies:
- Malware may be present on your device before you ever even interact with it. Research indicates the Android phones in China may be shipping with apps that collect your location, contact details, and profile information. (ENISA Threat Landscape 2023 – Malware)
- Financial trojans may have steadily declined in volume but they’re still one of the biggest threats against consumers; the most prevalent financial trojan of 2020 was Trickbot which took over the market share of Emotet after it was taken down (ENISA Threat Landscape 2021)
- In 2019, polymorphic malware accounted for almost 94% of all malicious executables (2020 Webroot Threat Report)
- In 2022 supply chain attacks became much more common because of how a single such attack can impact multiple victims. For example, the Kaseya breach impacted over 1,500 companies.
2020 Webroot Threat Report
Physical attacks are also on the rise, as cybercrime statistics show:
- 27% of cybersecurity incidents in 2020 started or finished with a physical action (ENISA Threat Landscape 2020 – Physical Threats)
- Physical attacks are falling out of vogue, with just 46 incidents in 2023. However, ENISA noted an increase in QR codes being posted in real-world locations. (ENISA Threat Landscape 2023)
- None of this is helped by the fact that 65% of employees have admitted to behaving in ways that may risk physical security (ENISA Threat Landscape 2020 – Physical Threats)
- In Europe, Black box ATM attacks increased by 269% in the first half of 2020 compared to H1. Related losses increased from €1,000 to over €1 million compared to the previous year. However, losses fell 37% to €0.63 million in the six months of 2021 (European Association for Secure Transactions (EAST) European Payment Terminal Crime Report)
Although most organizations recognize the threat that insiders can pose, it’s difficult to accurately determine how widespread the problem is. That’s because most businesses are hesitant to admit that they’ve been breached, let alone from the inside. (ENISA Threat Landscape 2023)

ENISA Threat Landscape 2020 – Insider Threat
Motivations are also changing, moving from making money through nefarious tactics to collecting data that can be used to cash out on multiple subsequent attacks:
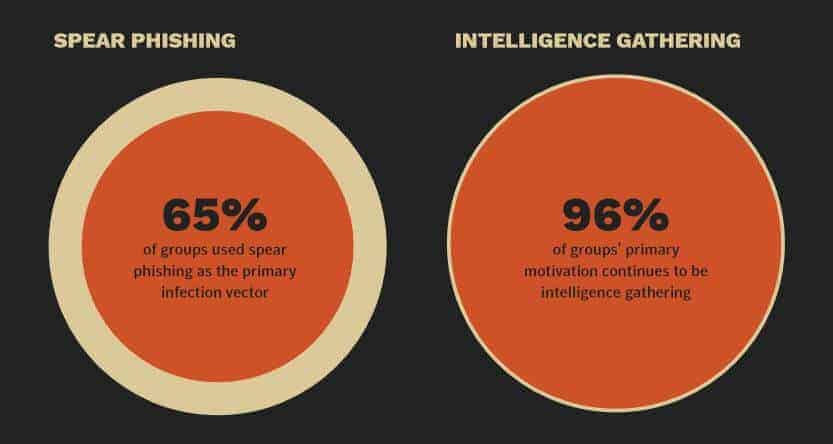
The most likely reason for an organization to experience a targeted attack was intelligence gathering, which is the motive for 96 percent of groups.
2019 Internet Security Threat Report by Symantec
 EY – Global Information Security Survey 2018-2019
DDoS attacks grow in both duration and frequency
With more unsecured devices connecting to the internet than ever, cybercriminals are taking full advantage of their processing power. Once recruited into botnets, they harness their collective power to launch powerful DDoS attacks that companies can barely survive.
Here are some statistics that illustrate this growing issue:
- In Q3 2022, the number of DDoS attacks increased more than 4.5 times over the same period in 2021. (Kaspersky Labs)
- 71% of organizations have experienced an extortion or ransom DDoS threat. (Corero Impact of DDoS on Enterprise Organizations)
Bad actors launched approximately 5.4 million DDoS attacks in 1H 2021—yet another record breaking number.
NETSCOUT Threat Intelligence Report Findings from 1H 2021
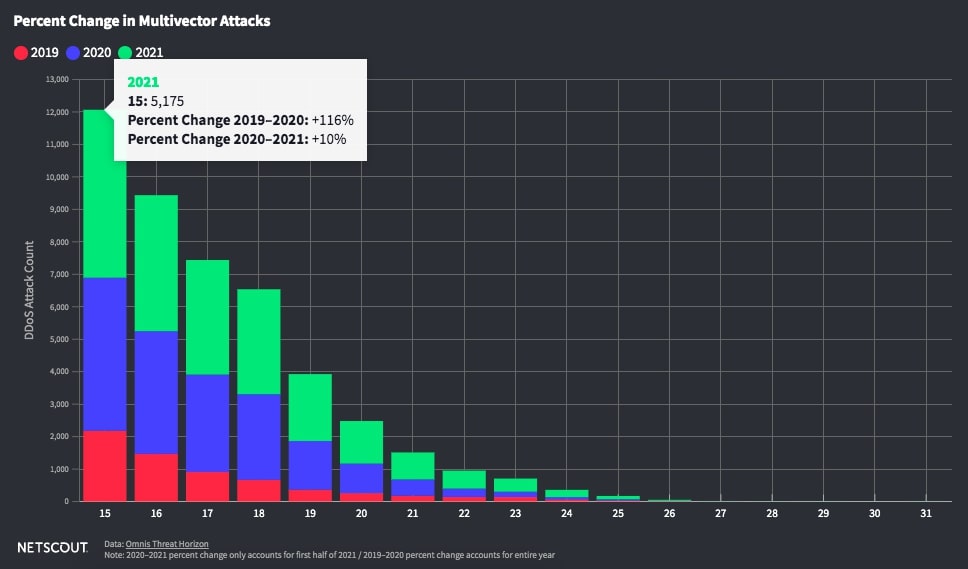
- The 1H 2021 report found that the number of multi-vector attacks (those using 15+ vectors) increased 116% from 2019 to 2020 and a further 10% from 2020 to 2021(NETSCOUT Threat Intelligence Report Findings from 1H 2021)
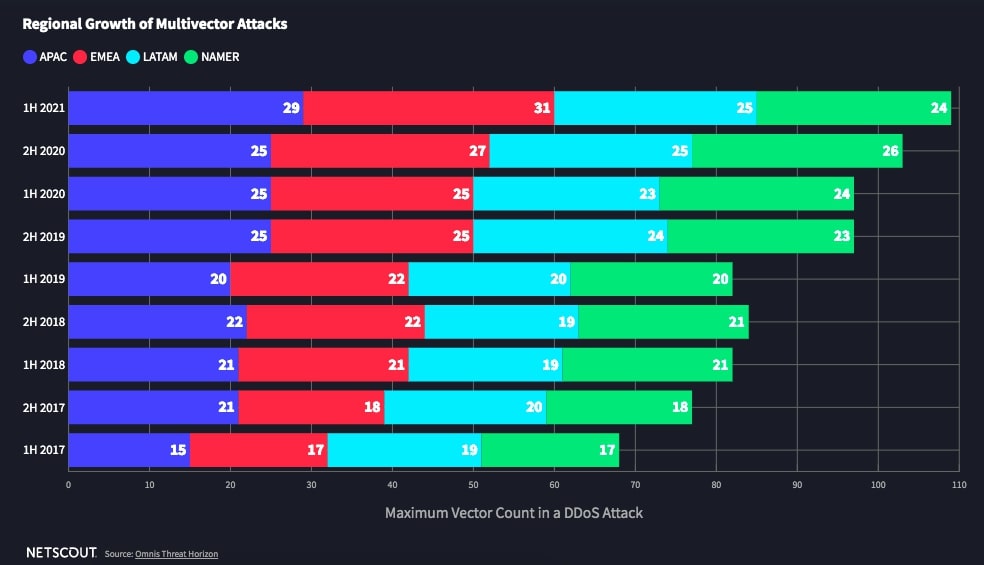
- The APAC and EMEA regions saw the largest increase in multi-vector DDoS attacks, while the number of attacks in the NAMER region actually decreased slightly (NETSCOUT Threat Intelligence Report Findings from 1H 2021)
- The duration of attacks increased to around 50 minutes in 1H 2021, an increase of 31%, with Netscout noting the growth of complex, multivector attacks. (NETSCOUT Threat Intelligence Report Findings from 1H 2021)
- The distribution of attacks by country sees the US having the lion’s share (43.5% in Q4 2021) of attacks and China experiencing 10% of attacks in Q4 2021. (Kaspersky Labs)
Phishing declined slightly in 2022
Malicious hackers and scammers are getting craftier at creating and sending phishing emails that trick even the most cautious users. The data shows that this is a constant cause for concern with no sign of slowing down in terms of effectiveness.
Phishing was the top crime type reported to the Internet Crime Complaint Center (IC3) in 2022, though there were roughly 20,000 fewer incidents than in 2021. (IC3 Internet Crime Report 2022)

- In Q3 of 2021, APWG detected over 1,286,000 unique phishing websites and observed more than 90,000 unique phishing email subjects. (APWG’s Phishing Activity Trends Report for Q2 2023)
- More than 30% of phishing attacks involve keyloggers. (Cofense’s Phishing Threat and Malware Review Q3 2021)
- The most frequent targeted attack vector is spear phishing. (Symanetc’s Internet Security Threat Report 2019)
- Small organizations receive malicious emails at a higher rate. (Symantec’s Internet Security Threat Report 2019)
- Mining companies are most likely to receive malicious emails. (Symantec’s Internet Security Threat Report 2019)
- In 2023, financial institutions and social media accounts were the most common targets, at 23.5% and 22.3%, respectively. (APWG’s Phishing Activity Trends Report for Q2 2023)

- Phishing is the number two type of threat action involved in data breaches, after denial-of-service following a hack. (Verizon’s 2021 Data Breach Investigation Report)
- 74% of phishing sites used HTTPS in the last quarter of 2019, compared to just 32% two years earlier. (ENISA Threat Landscape 2020 – Phishing)
- Almost 43% of malicious attachments in 2019 were Microsoft Office documents. However, attackers are increasingly moving to ZIP, LNK, or ISO files as Microsoft disables support for macros. (ENISA Threat Landscape 2023)
- More than 95% of malware-distributing emails require human action such as following links or accepting security warnings. (ENISA Threat Landscape 2020 – Phishing)
[/ctech_content_w_bk]
The 10 most frequently-used subject lines in attacks are:
- Possible typo
- HR: Important: Dress Code Changes
- HR: Please update W4 for file
- Adobe Sign: Your Performance Review
- HR: Vacation Leave Notice: Plan Your Time Off Now!
- HR: Vacation Policy Update
- HR: Your training is past due
- Google: You were mentioned in a document: “Strategic Plan Draft”
- You Have A New Voicemail
- Bad customer review received – Please take action ASAP
- However, according to ENISA, the word “payment” is also frequently used in attack email subjects. (ENISA Threat Landscape 2020 – Phishing)
- Monday is the most popular day to send out phishing messages with 30% of emails being delivered on that day. (ENISA Threat Landscape 2020 – Phishing)
Phishing and other types of email fraud rely heavily on impersonation to make their attacks more effective. Displaying fake display names to deceive victims is preferred by bad actors over typosquatting or domain spoofing.
During the first half of 2021, Agari data indicates 62.6% of all identity-deception based attacks leveraged display name deception aimed at impersonating a trusted individual or brand—typically an outside vendor, supplier or partner.
1H 2021: Email Fraud and Identity Deception Trends by Agari
- The most frequently impersonated brands are Microsoft (33 percent), Amazon (nine percent), and Google (eight percent). (Checkpoint Research Q4 2023 Brand Phishing Report)
- The other brands in the top 10 were: Apple, Wells Fargo, LinkedIn, Home Depot, Facebok, Netflix, and DHL. (Checkpoint Research Q4 2023 Brand Phishing Report)
Update: Latest Trends and Statistics on Phishing Attacks (2024)
Phishing remains a significant and evolving threat in the cybersecurity arena. Recent findings from Hornetsecurity’s Cyber Security Report 2024 indicate that phishing is still the most prevalent email attack method, accounting for 43.3% of all email threats. This continued dominance of phishing in the cyber threat landscape necessitates constant vigilance and robust defense strategies.
A concerning trend noted by ArcticWolf is the lack of multi-factor authentication (MFA) in organizations, which has been linked to the success of Business Email Compromise (BEC) attacks. Just 26 percent of organizations use MFA, but in 80% of BEC incidents, the targeted organizations did not have MFA solutions in place, underscoring the importance of this security layer in thwarting phishing attempts.
As phishing continues to be a dominant cyber threat, organizations and individuals must stay updated on the latest attack methods and strengthen their cybersecurity measures accordingly.
Spam continues to be a dominant force in email-based cybercrime
Channels may change, but spam is one of those attack tactics that’s bound to stick with us for the foreseeable future and quite possibly beyond it. Some of the allures of spam for cybercriminals are its ease of execution and potential to reach a huge number of victims. One common scheme doing the rounds in 2020 involved spam emails from large companies requesting that recipients call a support number. Upon calling, they would be asked by the fake support team to hand over details including their full name and banking information.
Scammers like such schemes, because sending spam is much cheaper and easier than calling potential victims.
Kaspersky Spam and Phishing in Q3 2020
- In 2022, the average portion of spam in mail traffic was 48.63%. Notably, more than half of all emails to and from Russia were spam. (Kaspersky Spam and Phishing in 2022)
- The countries most likely to be targeted with malicious emails are Spain (8.78%), Russia (7.29%), and Mexico (6.73%) (Kaspersky Spam and Phishing in 2022)
- Russia and China are the top spam-source countries, generating 29.82% and 14% of spam respectively. (Kaspersky Spam and Phishing in 2022)
Cybercriminals are not content with just using the billions of email addresses leaked through data breaches. They’re also validating their lists of potential victims and bypassing spam filters in ever clever ways:
Spammers manipulated feedback forms on the websites of large companies used to ask questions, express wishes or subscribe to newsletters. However, in this reporting year, instead of spamming the company’s linked mailboxes, the spammers exploited low levels of website security, bypassed any reCAPTCHA tests and registered multiple accounts with valid e-mail information. As a result, victims received a legitimate reply from the company, including the spammer’s message. In this way, even Google Forms was manipulated to retrieve user data and send commercial spam.
ENISA Threat Landscape Report 2020 – Spam
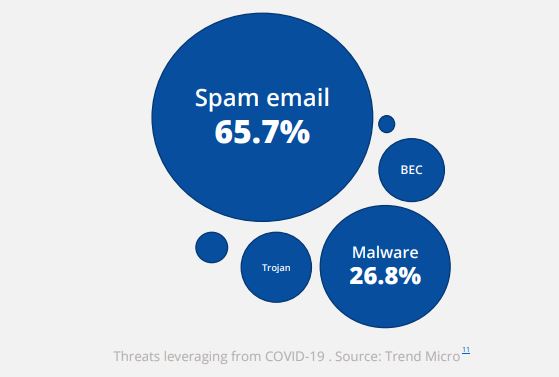
- Spam was the most popular type of threat leveraging COVID-19. (ENISA Threat Landscape Report 2020 – Spam)
- 65.7% of COVID-19 related threats were spam email while 26.8% were malware. (ENISA Threat Landscape Report 2020 – Spam)
Most cybercrime now leverages mobile channels
More devices, more problems. From BYOD to malicious apps with millions of downloads, cybercriminals have plenty of opportunities to exploit, scam, and extort victims in both corporate and private environments.
- According to UK Finance, the vast majority of reported scams in 2022 happened online, phone-based scams accounting for just 18 percent. However, they accounted for 44 percent of all losses that year. In other words, phone scams may not work on everyone, but when a victim is found, they’re highly profitable.
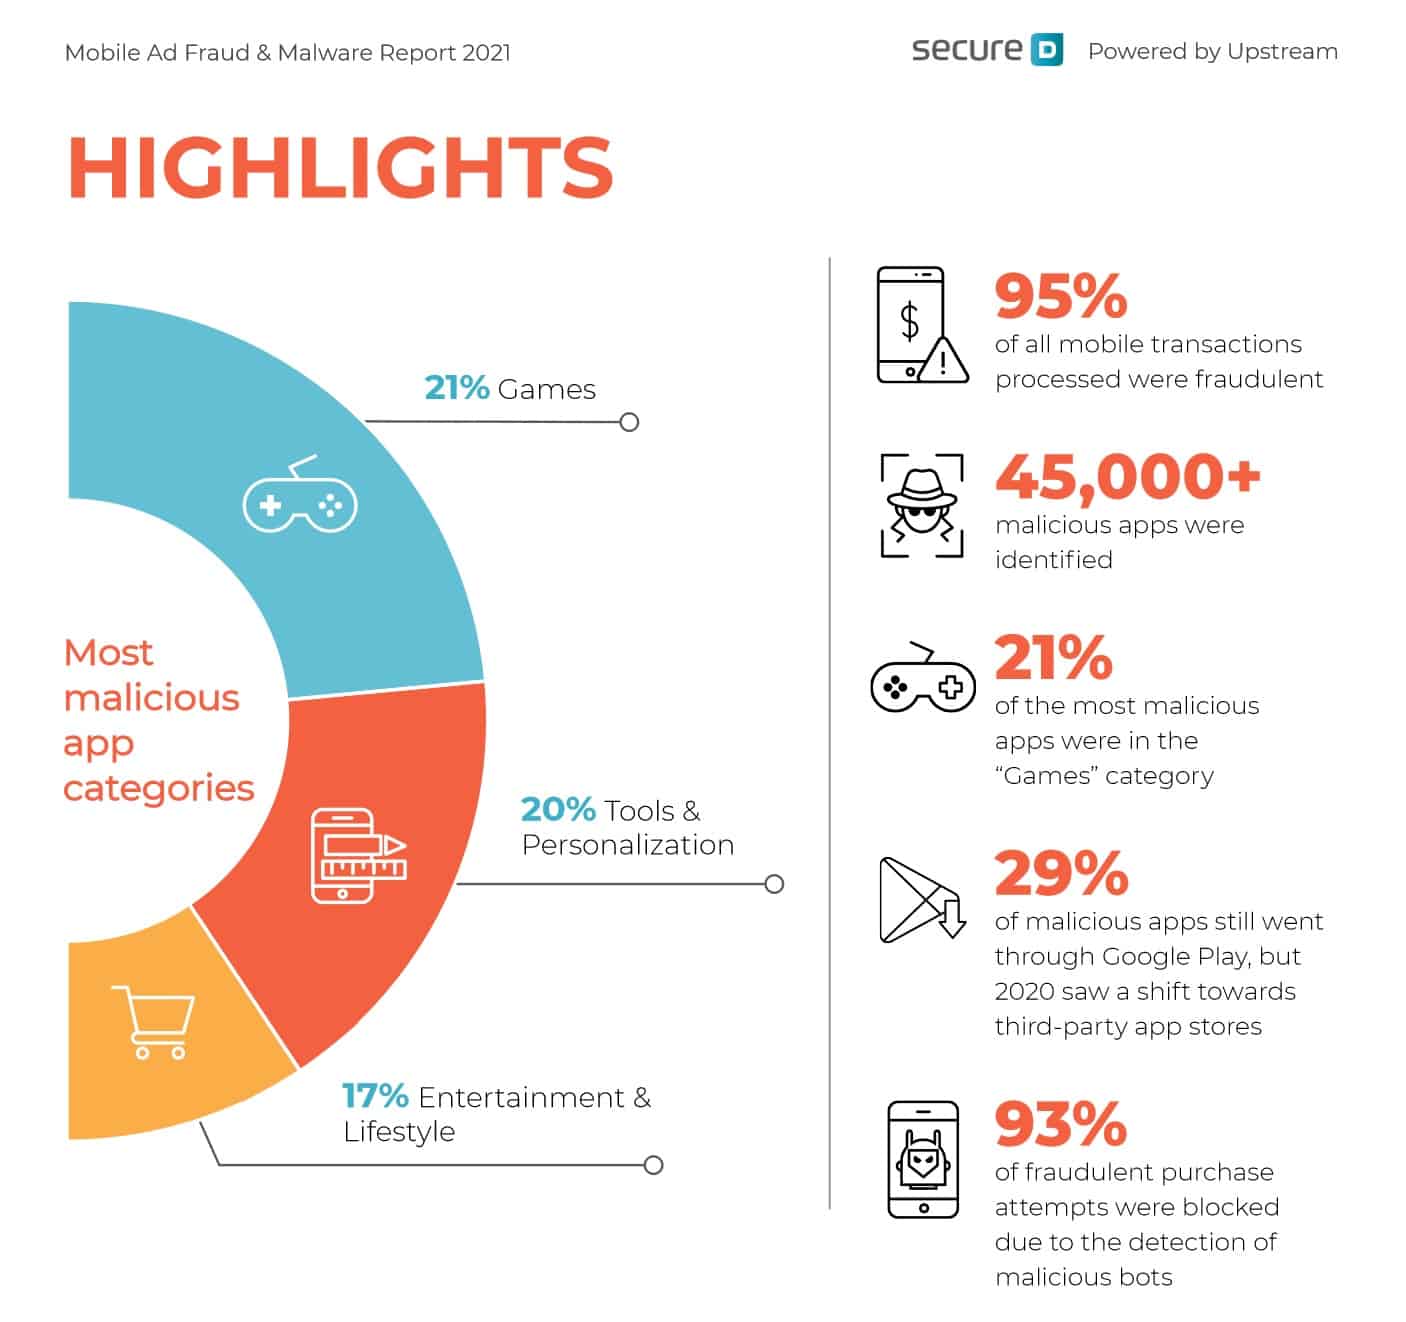
- The top category for malicious apps is Games (21%), Tools and Personalization (20%), and Entertainment and Lifestyle (17%). (Upstream Secure-D “A Pandemic on Mobile”)
Upstream Secure-D Mobile “A Pandemic on Mobile”
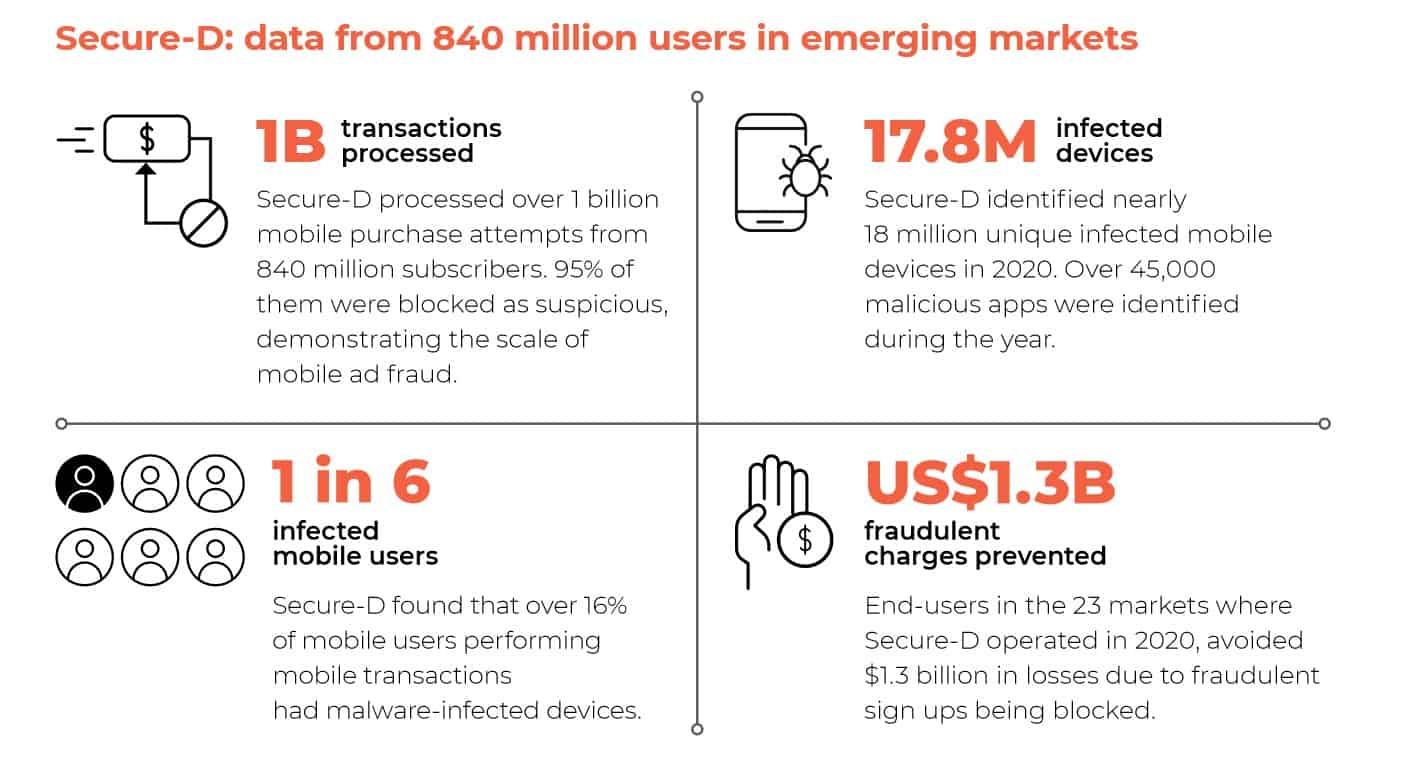
- Secure-D identified almost 45,000+ malicious apps in 2020, with 23% available via Google Play. (Upstream Secure-D “A Pandemic on Mobile”)
- Secure-D had to block over a billion transactions (a shocking 93% of total transactions) as fraudulent. This represented $1.3 billion worth of transactions. (Upstream Secure-D “A Pandemic on Mobile”)
- IT detected more than 17.8 million infected devices in 2019, compared to 43 million in 2019. (Upstream Secure-D “A Pandemic on Mobile”)
Upstream Secure-D “A Pandemic on Mobile”
- The most common attack targets in a corporate setting are Internet of Things devices, reported in one-third of incidents. However, mobile devices (whether personal or company-owned) were the second most-appealing target at 28 percent. (Verizon Mobile Security Index 2023)
- Almost 50% of organizations are “very confident” that they’d be able to quickly spot a compromised mobile device. (Verizon Mobile Security Index 2021)
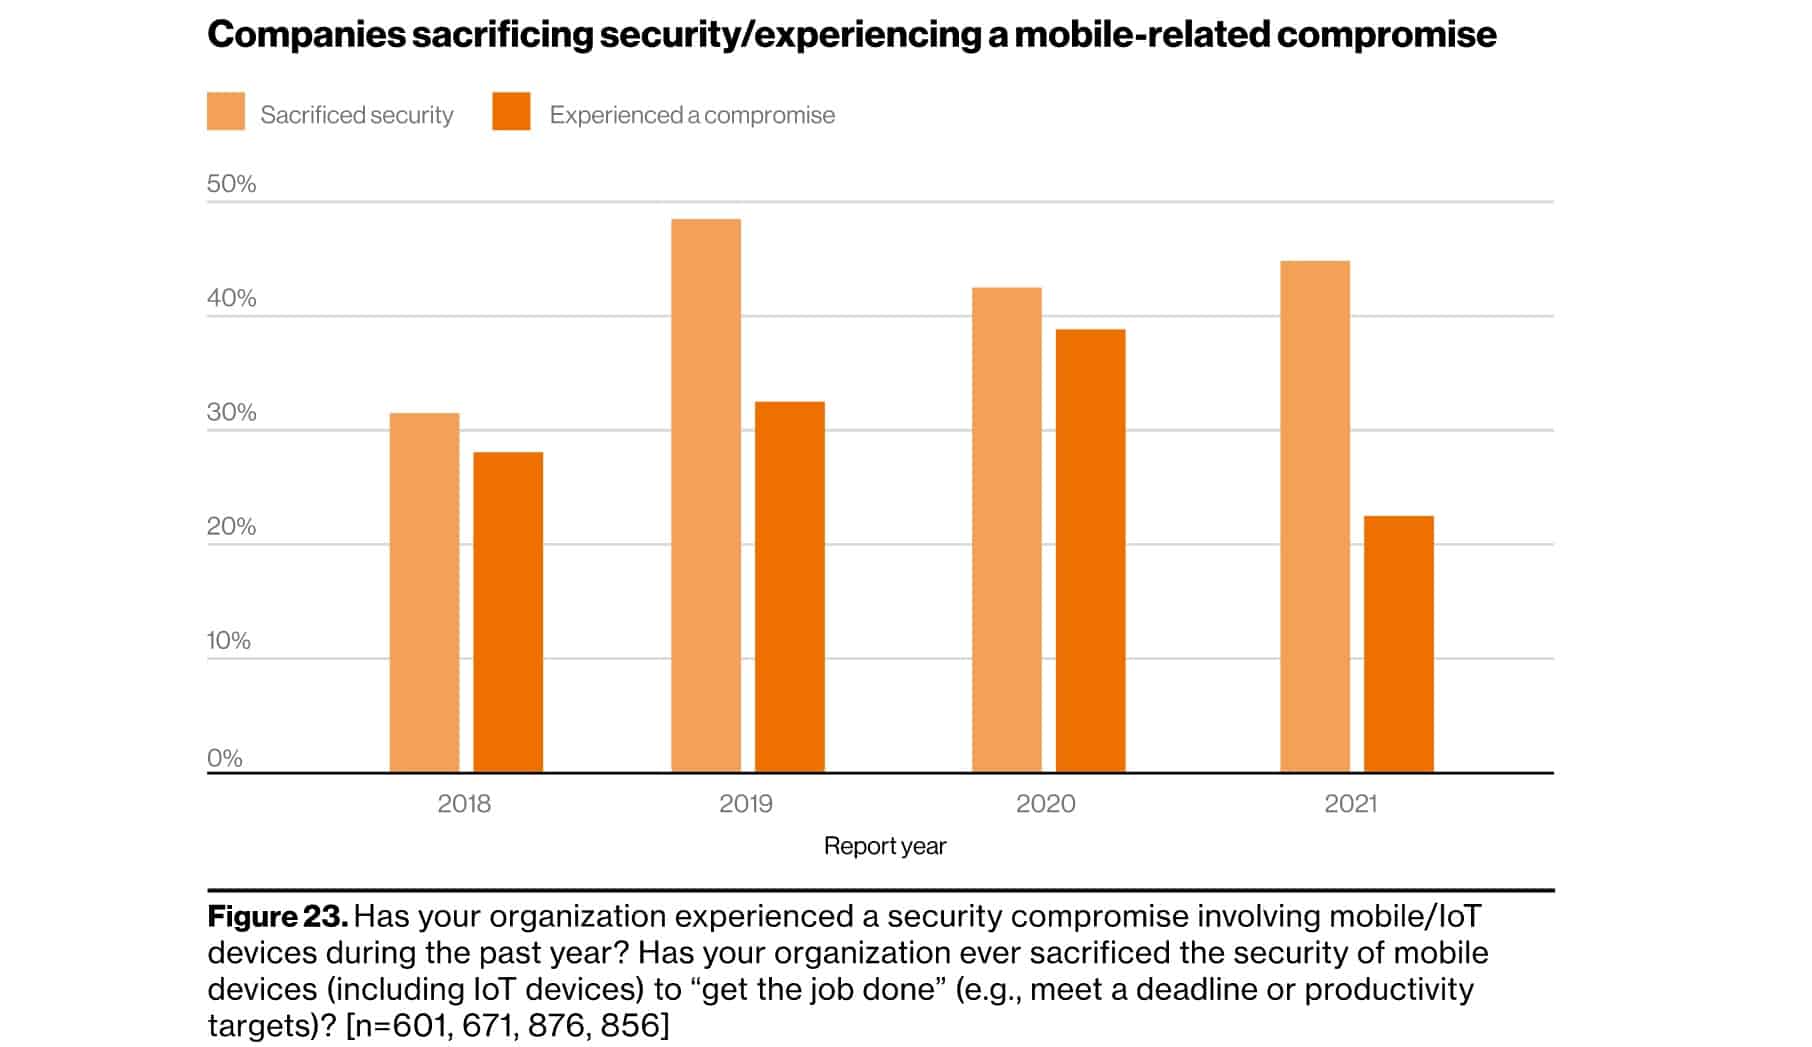
- In spite of these realizations, 66% of companies said they had been pressured to sacrifice mobile security to “get the job done” in 2023. (Verizon Mobile Security Index 2023)
- Consequences are inevitable: More than 90% of surveyed organizations suffered a compromise involving a mobile device in 2020 labelled the impact “moderate” or worse. (Verizon Mobile Security Index 2021)
- Around 70% of compromised companies described the incident as “major” (Verizon Mobile Security Index 2021)
- Mobile banking malware saw a surge in the first half of 2019, increasing by 50%. (ENISA Threat Landscape Report 2020 – Malware)
- “The most popular banking malware during 2019 was Asacub
(44.4%), Svpeng (22.4%), Agent (19.1%), Faketoken (12%) and
Hqwar (3.8%).” (ENISA Threat Landscape Report 2020 – Malware) - Phishing attacks on mobile devices are becoming increasingly common. In North America, the Q4 2022 encounter rate of enterprise mobile phishing was 21.45%. (Lookout’s The State of Mobile Phishing)
Managing cybersecurity vulnerabilities improves but still troubles companies and countries around the world
Software and hardware vulnerabilities continue to be topics of prime importance for the tech world. Let’s explore some highlights that stand out from the numerous reports cybersecurity companies created on the topic:
- 13,160 vulnerabilities were published on the NVD database in 2022 which was a steep reduction from 2021’s all time high of 20,000. (NVD Database)
- A significant portion (19.25%) of vulnerabilities are considered critical. (CVE Details)
- In 2023, at least 30% of web applications were vulnerable to exploits or had at least one high-risk vulnerability. (Security Magazine)
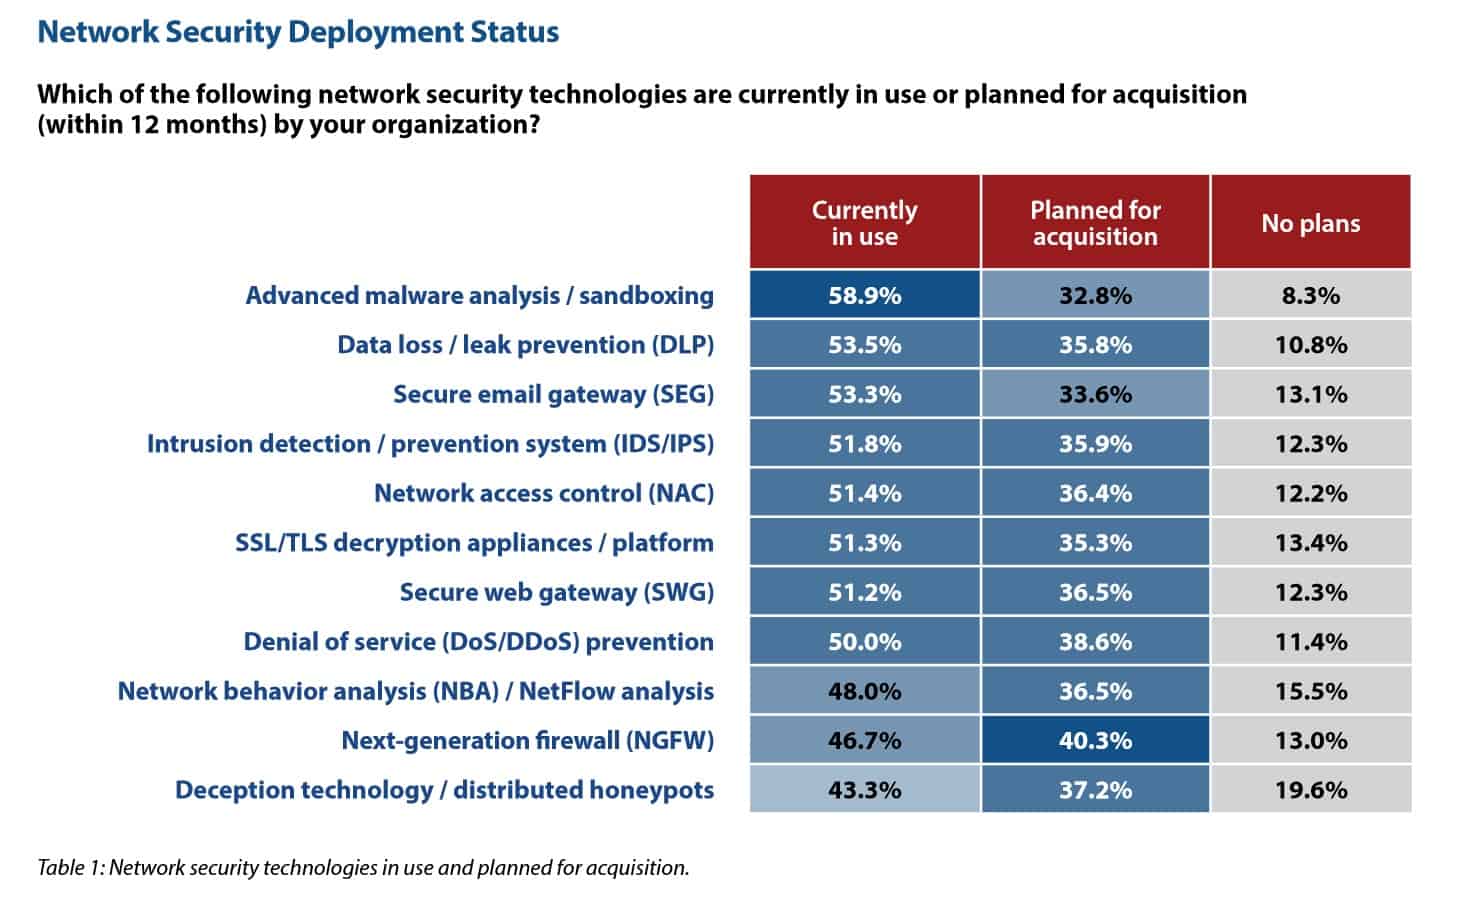
- In 2023, organizations were most worried about their identity and access-management systems, with threat detection, incident response, and third-party risk management all top concerns (Imperva 2023 Cyberthreat Defense Report).
- Active directory protection is the most commonly-used security-management technology of the year, with 61.6% of companies using it and 28.9% planning to adopt it soon. (Imperva 2023 Cyberthreat Defense Report)
- Not all antivirus software is created equal. In fact, in 2022, people who relied on free services experienced fewer breakthrough viruses than those with paid antivirus software. (Security’s Antivirus Consumer Report 2023)
Reports show that security vulnerabilities in web apps continue to be a huge problem, with 12% of internet-facing web applications considered high or critical risk.

What’s more, the issue is so pervasive that even more countries are working on this aspect. More than half of all US states perform annual cyber-incident simulations and monthly security event reviews. (Deloitte-NASCIO Cybersecurity Survey 2022)
Thankfully, there are plenty of people working to discover and patch vulnerabilities, many through bug bounty programs:
- Google paid out a record-breaking $12 million in bug bounties in 2022. Since 2015, it has paid more than $45.2 million. (Google)
- Microsoft paid $13.8 million worth of bug bounties in 12 months. (Microsoft)
- Facebook has a bounty program too and awarded around $2 million in 2022. Its largest payout to date was $300,000. (Facebook)
The volume of IoT attacks is increasing
As the number of IoT devices continue to multiply wildly, so do the security issues associated with it. The numbers speak for themselves.
The number of Internet connected devices is expected to increase from 31 billion in 2020 to 35 billion in 2021 and 75 billion in 2025.
Security Today’s The IoT Rundown for 2020
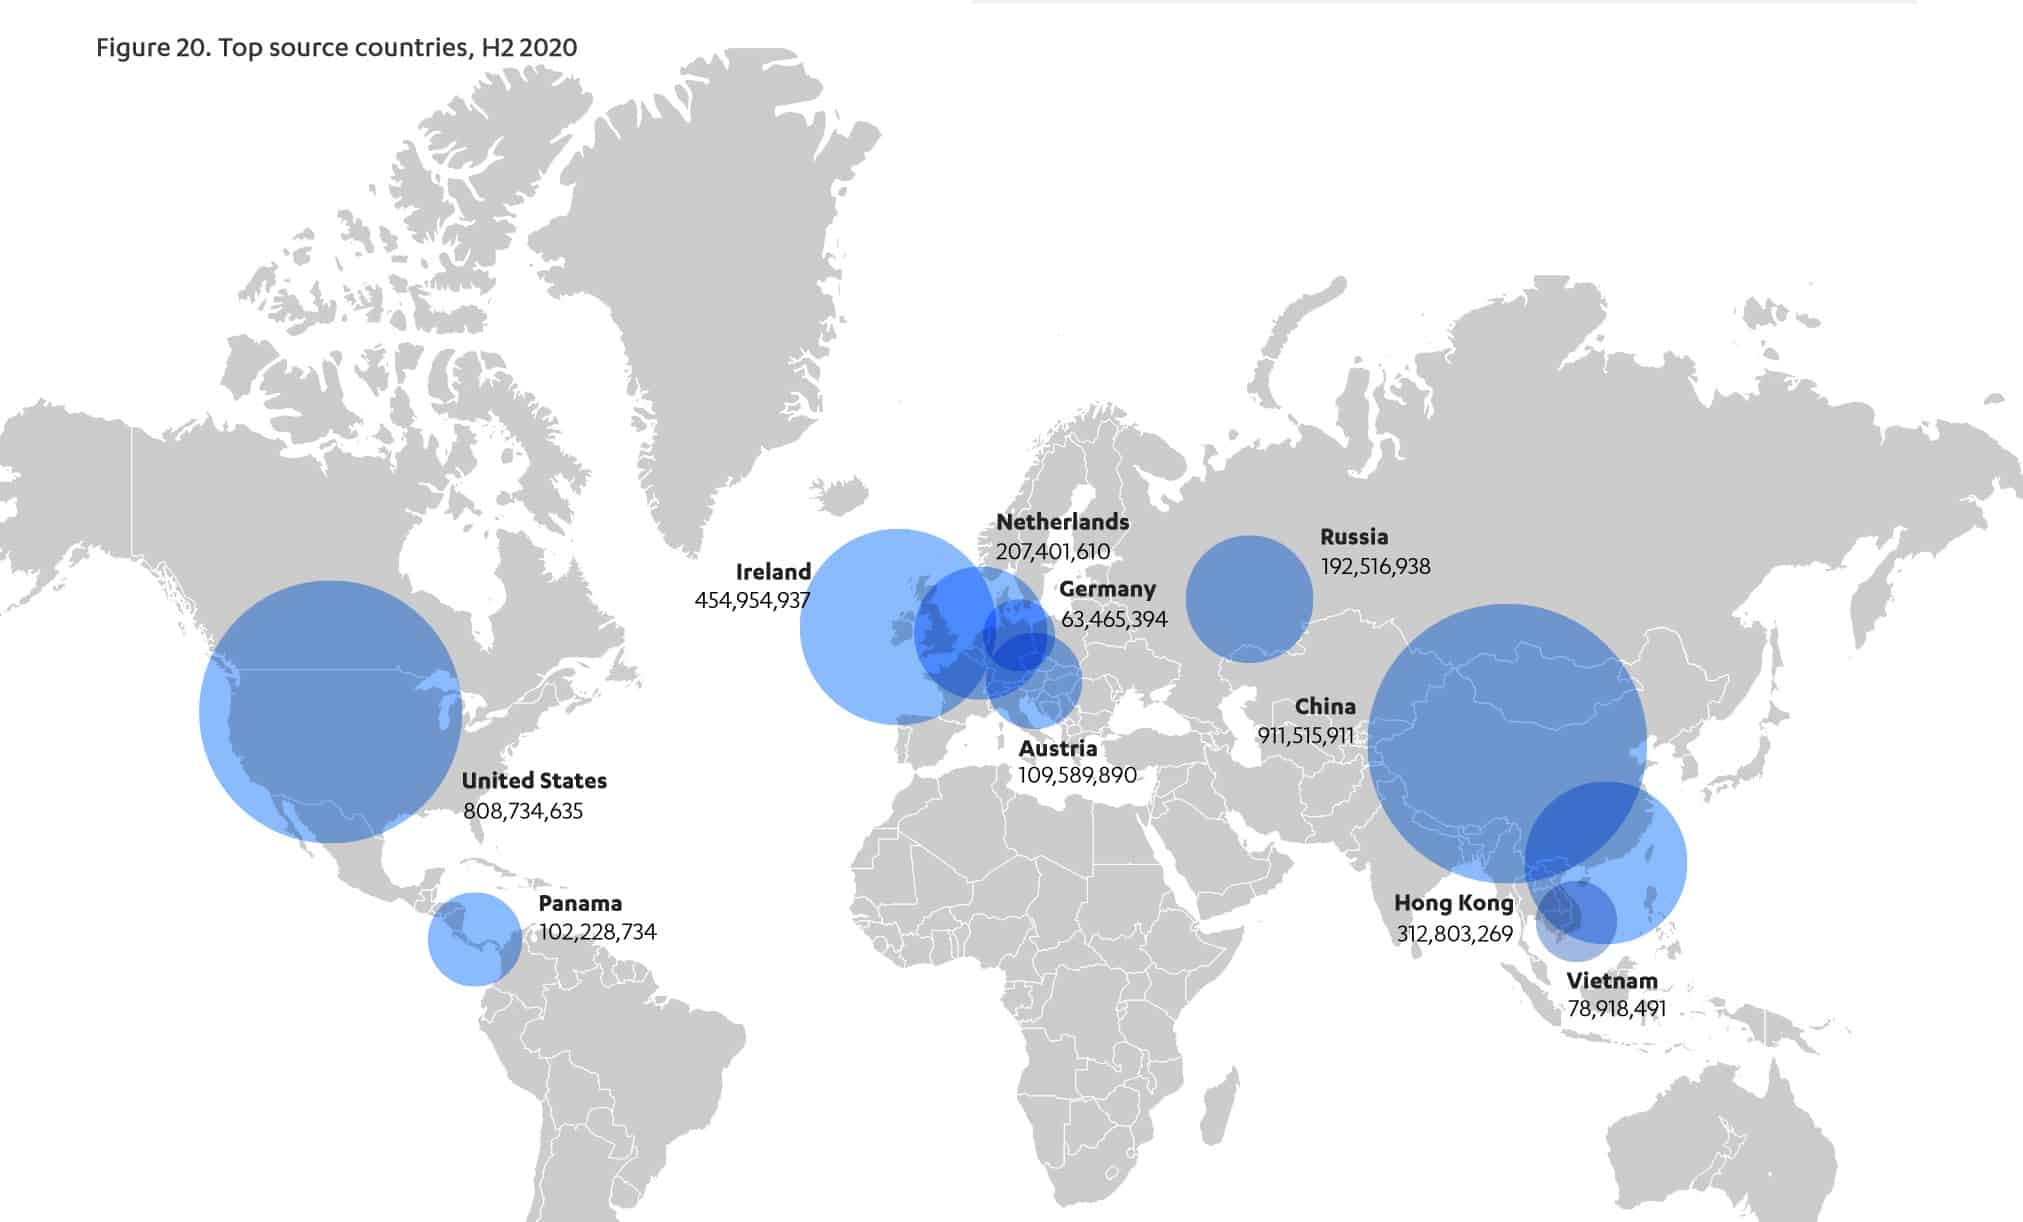
- In 2021, a single honeypot logged more than 7 billion attacks. (F-Secure Attack Landscape H1 2021)
- The vast majority of these attacks appeared to come from China, the US, and Ireland (though locations can be spoofed). (F-Secure Attack Landscape H1 2021)
- In 2020, more than 30 percent of all network-connected devices at the average business were IoT devices. (Palo Alto Networks’ State of Enterprise IoT Security)
- Medical imaging systems have the highest share of vulnerabilities, but CCTV cameras, printers, and VoIP phones are high-risk as well.

Palo Alto Networks’ State of Enterprise IoT Security - The Palo Alto report also found that 98 percent of IoT traffic was unencrypted. This has huge implications for client confidentiality and data security as anyone who cares to monitor the network could see everything.
- Security is a primary concern for IoT developers with 46% making it a top priority (up from 39% in 2020) (Eclipse 2021 IoT & Edge Developer Survey Report)
“In the first six months of 2023, SonicWall Capture Labs threat researchers recorded 77.9 million IoT malware attacks, up 37%
year to date and higher than any other six-month period on record”.
2023 SonicWall Cyber Threat Report – Mid-year Update
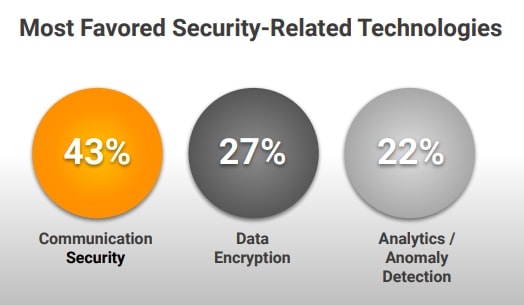
- The most widely used techniques in IoT security are communication security (43%) and data encryption (27%). (Eclipse 2021 IoT & Edge Developer Survey Report)
- The IoT security market was estimated to be worth around $6.6 billion in 2024, and with an expected growth rate of 33.53%, it could be worth over $28 billion by 2029. (Mordor Intelligence)
- IoT adoption is highest in the Asia-Pacific region, largely due to the adoption of smart city infrastructure (Morder Intelligence).

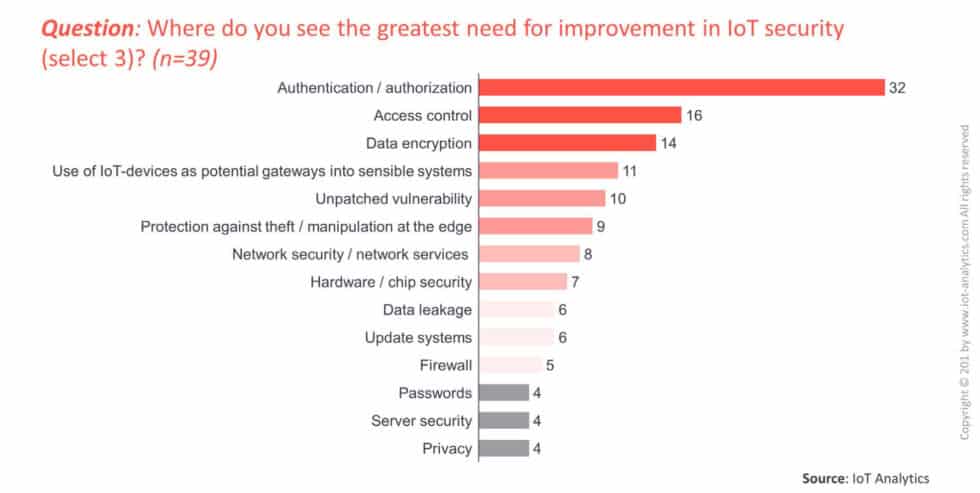
- As we’ve seen, default passwords are the core attack tactic, so the biggest IoT security issues that need to be solved are authentication/authorization (32%), followed by access control (15%) and data encryption (14%) (IoT Security Market Report 2017-2022)
IoT Security Market Report 2017-2022
- 57% of IoT devices may be vulnerable to attack. (Palo Alto Networks The Connected Enterprise: IoT Security Report 2020)
- Only 4% of developers believe there is no room for improvement in their IoT security practices. 25% believe a total overhaul is needed. (Palo Alto Networks The Connected Enterprise: IoT Security Report 2021)
- Only around one in four IT decision-makers use micro-segmentation to improve IoT device security. (Palo Alto Networks The Connected Enterprise: IoT Security Report 2021)
Social media scams and attacks spread like wildfire
With billions of users and everyday usage skyrocketing, social media platforms became a goldmine for cybercriminals and scammers.
Attitudes regarding social media seem to be changing but behaviors aren’t following suit, which leaves bad actors with plenty of opportunities to steal data and defraud users across the globe.
- Facebook breaches were responsible for a whopping 533 million leaked records in 2021 alone. (Business Insider)
- 96% of Baby Boomers are distrustful of social media when it comes to protecting their data, followed by 94% of Gen Xers, 93% of Gen Z, and 92% of Millennials. (The Blinding Effect of Security Hubris on Data Privacy by Malwarebytes)
An overwhelming majority of all users (94 percent) refrain from sharing personal information on social media and 95 percent of polled users felt an overall sense of distrust for social media networks. If given the option to “choose the lesser evil,” they’d rather forgo using social media than search engines.
The Blinding Effect of Security Hubris on Data Privacy by Malwarebytes
- The social media issue goes even deeper: 59% feel it’s unethical for social media platforms to tailor newsfeeds (RSA Data Privacy & Security Survey 2019)
- 67% of UK consumers believe recommendations based on purchase/browsing history are unethical (RSA Data Privacy & Security Survey 2019)
- Speaking of newsfeeds, did you know that around 30-40% of social media infections come from infected ads? (Bromium Into The Web of Profit – Social media platforms and the cybercrime economy)
- Cybercriminals are also leveraging social media to promote their hacking services: around 30-40% of the social media platforms feature accounts offering some form of hacking activities (Bromium Into The Web of Profit – Social media platforms and the cybercrime economy)
- Just 50 percent of people feel that the benefits of their online services outweight the privacy issues. Further, only 34 percent believe that companies are clear about the data they keep and how it is used (Delotte Connectivity and Mobile Trends Survey 2023)

- RSA found 500 social media groups dedicated to fraud, with a total of 220,000 members. 60% of those were on Facebook. (RSA 2020 Hiding in Plain Sight Report)
- WhatsApp is a popular fraud communication channel while Twitter is not preferred. (RSA 2020 Hiding in Plain Sight Report)
- During its study, RSA discovered over 15,000 compromised credit cards publicized on various social media networks. (RSA 2020 Hiding in Plain Sight Report)
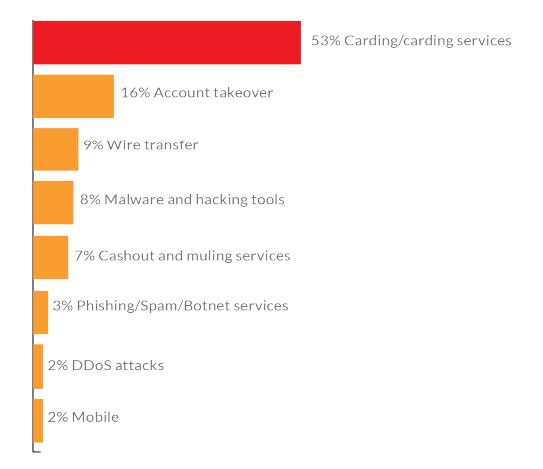
- This correlates to the fact that carding or carding services are the most popular fraud topics appearing in keywords in group names or searches. (RSA 2020 Hiding in Plain Sight Report)
RSA 2020 Hiding in Plain Sight Report
- At least 20% of social media infections stem from add-ons or plugins for social media platforms (Bromium Into The Web of Profit – Social media platforms and the cybercrime economy)
- Social media phishing is on the rise with social channels accounting for 8% of attacks. (2020 ENISA Threat Landscape Report – Phishing)
Data breaches and leaks expose everyone
So much personal and confidential data has leaked onto the web that it’s becoming a societal issue. Regulators around the world are trying to find solutions for this but, until they do, the onslaught continues.
- One of the earliest 2020 leaks (involving Microsoft) resulted in the leak of 250 million records. (Comparitech)
- The largest data breach in 2020 involved the leak of more than 10 billion records from CAM4, an adult cam site. (Security Boulevard)
- Other large breaches affected Advanced Info Service (AIS) (8.3 billion records), and Keepnet Labs (5 billion records). (Comparitech)
- In 2023, DarkBeam was breached, leaving more than 3.8 billion records, including login credentials, unprotected. (Cyber Security Hub)
- In 2021, 56% of companies in the US dealt with a data breach. Unfortunately, in 2023, security audit failure rates remain at 40 percent. (2023 Thales Data Threat Report)
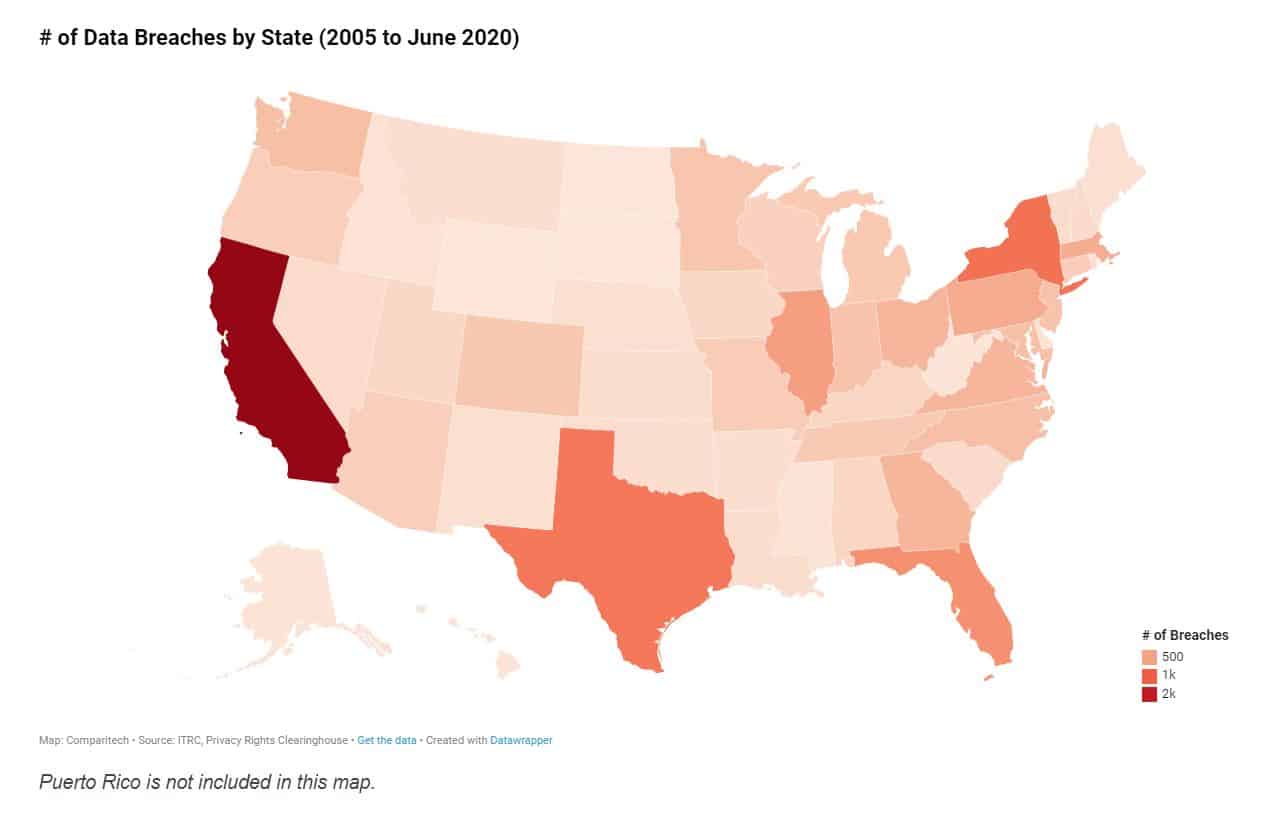
- The most commonly hit state is California with 5.6 billion records exposed in 1,777 breaches since 2005. (Comparitech)
- New York is second with 295 million records in 863 breaches and Texas is third with 294 million records in 819 breaches. (Comparitech)
There has been some good news though:
- In the first three quarters of 2023,there were 2,116 data breaches impacting US consumers. That’s a new record, up from 2022’s highs of 1,862. (Identity Theft Resource Centre)
- Surprisingly, despite the increase in the number of breaches, there was an almost 40 percent reduction in the number of victims for Q3 when compared to the year prior. (Identity Theft Resource Centre)
ITRC President & CEO Eva Velasquez strikes an ominous tone, saying:
“Now that we have broken the previous annual data comprise record, the question remains: by how much?”
Identity Theft Resource Center
So what are the main causes of these breaches?
- In Q3 2023, cyberattacks were found to be the root cause of 614 breaches. In total, these affected almost 64 million individuals. (Identity Theft Resource Center)
- Phishing was the most common reported type of cyber attack causing breaches, though with many impacted entities refusing to prove their attack vector, we can’t be certain that this is actually the most common. (Identity Theft Resource Centre)
- This is in agreement with the Verizon report that tells us almost 40% involved social engineering attacks, with phishing, pretexting, and bribery as the most common malicious actions. (Verizon 2021 Data Breach Investigations Report)
- This is a shift from earlier years when errors were the most common cause of breaches. (Verizon 2020 Data Breach Investigations Report)
- That said, errors still play a role, accounting for roughly one in ten breaches in 2023. (Verizon 2023 Data Breach Investigations Report)
- The use of stolen credentials was involved in more than 20% of breaches. (Verizon 2021 Data Breach Investigations Report)
- Ransomware was another common attack type, involved in 22% of breaches that had a cyber attack as their root cause. (Identity Theft Resource Center)
- The top hacking vector in breaches was web applications, involved in around 90% of hacking breaches. (Verizon 2021 Data Breach Investigations Report)
- Data breaches caused by human errors and system glitches resulted in an average loss of $3.24 million. (ENISA Threat Landscape 2020 – Data Breach)
- Point-of-sale and card-skimming breaches decreased in 2019, thought to be a result of widespread implementation of chip-and-pin cards and terminals. (ENISA Threat Landscape 2020 – Data Breach)
- Password dumper malware was the most common malware variety involved in breaches, followed by capture app data malware and ransomware. (Verizon 2020 Data Breach Investigations Report)
- The top malware vector involved in breaches was email links followed by direct installs and download by malware. (Verizon 2020 Data Breach Investigations Report)

Another big question is who and what are the targets of data breaches?
- Over 70% of breaches were financially motivated. This sounds like a lot, but it’s actually down from 86% the previous year. (Verizon 2021 Data Breach Investigations Report)
- The most affected industries by breaches targeting payment card data are retail (24%) and finance and insurance (18%). (2020 Trustwave Global Security Report)
- Small businesses are much more likely to be targeted, accounting for over 50% of all breaches. This is an almost 100% increase from last year, when they were the victims just 28% of the time. (Verizon 2021 Data Breach Investigations Report)
- Public organizations suffer the highest rate of data breaches, with healthcare and finance in second and third. (ENISA Threat Landscape 2020 – Data Breach)
- 2019 saw 400 reports of data breaches from healthcare organizations, a grim record for the industry. (ENISA Threat Landscape 2020 – Data Breach)
- It’s expected that healthcare breaches will increase by 10–15% over the next year. (ENISA Threat Landscape 2020 – Data Breach)
- 70% of cloud infrastructures were breached in a 12-month period. (State of Cloud Security 2020 report by Sophos)
- The most frequently compromised sets of data in breaches are credentials, personal data, medical information, bank details, and internal information. (Verizon 2021 Data Breach Investigations Report)
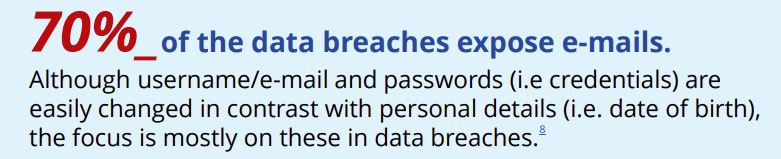
- 70% of data breaches expose emails. (ENISA Threat Landscape 2020 – Data Breach)
How much do criminals get for the data?
- As a result of the growing number of data breaches, personal data is easier to buy on the dark web than ever. For example, credit card details sell for $12–20. (We Live Security)
- American Express details are pricier, selling for $35, including the PIN. (We Live Security)
- For some reason, transfers of $1,000–3,000 cost $320 on average while higher transfers (over $3,000) sell for around $156. (We Live Security)
- Gmail accounts appear to be lucrative for criminals, selling for an average of $156 each. (We Live Security)
And who is carrying out breaches?
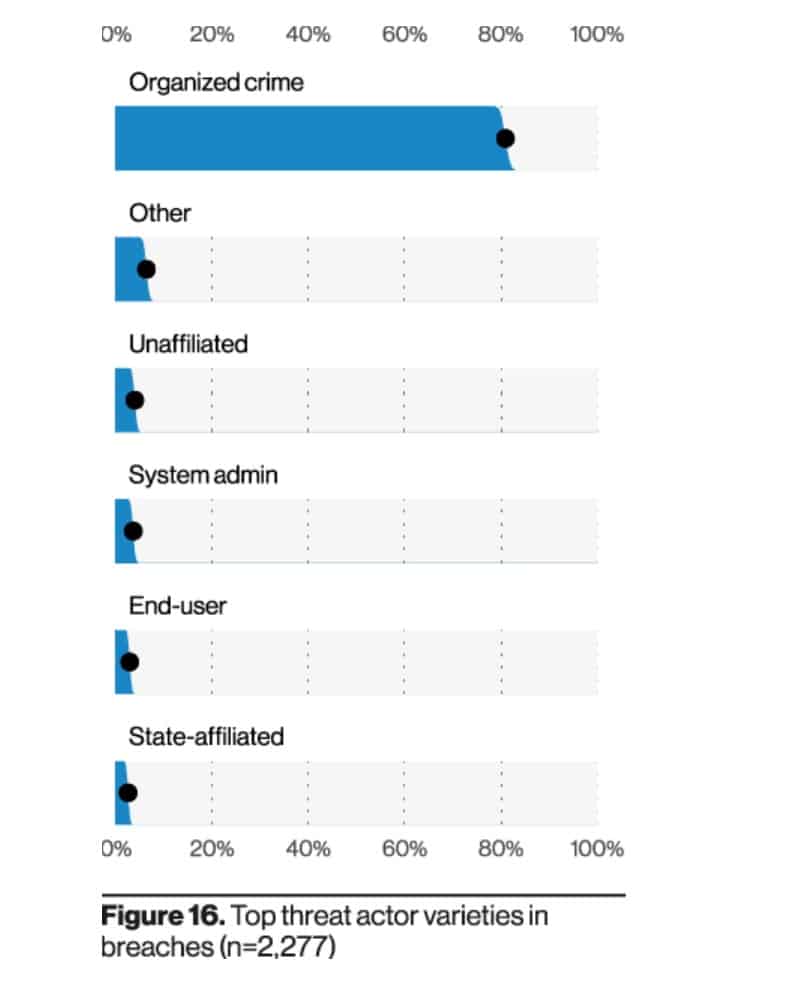
- The top actors are part of organized crime, responsible for around 80% of breaches. (Verizon 2021 Data Breach Investigations Report)
- Nation-state or state-affiliated actors, system admins, and end users are other key players, but are each only responsible for around 5% of breaches. (Verizon 2021 Data Breach Investigations Report)
- 67% of costs related to data breaches are incurred in the first year following a breach, but 22% are realized in the second year and 11% in the third. (ENISA Threat Landscape 2020 – Data Breach)
- Smaller organizations suffer higher data breach costs per employee than larger ones, at $3,533 and $204 respectively. (ENISA Threat Landscape 2020 – Data Breach)
How about the costs involved in data breaches?
- The average US data breach costs $4.24 million. (IBM 2021 Cost of a Data Breach Report)
- Companies lose an average of $1.59 million from lost business alone. (IBM 2021 Cost of a Data Breach Report)
- Large breaches involving 1–10 million records cost an average of $52 million. (IBM 2021 Cost of a Data Breach Report)
- Each record stolen in a breach costs an organization about $160. (IBM 2021 Cost of a Data Breach Report)
Perhaps more importantly, how effective are organizations at preparing for and dealing with breaches?
- It takes 287 days on average to contain a data breach. This is slightly longer than in 2019 (280 days). (IBM 2021 Cost of a Data Breach Report)
- It takes months or longer to discover 40% of breaches (Verizon 2021 Data Breach Investigations Report)
- Almost three-quarters (72%) of organizations detected their most significant breach within a month, but 28% took longer. (EY Global Information Security Survey 2020)
- 39% of organizations report that they don’t think they would detect a file-less malware attack. (EY Global Information Security Survey 2020)
- Only 7% of security leaders can quantify the financial impact of breaches. (EY Global Information Security Survey 2020)
- 50% of organizations only spend 6–15% of their security funds on securing data. (2020 Thales Data Threat Report)
- Having an incident response team at the ready can reduce the average cost of a breach by $2.46 million, a difference of 54.9%. (IBM 2021 Cost of a Data Breach Report)
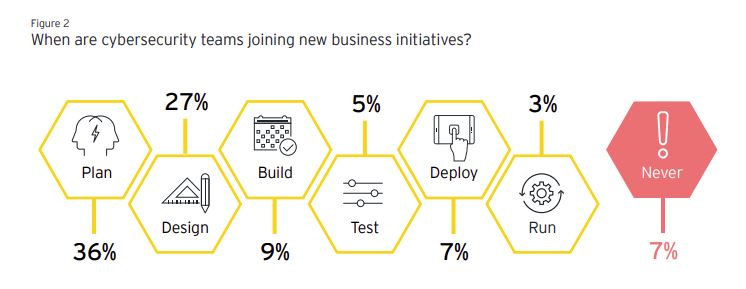
- Cybersecurity teams join the planning stage of 36% of business initiatives. (EY Global Information Security Survey 2020)
Additionally, our own research at Comparitech highlights that Wall Street swiftly reacts to data breaches. We analyzed how cybersecurity breaches impact stock market prices and found out that:
- On average, stocks immediately experience a drop of 0.43% in share price following a breach.
- Long-term effects include a much slower upturn in terms of share prices. We observed a 45.6% increase in share prices during the three years prior to breach, and only a 14.8% growth in the three years following the compromise.
- Breached companies recover to NASDAQ’s pre-breach performance level after 38 days on average, but three years after the breach they still underperform the index by a margin of over 40%.
- When they suffer a data breach, financial organizations experience an immediate decline in share price whereas internet businesses (e-commerce, social media, etc.) most frequently endure long-term effects.
- Larger breaches have less of a negative influence on share prices than smaller breaches.
- Breaches involving credit card details and social security numbers register a more significant negative impact on share prices than leaks containing less sensitive info, such as email addresses.

The entire analysis reveals other interesting consequences for breached companies, both in terms of financial aspects and non-financial ones, such as reputation and brand trust.
Related: Cyberwarfare explained
Users are more worried about cybercrime statistics but fail to follow through with protecting their assets
Cybersecurity statistics clearly show that technology has its limitations when it comes to safeguarding assets such as confidential data and money. To truly make strides in better protection from cybercriminals and online crooks, user behavior must be improved as well.
- 55% of people are worried about criminals accessing their data. (ENISA Threat Landscape 2020 – Data Breach)
- 92% of people know the risks of reusing passwords across their online accounts, which inherently leads to a higher risk of password theft and credential misuse. Despite this, 65% do it anyway. (LastPass Pyschology of Passwords 2021)
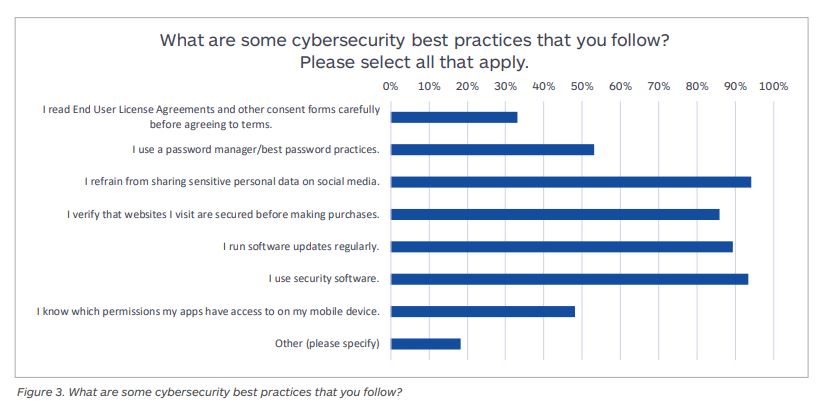
- 66% of surveyed users said they simply skim through or do not read end-user license agreements or other consent forms. (The Blinding Effect of Security Hubris on Data Privacy by Malwarebytes 2019)
- Only 47% know which permissions their apps have. (The Blinding Effect of Security Hubris on Data Privacy by Malwarebytes 2019)
- 78% of people in the UK are most concerned about identity theft resulting in financial loss. (RSA Data Privacy & Security Survey 2019)
- 96% of people polled for a study mention they care about their privacy, and 93% of them use security software. (The Blinding Effect of Security Hubris on Data Privacy by Malwarebytes 2019)
- 75% of consumers now limit the amount of personal information they share online (RSA Data Privacy & Security Survey 2019)
- And they do so for good reason: internationally, 36% of people surveyed by RSA said their personal information was compromised in a data breach over the last 5 years, and 45% of US respondents confirmed the same. (RSA Data Privacy & Security Survey 2019)
- What’s more, 58% of U.S. respondents said they’d consider divesting from companies that disregard protecting their data. (RSA Data Privacy & Security Survey 2019)
- But there’s good news as well: a little over 53% of people now use password managers. (The Blinding Effect of Security Hubris on Data Privacy by Malwarebytes 2019)
The issues are even bigger in an organizational environment, whether private or public:
- 1 out of 3 employees risk running malware on a work computer. (Penetration testing of corporate information systems: statistics and findings 2019 – Positive Technologies)
- When penetration testers were on the field, they discovered that 1 out of 7 employees engaged in dialog with an imposter and disclosed confidential information. (Penetration testing of corporate information systems: statistics and findings 2019 – Positive Technologies)
- 1 out of 10 employees entered account credentials in a fake authentication form. (Penetration testing of corporate information systems: statistics and findings 2019 – Positive Technologies)
- Each employee has access to an average of 11 million files. (2021 Varonis Financial Services Data Risk report)
- Around two-thirds of companies have more than 1,000 sensitive files that are left open for anyone to view. (2021 Varonis Financial Services Data Risk report)
- 6 out of 10 companies have over 500 passwords that never expire (2021 Varonis Financial Services Data Risk report)
GDPR statistics
GDPR came into force on May 25, 2018, and everyone rushed to comply, fearing huge fines and other legal repercussions. Did it work as expected? Let’s check what the numbers have to say.
- €1.1 billion ($1.2 billion) in fines have been issued since 28 January 2021. (DLA Piper GDPR fines and data breach survey: January 2022)
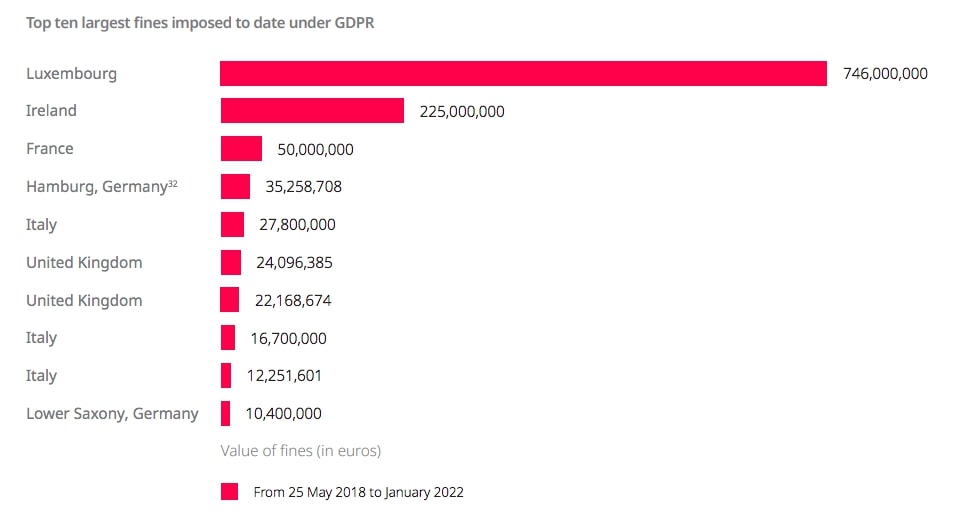
- Luxembourg’s data protection supervisory authority (CNPD) fined Amazon €746 million ($843 million) in July 2021, the largest GDPR-related fine to date (DLA Piper)
- The second largest fine (€225 million) so far was issued in Ireland against WhatsApp Ireland Limited, and the third largest (€50 million) was against Google in Italy (DLA Piper)
- In terms of total value of fines, Luxembourg is top having issued €746 million in fines. Ireland ranks second with fines reaching a total of 226 million (DLA Piper)
- Under the EU GDPR, companies can be fined up to €20 million or 4% of their annual turnover, whichever is higher. (IT Governance)
- In the first year of the GDPR, over 144,000 complaints were filed. (Access Now)
- France’s CNIL received 30% more complaints in the first year of the GDPR than in the previous year. (Access Now)
- More than 89,000 breach notifications were submitted in that first year. (Access Now)
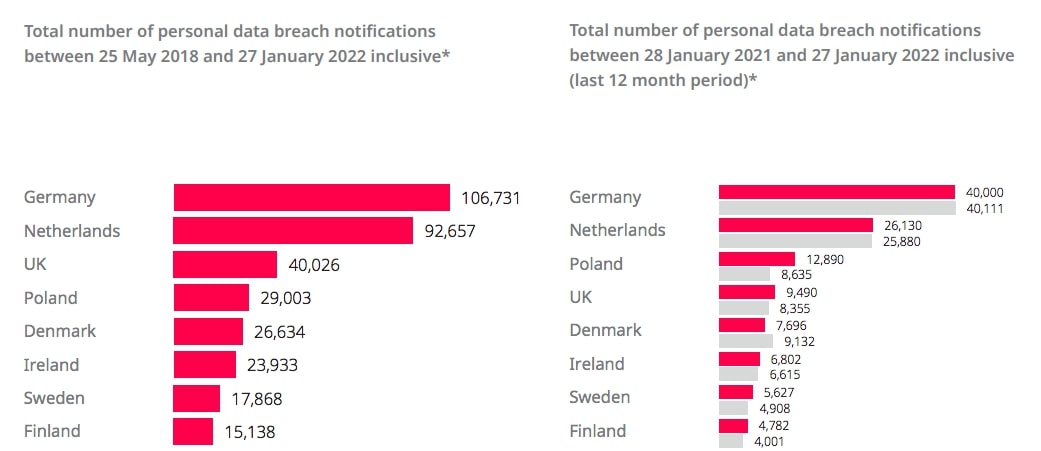
- Germany has had the highest number of data breaches reported since the GDPR was introduced with over 106,731. The Netherlands is second with 92,657, and the UK third with 40,026. (DLA Piper)
- We are starting to see a trend of initially large fines being reduced after legal action such as a 90% reduction on a British Airways fine and an 80% reduction on a fine against Marriott. (Bank Info Security)
Legal experts say that with British Airways and Marriott having seen final fines that were a fraction of what regulators first proposed, any organization that gets hit with a GDPR fine will likely seek similar concessions.
Bank Info Security
- Awareness of the GDPR is fairly high with over two-thirds (69%) of people in the EU-27 having heard about it. (FRA)
- Men are slightly more aware (71%) than women (67%) of the GDPR. (FRA)
- Poland has the highest rate of GDPR awareness at 95% (FRA)
- 71% of people are aware of their respective data protection authority with those in the Czech Republic being the most aware (90%). (FRA)
- 60% of people in the EU-27 know that they may access personal data held by public administrations but only 51% are aware the same applies to private companies. (FRA)

Cost of cybercrime stats
There’s a lot of data to dig into when it comes to the financial toll of cybercrime. Seeing the shocking figures below could help encourage proactive behavior when it comes to cyber defenses.
The big-picture view is that up to 1% of the world’s GDP is now being lost to cybercrime, according to McAfee The Hidden Costs of Cybercrime 2020. What’s more, the cost of cybercrime to the global economy has increased more than 50% in two years.
Since 2018, we estimated that the cost of global cybercrime reached over $1 trillion. We estimated the monetary loss from cybercrime at approximately $945 billion. Added to this was global spending on cybersecurity, which was expected to exceed $145 billion in 2020. Today, this is a $1 trillion dollar drag on the global economy.
McAfee

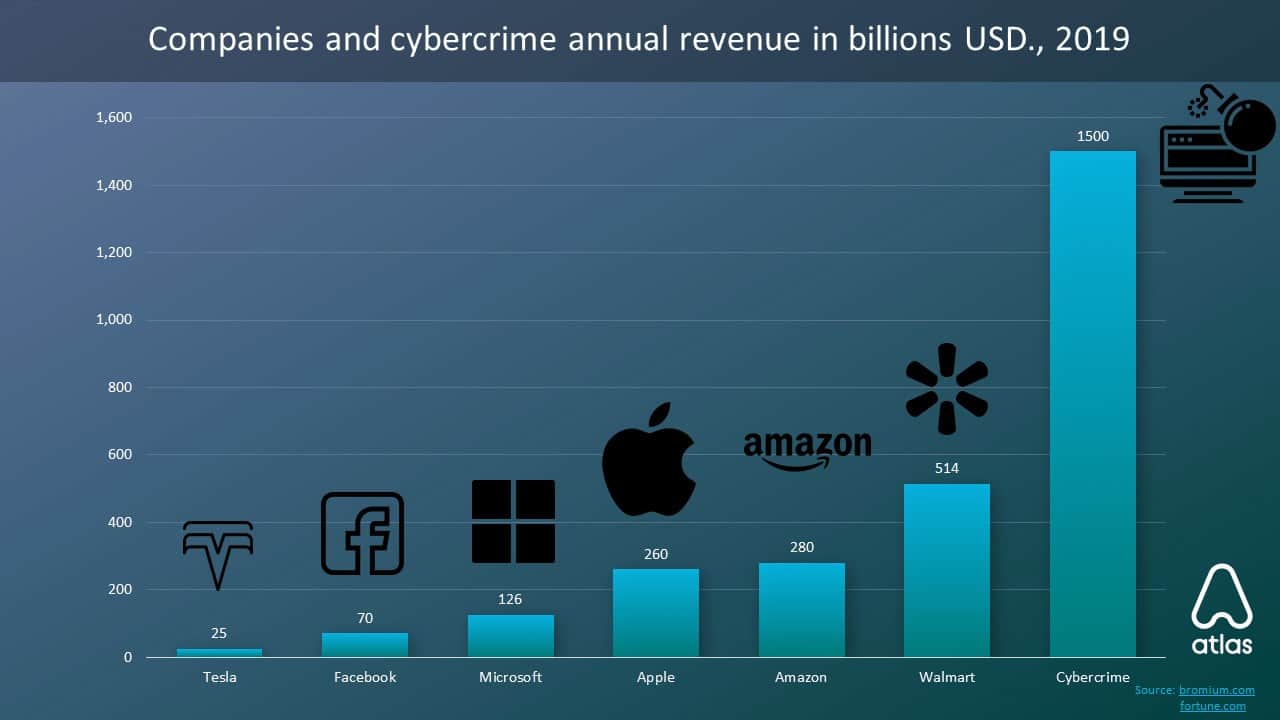
And a study by Atlas VPN found that cybercrime is earning criminals $1.5 trillion annually. This is almost three times the size of Walmart’s revenue. (Atlas VPN)
It’s perfectly natural to feel a bit overwhelmed by these figures. Even when looking at yearly developments, the data is a compelling argument for improving cybersecurity strategies.
If it were measured as a country, then cybercrime — which is predicted to inflict damages totaling $6 trillion USD globally in 2021 — would be the world’s third-largest economy after the U.S. and China.
The varied ways in which cyber criminals amass these large sums of money range from massive operations to spray-and-pray attacks, the latter targeting a large number of victims in the hope that it will compromise some of them.
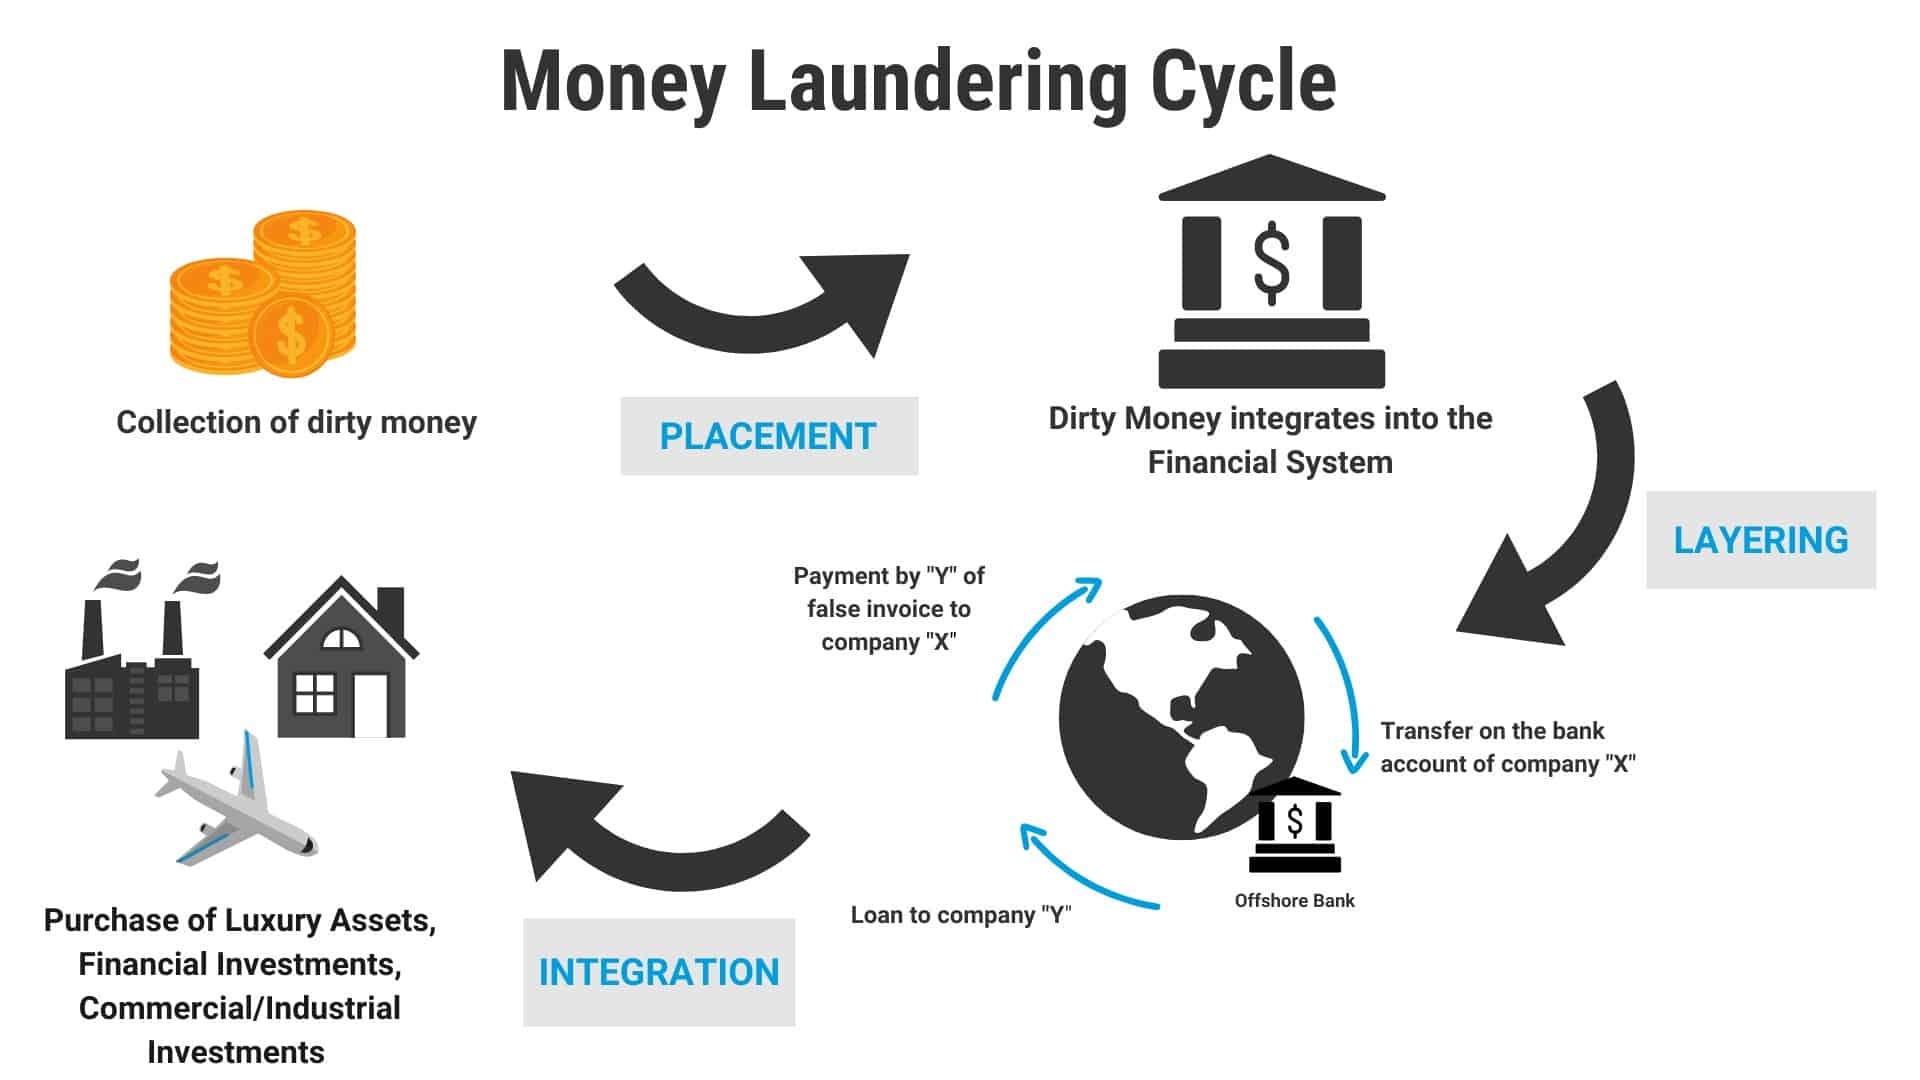
Wondering how they manage to move these huge sums without being caught? Here’s what the studies reveal about money laundering alone:
The United Nations Office on Drugs and Crime estimates that 2–5% of global GDP is laundered each year. This equates to $800 billion–$2 trillion.
Money laundering cycles involve three stages: placement, layering, and integration.
However, malicious hackers and scammers are also spending money, “investing” in assets that can make their attacks more effective. Here are some of the prices as observed in the Armor Dark Market Report 2020:
- Generic ransomware: $1.99–6.50
- Unhacked Remote Desktop Protocol (RDP) servers: $9.99–25 per server
- Hacker university degree: $125
- Various malware: $2.68–80
- ATM skimmers: $700–1,500
- Card readers or writers: $149–990
- Phones: $179 for an iPhone 11 Max Pro
- Underground market vendor shop setup: €5,000–10,000
- Destruction of a target’s business: $185
- Rent access to popular software: $500 per month
- SMS spamming service: $18.99–19.99 for 1,000 SMS
- Bulletproof hosting (web hosting for content such as fraud, money laundering, and porn): $4–19 per month
- Telephone Denial of Service (TDoS) attacks: $132.30 for 7,000 calls in 72-hour period
- Money transfer services: $1,000 for a $15,000 balance
However, other reports show criminals pay far more for their tools. For example, zero-day exploits tend to fetch big money, with one critical Zoom zero-day exploit being sold for $500,000 in March 2020. Another report tells us criminals may pay $60,000 for an Adobe reader zero-day exploit and up to $2,500,000 for an iOS zero-day exploit.
- Marketplaces are larger than one might imagine: some dark web markets claim to have up to 1 million visitors each month. (Armor Dark Market Report 2020)
- Hydra is the largest marketplace within the darknet. Between 2016 and 2019, its 5,000 shops saw $1 billion in sales. (Signal)
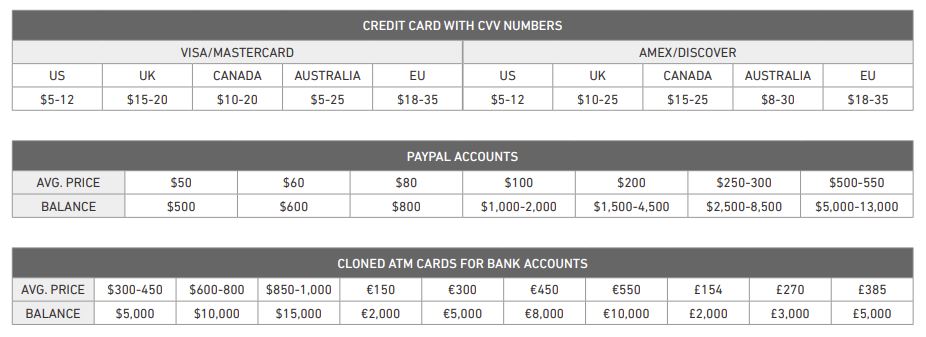
Many tools used by attackers are getting cheaper and personal data used in attacks is inexpensive too. Even PayPal account credentials sell for as little as $50. (Armor)
Other prices revealed by Armor include:
- Visa/Mastercard/Amex/Discover credit card with CVV numbers: $5–35
- Cloned ATM cards: $300–$1,000
- Fullz data (includes name, date of birth, address, mother’s maiden name, SSN, driver’s license number: $15–60
- Business fullz data (bank account numbers, EIN, certificate of business, corporate officer’s names, birth dates, SSN): $35–60
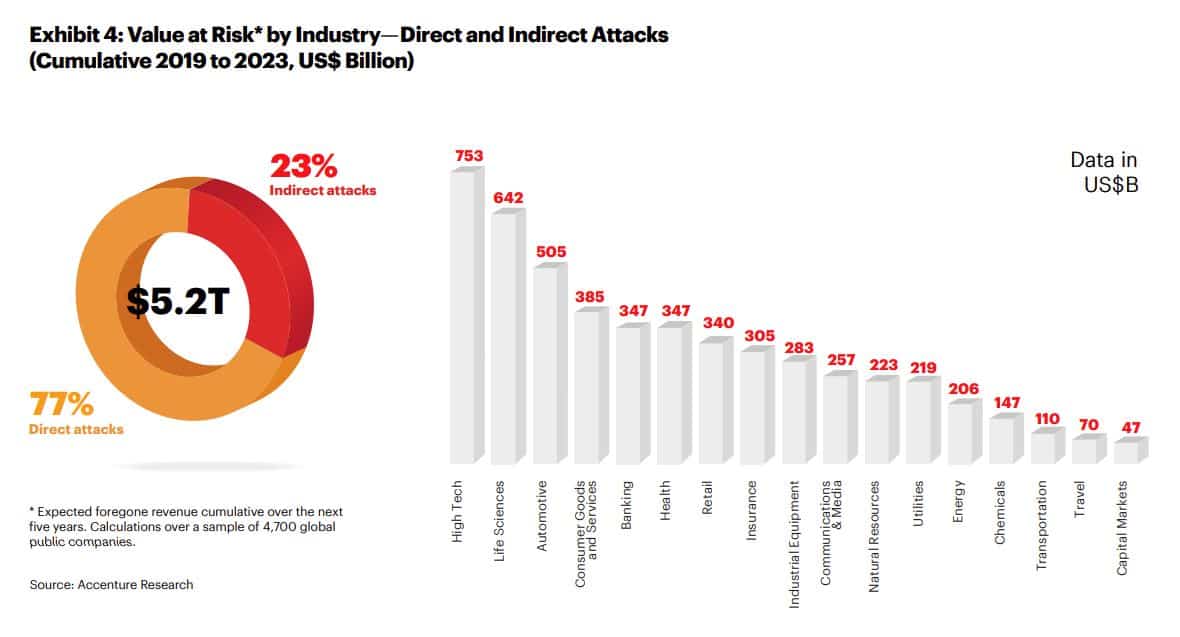
One report breaks down cost predictions by industry. Between 2019 and 2023, it predicts the following value at risk as a result of direct and indirect attacks:
- High tech: $753 billion
- Life sciences: $642 billion
- Automotive: $505 billion
- Consumer goods and services: $385 billion
- Banking: $347 billion
- Health: $347 billion
- Retail: $340 billion
- Insurance: $305 billion
Securing the Digital Economy: Reinventing the Internet for Trust
Statistics about current and future cybersecurity costs abound and cover multiple angles:
- $590,000: The cost of downtime to a given department. (McAfee The Hidden Costs of Cybercrime 2020)
- $965,000: The average cost of downtime for engineering departments. (McAfee The Hidden Costs of Cybercrime 2020)
- 68%: The percentage of organizations that have experienced downtime due to security incidents. (McAfee The Hidden Costs of Cybercrime 2020)
- $71 million: The cost of a single 2019 ransomware attack against Norsk Hydro. (McAfee The Hidden Costs of Cybercrime 2020)
- $3 billion: The estimated damage costs to Maersk as a result of the NotPetya ransomware attack. (McAfee The Hidden Costs of Cybercrime 2020)
- $300 million: Losses by FedEx as a result of the NotPetya ransomware attack. (McAfee The Hidden Costs of Cybercrime 2020)
- 26% of companies reported brand damage as a result of a cyberattack. (McAfee The Hidden Costs of Cybercrime 2020)
- £73 million: The amount the NHS spent on IT support in the wake of the WannaCry attack. (McAfee The Hidden Costs of Cybercrime 2020)
- $188,525: The average payout of successful cyber insurance claims (only 28.4% are successful). This is far lower than the average cost of a cyberattack ($590,000). (McAfee The Hidden Costs of Cybercrime 2020)
- $5.5 billion: The value of the cyber insurance market in 2020. (McAfee The Hidden Costs of Cybercrime 2020)
- $2.1 billion: The amount lost in Business Email Compromise (BEC) scams between 2014 and 2019. (McAfee The Hidden Costs of Cybercrime 2020)
- $3.2 billion: The level that global smart grid cybersecurity spending will reach by 2026 (Smart Energy)
- $610 million: The cost of the August 2021 Poly Network hack, the biggest cryptocurrency heist to date. (Comparitech)
- $2.2 million per month: This is how much money cyber criminals can make with just 10 stolen credit cards bought from the underground markets. This is why formjacking is making a fast comeback as a preferred attack tactic (2019 Internet Security Threat Report by Symantec)
- $30,000: The average cost for a BEC hack (Verizon 2021 Data Breach Investigations Report)
Kaspersky analyzed the cost of data breaches, breaking down costs for SMBs and enterprises. Here are some highlights:
- The average financial impact of a breach for SMBs has declined since 2019, from $101,000 to $98,000.
- Costs have previously been fairly evenly distributed across the following five top items:
-
- Additional internal staff wages ($14,000)
- Lost business ($13,000)
- Employing external professionals ($12,000)
- Improving software and infrastructure ($12,000)
- Training ($11,000)
- Other costs included extra PR, new staff, damage to credit rating and insurance premiums, penalties and fines, and compensation. (Kaspersky: Measuring the Financial Impact of IT Security on Businesses)
- For enterprises, the average financial impact was $1.09 million, with lost business ($141,000), additional internal staff wages ($134,000), and employing external professionals ($132,000) incurring the largest portion of costs in 2020. (Kaspersky)
- Kaspersky also broke down the regional costs, with North America ($141,000) being the costliest place for SMBs to experience a data breach, followed by APAC with China ($116,000) and META ($113,000). (Kaspersky)
- For enterprises, Japan ($2 million) was the most expensive place to suffer a data breach in 2020, followed by North America ($1.2 million) and META ($1.1 million). (Kaspersky)
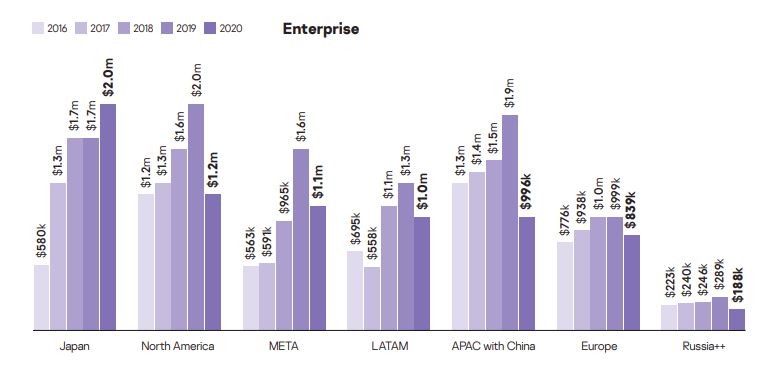
Kaspersky
DDoS attacks have a range of costs associated with them too:
- 91% of companies say a DDoS attack cost their business up to $50,000. (Corero Impact of DDoS on Enterprise Organizations)
- The most damaging effect of a DDoS attack is lost customer confidence and trust. Lost revenue is the fourth most damaging. (Corero Impact of DDoS on Enterprise Organizations)
The US Internet Crime Complaint Center (IC3) breaks down complaints and costs according to age group, state, and type of crime. It received over 2 million complaints in the past five years, totalling losses of more than $13 billion. (IC3 Internet Crime Report 2020)
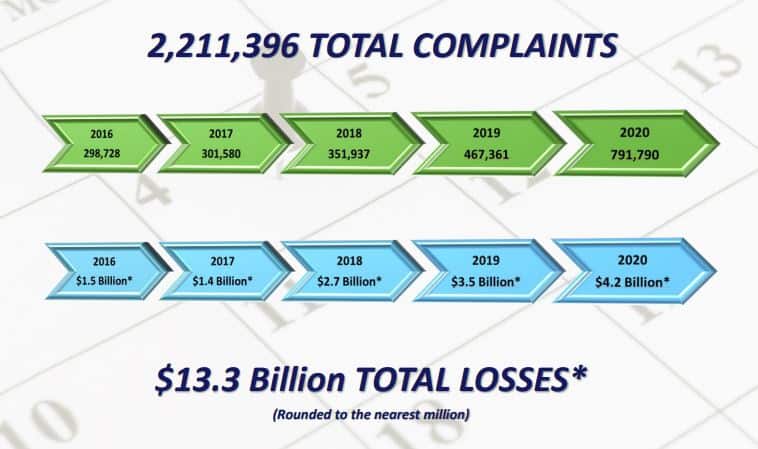
- $966 million: The losses incurred by over 60s according to 105,301 complaints to the Internet Crime Complaint Center (IC3). Those aged 50–59 have lost almost $850 million in 85,967 complaints. (IC3 Internet Crime Report 2020)
- In 2020, it received almost 800,000 complaints with losses totalling $4.2 billion. (IC3 Internet Crime Report 2020)
- The state with the largest victim losses was California ($621 million), followed by New York ($416 million), Texas ($314 million), and Florida ($295 million). (IC3 Internet Crime Report 2020)
- BEC and Email Account Compromise (EAC) caused the largest losses in 2020 ($1.87 billion) followed by confidence or romance fraud ($600 million) and investment schemes ($336 million). (IC3 Internet Crime Report 2020)
Atlas VPN has been conducting much research into cybercrime and its costs:
- Illegal online markets are the biggest money-makers for cybercriminals, accounting for $860 billion in earnings. Trade secrets and IP theft earn $500 billion and data trading nets $160 billion. (Atlas VPN)
- Ransomware earns criminals at least $1 billion each year while Cybercrime-as-a-Service (CaaS) brings in $1.6 billion. (Atlas VPN)
- Blockchain hackers stole $3.8 billion in 122 attacks in 2020. (Atlas VPN)
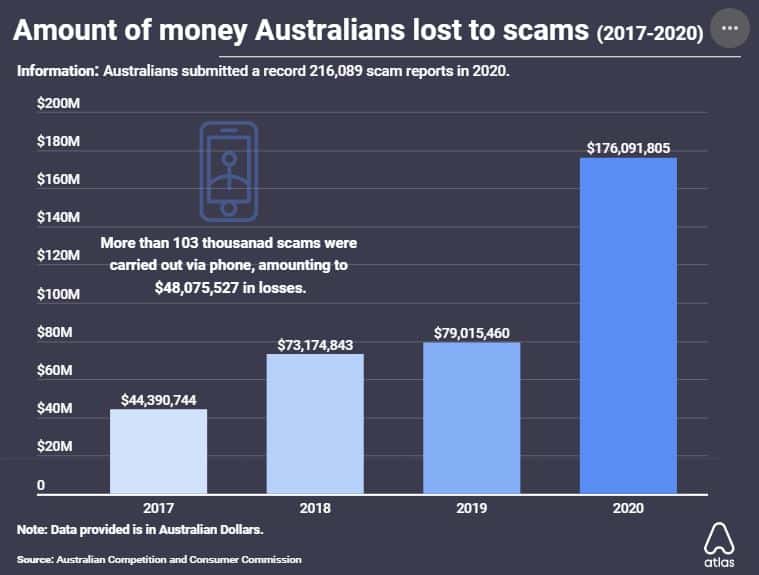
- Australians lost $176 million in 216,000 scams in 2020. This was more than double the 2019 amount of $79 million. (Atlas VPN)
- Australians lost by far the most money ($66 million) to investment scams followed by dating and romance scams ($37 million) and false billing ($18 million). (Atlas VPN)
Cybersecurity spending trends
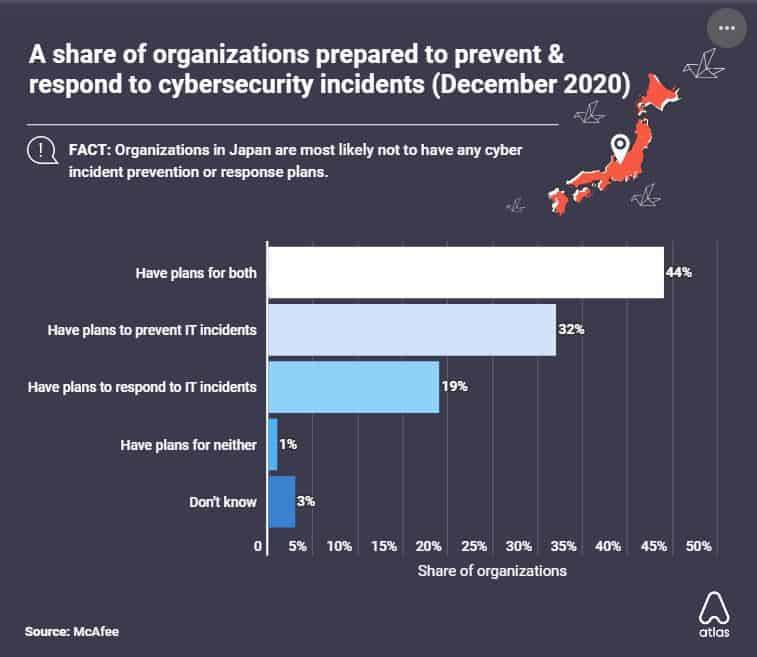
Almost everyone falls victim to cyber-attacks nowadays. However, only 44% of companies have both a prevention and response plan for IT security incidents. (Atlas VPN)
Even though a limited number of companies are being proactive, global spending on cybersecurity was $145 billion in 2019. (McAfee The Hidden Costs of Cybercrime 2020)
Here are some more interesting spending statistics to digest:
- 47% of organizations planned to spend more on cybersecurity in 2021. (ESG Master Survey Results: 2021 Technology Spending Intentions Survey)
- There were 1,483 cybersecurity companies in the UK in 2020, representing a 21% growth over 2019. (Atlas VPN)
- Over 30% of executives said the actions required to remediate security incidents were “difficult and expensive.” (Verizon Mobile Security Index 2021)
- Cybersecurity spending is defensive instead of innovative with 77% spent on risk and compliance instead of opportunity. 42% say risk reduction is the primary driver and 18% cite compliance or regulatory requirement as the key determinant. (EY Global Information Security Survey 2021)
- Spending on new initiatives comprises only 5% or less of the average cybersecurity budget. (EY Global Information Security Survey 2020)
- Only about 19% of organizations say that they consider cybersecurity when planning new initiatives. (EY Global Information Security Survey 2021)
- 53% of businesses spend more than half their cybersecurity budget on operations. (EY Global Information Security Survey 2020)
- 43% spend less than a quarter of their cybersecurity budgets on long-term investment and capital projects. (EY Global Information Security Survey 2020)
The way we’ve organized cybersecurity is as a backward-looking function, when it is capable of being a forward-looking, valueadded function.
Kris Lovejoy, EY Global Advisory Cybersecurity Leader (EY Global Information Security Survey 2020)
The effectiveness of cybersecurity spending is in question:
- Only 9% of organizations believe their cybersecurity measures protect the business from major attacks — a significant decline from the already low figure of 20% from 2020. (EY Global Information Security Survey 2021)
- 60% of organizations “cannot quantify the effectiveness of their cybersecurity spending to their boards.” (EY Global Information Security Survey 2020)
- 28% of cybersecurity budgets are spent on Security Operations Center (SOCs) but only 26% of SOCs identified their respective company’s most significant breach. (EY Global Information Security Survey 2020)
This might be because many organizations continue to operate with first-generation SOCs that require significant amounts of manual intervention — particularly given the reluctance (or inability) to invest in future-proofing. Only 19% of budget is currently going towards architecture and engineering.
EY Global Information Security Survey 2020
A Deloitte survey has some slightly different figures for us:
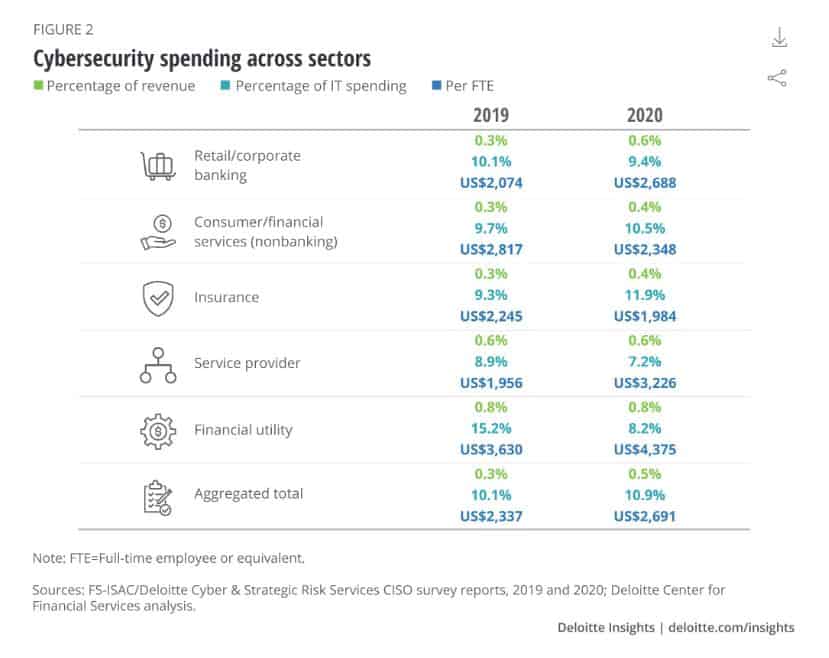
- Companies spent more on cybersecurity in 2020 than in 2019 (0.48% of overall revenue versus 0.34% in 2019). (Deloitte and FS-ISAC survey 2020)
- Organizations are spending 10.9% of their IT budget on cybersecurity compared to 10.1% in 2019. (Deloitte and FS-ISAC survey 2020)
- This equates to an average of $2,691 per employee in 2020 and $2,337 per employee in 2019. (Deloitte and FS-ISAC survey 2020)
Deloitte breaks down cybersecurity spending as a percentage of IT spending across industry sectors in 2020:
- Retail/corporate banking: 9.4%
- Consumer/financial services (non-banking): 10.5%
- Insurance: 11.9%
- Service provider: 7.2%
- Financial utility: 8.2%
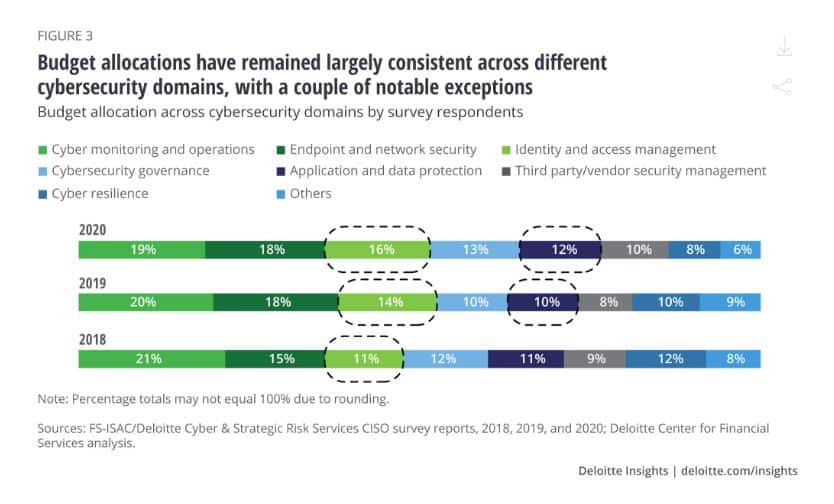
We can also see which cybersecurity domains these budgets are being spent on:
- Cyber monitoring and operations: 19%
- Endpoint and network security: 18%
- Identity and access management: 16%
- Cybersecurity governance: 13%
- Application and data protection: 12%
- Third party/vendor security management: 10%
- Cyber resilience: 8%
- Other: 6%
These figures haven’t shifted much since 2018.
Overall security strategy (95%) and review of current threats and security risks (88%) are the cybersecurity areas garnering the most interest from boards and management teams. (Deloitte and FS-ISAC survey 2020)
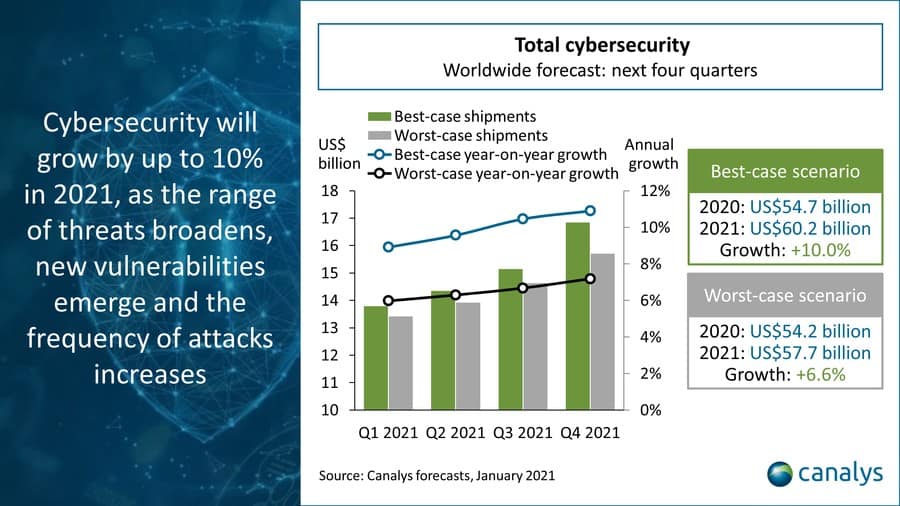
What about future spending? Canalys’ Global cybersecurity 2021 forecast gives us some insight. Global cybersecurity spending could feasibly increase 10% in the next year. 6.6% is a worst-case scenario outlook. (Canalys’ Global cybersecurity 2021 forecast)
The report breaks down forecasts by solution type, with the following worst and best-case growth rates:
- Web and email security: 8.8–12.5% growth
- Vulnerability and security analytics: 7.5–11.0% growth
- Endpoint security: 6.2–10.4%
- Identity access management: 8.1–10.4%
- Network security: 4.2–8.0%
- Data security: 4.2–6.6%
PwC’s Global Economic Crime and Fraud Survey 2020 has some more interesting statistics and forecasts too:
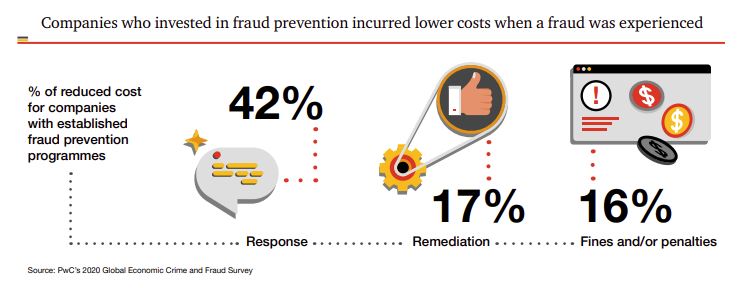
- 4 out of 10 respondents anticipate increasing fraud prevention spending in the next two years. (PwC’s Global Economic Crime and Fraud Survey 2020)
- Companies that operated a fraud prevention program ended up spending 17% less on remediation and 42% less on responses compared to companies that didn’t have those programs in place. (PwC’s Global Economic Crime and Fraud Survey 2020)
- Companies that had a bribery and corruption program had 58% lower costs when dealing with a related incident than companies without a program. (PwC’s Global Economic Crime and Fraud Survey 2020)
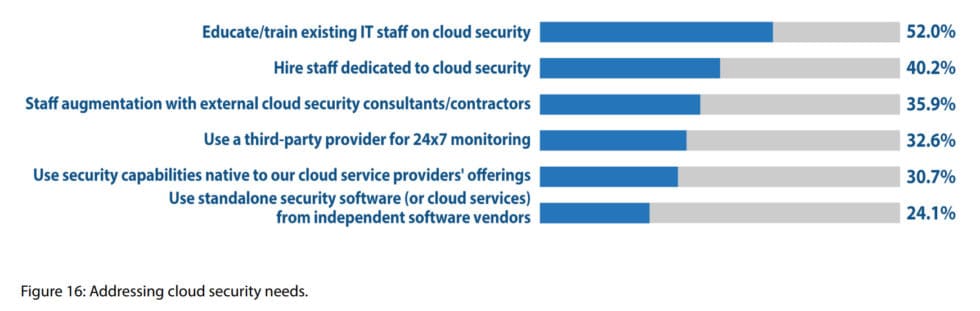
Human resource limitations: over 50% of organizations are “re-training existing IT staff to tackle cloud security challenges” (Imperva 2019 Cyberthreat Defense Report)
Cybersecurity statistics point out that companies are working on improvements in several areas:
- 85% of companies are interested in replacing passwords with new forms of authentication. (Oracle and KPMG Cloud Threat Report 2019)
- “53% are using machine learning for cybersecurity purposes.” (Oracle and KPMG Cloud Threat Report 2020)
In order to achieve these improvements and more, organizations worldwide are increasing their spending. However, information security spending numbers show there are many differences across sectors and company sizes.
Kaspersky’s Investment adjustment: aligning IT budgets with changing security priorities and its 2022 IT Security Economics report give us some insight in SMB cybersecurity spending:
- 14% of SMBs and enterprises intend to increase IT investment over the next two years. (Kaspersky)
- IT security accounted for 26% of overall IT budgets for SMBs in 2020 compared to 23% in 2019. (Kaspersky)
- For enterprises, Kaspersky found that the figure was 29%. (Kaspersky)
- SMBs increasing their budget cite more complex IT infrastructure (52%), the need to improve security expertise (44%), and a desire to improve defenses (36%). Enterprises increasing budgets have similar reasons. (Kaspersky)
- 11% of enterprises and 9% of SMBs intend to decrease IT security budgets in the next three years.
- 32% of senior management don’t see why companies should be investing so much in the future, which threatens to drive down IT security spending. (Kaspersky)
- 29% of SMBs are lowering overall expenses to optimize budgets, another reason IT security spending could be reduced. (Kaspersky)
Cybersecurity jobs growth
As of 2023, there were 3.5 million unfilled cybersecurity jobs globally, with around 750,000 in the US alone. (Schneier on Security).
59 percent of respondents whose organizations experienced more cyberattacks in the past year report being somewhat or significantly understaffed.
ISACA State of Cybersecurity 2023
- 27 percent of cybersecurity professionals said that their company was struggling to keep up with staff turnover. Despite this, 45 percent know someone in the same field who’d been laid off that year. (ISC2 Report 2023)
- 86.6% of organizations are challenged by IT security skills shortage, up from 84.1% in 2022 (Imperva 2023 Cyberthreat Defense Report)
- Women make up just a quarter of the infosec workforce worldwide (Women in Cybersecurity report 2022)
- 1,178,662 people worked in cybersecurity in the US in Q1 2024 (Cyberseek)
- There were 572,392 job openings for information security specialists across the United States during this time. This shows increased hiring, and a slight reduction in the number of available positions. (Cyberseek)
- The three most requested job titles by companies in the US were in 2021 were: Cybersecurity Enginner, Cybersecurity Analyst, and Cybersecurity Consultant (Cyberseek)
- 50% of surveyed companies are considering training their employees to improve their cybersecurity program (Comptia 2024 Trends in Cybersecurity)
- The average yearly salary for a security engineer in the US is $88,000 and the same role in the UK pays £52,500 ($72,000) a year (Finding your first job in cyber security)
- An Information Security Analyst made an average yearly salary of $112,000 in 2022 (US Bureau of Labor Statistics)
- 30% of organizations use third-party firms occasionally for information security projects (Comptia 2024 Trends in Cybersecurity)
- Companies’ internal skills gap is cited as a problem by 39 percent of professionals. Interestingly, the same number report a belief that existing solutions are “good enough” as a significant issue. (Comptia 2024 Trends in Cybersecurity)
- Just 36 percent of organisations perform vulnerability assessments. (Comptia 2024 Trends in Cybersecurity)
Cybersecurity threats, preparedness and programs by country
It’s clear from the varied outcomes of the studies and surveys above that not all countries are equal when it comes to cybersecurity and internet freedom. Many are poorly equipped to handle cyber attacks, while others are better equipped but more frequently targeted.
This data visualization delves into a number of metrics that demonstrate the variety of threats we face online, looking at which countries deal with the highest number of threats and how they fare in terms of defenses.
The Global Cybersecurity Index (GCI) 2020 found that the US had the world’s highest commitment to cybersecurity preparedness, followed by the UK and Saudi Arabia. These nations mobilize resources to build and implement consistent information security strategies country-wide.
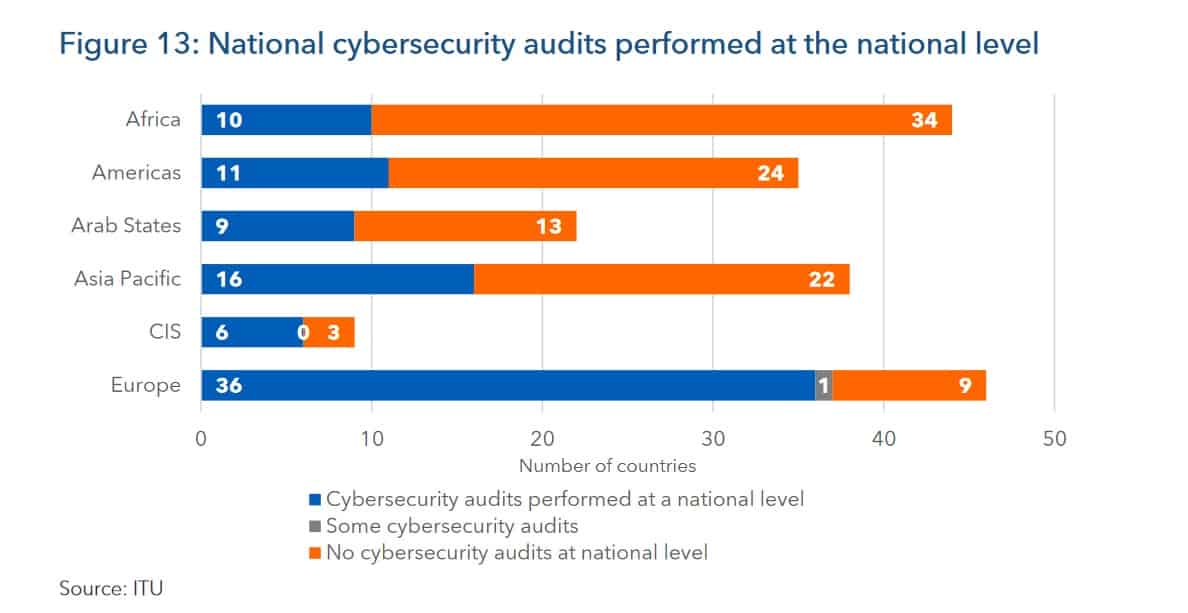
It also found that European countries were significantly more likely to perform cybersecurity audits than anywhere else in the world. This may be due to the scale and influence of the European Union, which requires member countries to abide by EU laws.
Countries such as Mexico, New Zealand, and Iceland fall mid-tier, as their cybersecurity programs are in the process of maturing.
At the same time,Chad, Libya, Yemen, the Vatican, and a long list of other countries are just initiating or establishing their information security programs.
The Imperva 2021 Cyberthreat Defense Report mentions that Colombia was hardest hit of all countries in 2020, with 93.9% of respondents reporting successful attacks (Imperva 2021 Cyberthreat Defense Report).
Malware is most commonly targeted at African and Asian countries, with residents up to five times as likely to face a malware attack than someone in the US. (Avira 2022 Threat Summary).
The US and China were both among the top three distributors AND targets of application-layer attacks in Q3 2022. Ukraine and Russia each saw a significant increase in the volume of attacks as a result of the ongoing conflict. (ENISA Threat Lanscape 2023)
For most countries, outdated infrastructure and staffing issues are the top challenges to developing and implementing an effective information security strategy:

The State of IT Security in Germany 2020
The homonymous report issued by Germany’s Federal Office for Information Security notes a few interesting aspects particular to the country’s cybersecurity program.
When it comes to attack tactics targeting state organizations, email is prevalent:
Around 82 emails per day were identified as malicious solely on the basis of anti-virus signatures specially created by the BSI.
In the first half of 2023, German authorities detected over 1.5 million new malware variants.

2020’s report found that just 27% of surveyed Germans used password managers, with 78% of respondents worried that an attacker could access all of their passwords in one go.
While the majority of all emails received by federal networks were spam, phishing, or malware-related (76%), overall, spam was only slightly more common than in 2018.

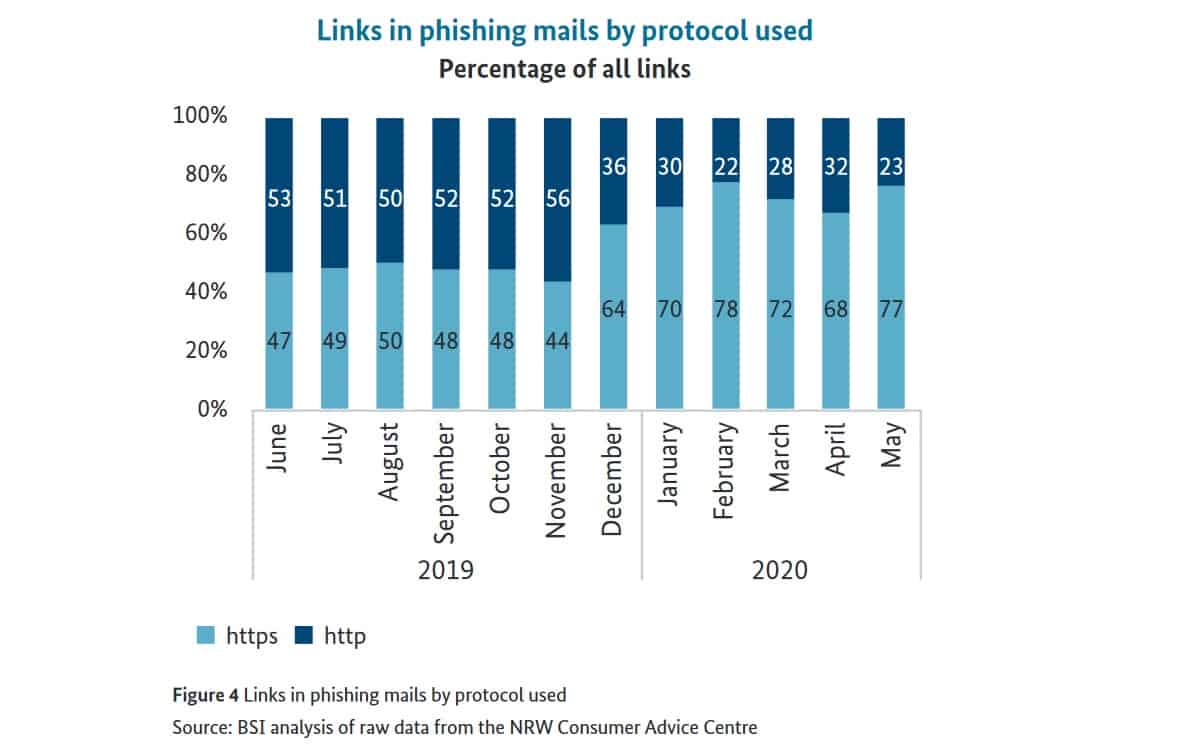
We’ve known since 2020 that the padlock-icon in your URL bar can no longer be relied upon as an indicator of a “safe” website. That year, the BSI found that 77% of links contained in phishing emails received were to websites using HTTPS.
The State of cybersecurity in Australia 2023
On the other side of the world, the Australian goverment’s annual Cyber Threat Report provides an outlook that compares the country’s cybersecurity performance with global data.
First off, there was a 23 percent increase in the number of reported cybercrimes in 2023. The average cost of each report went up 14 percent to $46,000 USD for a small business and $71,600 for a large business.

Australia’s protective Domain Name System blocked nearly 70 million malicious website requests — nearly twice as many as in 2022. Meanwhile, there were over 127,000 blocked attacks on Australian servers.
In 2022 and 2023, there were 143 reports of breaches at companies that identified themselves as “critical infrastructure”. The majority of these involved compromised accounts, credentials, assets, networks, or infastructure. In most other cases, the organization suffered denial of service attacks.
Cybercriminals have different strategies for different targets. Additionally, some areas are targeted more than others. Queensland and Victoria have more reports than they should, based on their populations, whereas the Northern Territory accounts for just one percent of all reports.

Top cybersecurity threats 2023
Reports of cybercrimes continue to create headlines around the world and this is unlikely to change throughout the year.
Here are some of the predictions being put forward regarding what we can expect to see through 2022 and beyond.
The Global Risks Report 2022 from the World Economic Forum provides a detailed outlook of how things look for individual users:
- 95 percent of cybersecurity issues can be traced back to human error. Further, almost half of all breaches are caused by insiders (sometimes accidentally, sometimes not.
- The cost of cyber insurance nearly doubled in Q3 of 2021, marking a substantial increase in the cost to small and medium businesses.
- Some attackers offer “triple extortion” as a service, which includes data leaks, ransomware, and DDoS attacks.
And here are some other interesting predictions for the future:
- Ransomware is expected to cost $10.5 trillion per year by 2025. (Cybersecurity Ventures)
- State-backed cyberattacks will become increasingly common, with the return of hacking-as-a-service organizations (Kaspersky)
- The WEF predicts increased anxieties around the lack of control people have over their personal data.
- Scammers will begin to utilize AI to impersonate specific individuals. (Kaspersky)
When it comes to a perspective on cybercrime trends beyond this year, the Europol Internet Organised Crime Threat Assessment (IOCTA) 2023 provides a well-documented outlook:
“Ransomware groups make use of forums on the clear and dark web to recruit new affiliates, pentesters, company insiders10 , IABs and money mules.”
Gartner predicts that unionization will increase by over 1,000 percent as workers come to truly appreciate the threat posed by generative AI.
7 easy ways to improve your privacy and security online
If you don’t want to be another statistic in next year’s report, we recommend you take a few simple steps toward protecting your privacy and security online.
Antivirus
Turn on your antivirus. There’s a good chance your computer already has antivirus software built in. If it doesn’t, or if you don’t think it’s sufficient, there are plenty of free and paid antivirus programs to avail of.
Modern antivirus programs typically have two methods of finding and removing malware from your system. The first is a simple system scan, in which the antivirus will sift through every file on your computer to look for, quarantine, and remove malware. The second is real-time scanning, in which running processes and downloaded files are scanned as they appear on your computer and flagged accordingly.
VPN
Short for virtual private network, a VPN encrypts all of your internet traffic and routes it through a remote server in a location of your choosing.
Commercial VPNs are typically paid subscription services that you can use by installing an app on your device. They have two primary effects.
The first is that all of your data is secured in an encrypted tunnel until it reaches the VPN server. This prevents your ISP and hackers on wifi networks from snooping on any of your internet activity and your traffic’s final destination.
The second is that your IP address, a unique number that can be used to identify your device and location, is masked behind the VPN’s server address. This helps to anonymize your internet activity.
Most commercial VPNs group dozens or even hundreds of users together under a single IP address, making it impossible to trace activity back to a single user.
VPNs can also be used to securely access geo-locked content that’s only accessible from certain countries, such as US Netflix or Hulu.
Comparitech has put together a list of the best VPN services.
Secure browser extensions
Your web browser is the window through which you see the internet, and it can do a lot of things, but is also vulnerable to a large number of attacks and exploits.
Fortunately, a few browser extensions can help protect your privacy and improve security online. Here is a shortlist of browser extensions we recommend:
- HTTPS Everywhere – opts for the SSL-encrypted versions of web pages whenever they are available
- Disconnect or Privacy Badger – prevents websites from using tracking cookies and similar technologies to monitor your online behavior
- Ad Block Plus – advertisements are a common attack vector by which to deliver malware and phishing ads to users. A good ad blocker can keep them at bay.
- NoScript or ScriptSafe – stops Javascript from loading on your browser by default, which prevents drive-by-downloads that can infect your computer with malware
Firewall
A firewall is an essential defense against unsolicited internet traffic coming or going from your computer.
Firewalls are installed on almost all modern operating systems and NAT firewalls on most routers. Keep them turned on and be selective about programs you allow to “phone home” through the firewall.
Passwords
Use strong, unique passwords. Task your password generator with creating random, unique passwords for each of your accounts. Relying on a password manager means you don’t have to memorize them or write them down.
If you don’t want to go that route, at least use a combination of upper and lower case letters, numbers, and symbols and try to make it as random as possible.
Never use the same password across all of your accounts. Never use your personal details that a hacker could figure out.
Good passwords will go a long way in protecting your accounts.
Phishing
Besides a good spam filter, there’s not much protection against phishing attempts. You just have to know how to spot them.
Don’t open links or attachments in unsolicited emails or text messages. Always look for valid HTTPS certificates on websites where you need to input a password or financial information.
If you’re unsure about an email, contact the sender by some other means or ask a question that only they would know to verify their identity.
Never, ever give out passwords or other private information in an email, SMS or instant message.
Read more: Common phishing scams and how to avoid them.
Security updates
Don’t ignore security updates. Even though they can be annoying, not updating your software not only endangers your device, but everyone on your network.
Once a security update has been issued, hackers will deliberately target that software and users who ignore the security updates. So always update as soon as it’s practical.
How to report cybercrime
If you’ve been a victim of cybercrime then you can find more information about reporting it using the links below:
UK: ActionFraud, National Crime Agency
Europe: Europol
Australia: ACORN
Canada: Public Safety Canada
Cybersecurity and cybercrime statistics FAQs
What are the most common types of cybercrime?
Cybercriminals are always looking for new ways to take advantage of people, businesses, and even governments. Online scams, such as phishing emails or pop-up windows that appear to be from trusted companies can trick you into providing financial information or downloading malware. Identity theft involves obtaining personal information such as passwords, Social Security numbers, or credit card numbers in order to access accounts without permission. Other cybercrimes include online harassment, stalking, computer viruses, and ransomware attacks that encrypt computer data until a ransom is paid. Protecting yourself against these threats requires vigilance, strong passwords, and up-to-date security software.
How are cybersecurity breaches identified?
Keeping an eye on network activity is one of the many ways that companies can prevent cyber-attacks – and it’s as important as ever. It requires a hawk-eye view of all data traveling across the network, with trained experts able to spot any suspicious activity or signs of malicious code quickly. This can be compared to a border patrol looking for contraband – noticing anything out of the ordinary and taking action before it becomes too late. Organizations should ensure that they have the right tools and personnel in place to detect any possible breaches efficiently, because cybercrime is like a game of hide-and-seek – only you have your eyes open!
Is cyberbullying a type of cybercrime?
Cyberbullying is no joking matter – in fact, it’s a crime! It goes beyond just sending offensive messages or embarrassing someone by posting photos without their permission. Cyberbullies can spread malicious rumors, create fake profiles to humiliate victims, and even break the law with impunity. Don’t let yourself be a victim of cybercrime – keep your digital footprints safe with strong passwords and up-to-date security software, and stay aware of the risks associated with using technology.
Which country has the harshest punishment for cybercrimes?
When it comes to cybercrimes, some countries don’t mess around. One nation that takes a hard stance on this type of crime is Singapore – they have the harshest punishments for cybercrimes, ranging from hefty fines to jail time. If you’re thinking of committing a digital misdemeanor, it’s best to stay away – even if the punishment isn’t as severe in another country, Singapore doesn’t take kindly to online mischief-makers!
Which industries are most vulnerable to cyberattacks?
While cyberattacks can target businesses and organizations in any sector, some industries are more vulnerable due to the nature of the data they handle, their reliance on digital systems, and their overall digital infrastructure. Some of the sectors most susceptible to cyberattacks include:
- Financial institutions such as banks, credit unions, and insurance companies handle sensitive financial data, making them prime targets for cybercriminals. Cyberattacks in this sector can lead to significant financial losses and undermine consumer trust.
- Healthcare providers store vast amounts of personal and medical data, which is highly valuable on the black market. The healthcare industry’s increased reliance on electronic health records and interconnected medical devices also creates vulnerabilities that cybercriminals can exploit.
- The retail industry processes millions of payment transactions daily, making it an attractive target for cybercriminals seeking to steal payment card information. Additionally, retailers often store large amounts of customer data, making them susceptible to data breaches.
- Government agencies are responsible for safeguarding sensitive information and maintaining critical infrastructure, making them attractive targets for cybercriminals and nation-state actors. Attacks on government systems can have far-reaching consequences, such as disrupting essential services and stealing classified information.
- The energy and utilities sector is essential for maintaining the reliable functioning of society, making it a prime target for cyberattacks. Cybercriminals may target this sector to cause widespread disruptions, while nation-state actors may target it for strategic purposes.
- Telecommunication companies are responsible for maintaining the networks that enable communication and data transfer. Cyberattacks on these networks can disrupt services, cause outages, and compromise users’ privacy.
- The manufacturing industry increasingly relies on digital systems and automation, making it more susceptible to cyberattacks. Cybercriminals may target this sector to steal intellectual property or disrupt production processes.
No industry is immune to cyberattacks, and any organization with an online presence or digital infrastructure can be targeted. As a result, businesses and organizations in all sectors must prioritize cybersecurity and implement robust security measures to protect their data and systems from cyber threats.
What steps can businesses take to improve their cybersecurity in light of these statistics?
Businesses can take several steps to improve their cybersecurity in light of the increasing threats:
- Multi-Layered Defense: Implement a multi-layered defense strategy that includes various protection measures across the organization’s systems, networks, programs, and data. This includes firewalls, DNS filtering, malware protection, antivirus software, and email security solutions.
- Educate Employees: Users must understand and comply with basic data security principles like choosing strong passwords, being wary of attachments in email, and backing up data. Regular training and awareness programs can help employees stay updated on the latest threats and how to avoid them.
- Establish a Cybersecurity Framework: Organizations should have a framework for dealing with attempted and successful cyber-attacks. This can guide you in identifying attacks, protecting systems, detecting and responding to threats, and recovering from successful attacks. The NIST cybersecurity framework is one well-respected example.
- Invest in Technology: Technology is essential to providing the tools to protect against cyber attacks. This includes protecting endpoint devices like computers, smart devices, routers; networks; and the cloud.
- Regularly Update and Patch Systems: Keeping all software, operating systems, and applications up-to-date is crucial in protecting against threats. Many cyber attacks exploit vulnerabilities in outdated systems.
- Implement Access Controls: Ensure that only the necessary individuals can access important information. This can help prevent unauthorized access and potential breaches.
- Regular Audits and Testing: Regular cybersecurity audits and penetration testing can help identify potential vulnerabilities and fix them before they can be exploited.
Great presentation, well done, with plenty of metrics with applicable visual displays. Plus, the steps businesses can take to improve their cybersecurity in light of the increasing threats are still viable.
Great Work ! It is great sources of cyber security statistics. Thank you very much for this great work..
I really appreciate the feedback and you taking the time to share it!
Awesome work! Saves us a lot of time trawling through multiple reports to get the right stats to present to the Board!! Well done…..keep it going
So great to hear that, Ravin! I hope the numbers serve your mission well!
Thanks Andra, saved me hours gathering stats and case studies from reports to present….awesome!
Keep it up!
So less comments, but so great work.
Thank you very much!
ANDRA ZAHARIA may I complement you on this report. No need to go anywhere else. Perfect!
Thank you, Fred! I really appreciate it and I’m glad you found it useful!
There’s a lot of good content here but there needs to be better clarity in regard to the differences between spam and phishing. Many times when you say spam, it appears that you are referring to phishing. Most definitions of spam describe it as a misuse of resources – perhaps a type of denial of service – without any malicious content.
Hi Erick!
I really appreciate the feedback! To stay true to the data included the reports I mentioned, I had to adopt their own perspective on spam and phishing, which sometimes differs from report to report.
I hope that brings some context.
excelent information
Great effort, Great report! I can see you must have worked really hard to gather all this info!
Greatly appreciated!
Really well done, thanks.
Thank you so much, Matt!
Amazing consolidation, I was looking for a while!
Thank you
Thanks for the work compiling all these sources. Super helpful!
This has given me really up to date stats so i can carry out my educational research, Thanks